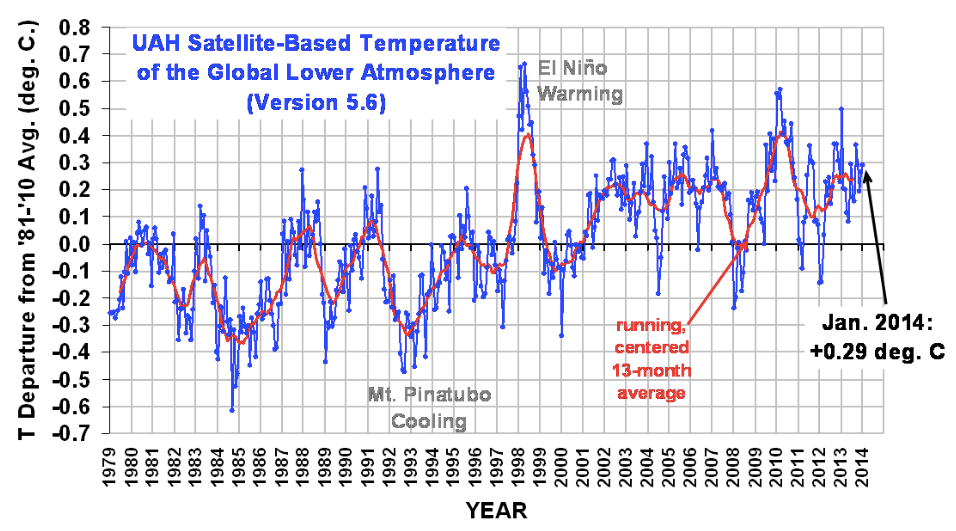
On February 5th, Dr Roy Spencer released the University of Alabama-Huntsville (UAH) global average lower tropospheric temperature anomaly as measured by satellite for January 2014.
The anomaly refers to the difference between the current temperature reading and the average reading for the period 1981 to 2010 as per satellite readings.
January 2014: Anomaly +0.29 degrees Celsius
This is the joint 5th warmest January temperature recorded since the satellite record was started in December 1978 (35 January observations). The warmest January to date over this period was in 2010, with an anomaly of +0.56 degrees Celsius.![]() The U.S. cold snap was not of sufficient severity to show up in the global temperature record.
The U.S. cold snap was not of sufficient severity to show up in the global temperature record.
As background, five major global temperature time series are collated: three land-based and two satellite-based. The terrestrial readings are from NASA GISS (Goddard Institute for Space Studies), HadCRU (Hadley Centre/Climate Research Unit in the U.K.), and NCDC (National Climate Data Center). The lower-troposphere temperature satellite readings are from RSS (Remote Sensing Systems, data not released to the general public) and UAH (Univ. of Alabama at Huntsville).
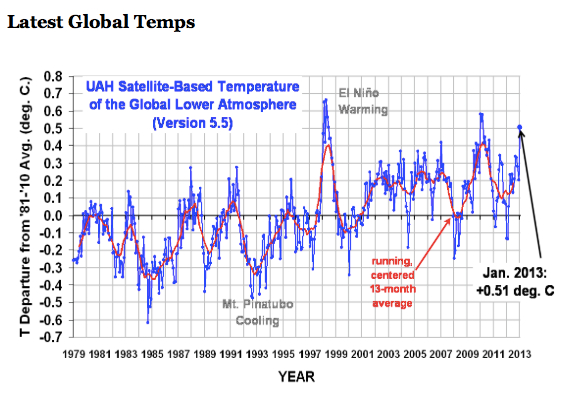
The most high profile satellite-based series is put together by UAH and covers the period from December 1978 to the present. Like all these time series, the data is presented as an anomaly (difference) from the average, with the average in this case being the 30-year period from 1981 to 2010. UAH data is the earliest to be released each month.
The official link to the data at UAH can be found here, but most months we get a sneak preview of the release via the climatologist Dr Roy Spencer at his blog.![]()
Spencer, and his colleague John Christy at UAH, are noted climate skeptics. They are also highly qualified climate scientists, who believe that natural climate variability accounts for most of recent warming. If they are correct, then we should see some flattening or even reversal of the upward trend within the UAH temperature time series over a long time period. To date, we haven’t (click for larger image).
That said, we also haven’t seen an exponential increase in temperature either, which would be required for us to reach the more pessimistic temperature projections for end of century. However, the data series is currently too short to rule out such rises in the future.
One of the initial reasons for publicising this satellite-based data series was due to concerns over the accuracy of terrestrial-based measurements (worries over the urban heat island effect and other factors). The satellite data series have now been going long enough to compare the output directly with the surface-based measurements. All the time series are now accepted as telling the same story (for a fuller mathematical treatment of this, see Tamino’s post at the Open Mind blog here).
Note that the anomalies produced by different organisations are not directly comparable since they have different base periods. Accordingly, to compare them directly, you need to normalise each one by adjusting them to a common base period.