Phylogeny and molecular evolution of green algae - Phycology ...
Phylogeny and molecular evolution of green algae - Phycology ...
Phylogeny and molecular evolution of green algae - Phycology ...

Create successful ePaper yourself
Turn your PDF publications into a flip-book with our unique Google optimized e-Paper software.
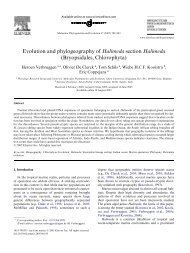
<strong>Phylogeny</strong> <strong>and</strong> <strong>molecular</strong> <strong>evolution</strong><br />
<strong>of</strong> <strong>green</strong> <strong>algae</strong><br />
Ellen Cocquyt
Universiteit Gent<br />
Faculteit Wetenschappen, Vakgroep Biologie<br />
Onderzoeksgroep Algologie<br />
<strong>Phylogeny</strong> <strong>and</strong> <strong>molecular</strong> <strong>evolution</strong> <strong>of</strong> <strong>green</strong> <strong>algae</strong><br />
Fylogenie en moleculaire evolutie van groenwieren<br />
Ellen Cocquyt<br />
Proefschrift voorgelegd tot het behalen van de graad van<br />
Doctor in de Wetenschappen: Biologie<br />
Academiejaar 2008-2009
Promotor: Pr<strong>of</strong>. Dr. O. De Clerck (Universiteit Gent)<br />
Co-promotor: Dr. H. Verbruggen (Universiteit Gent)<br />
Leden van de leescommissie:<br />
Pr<strong>of</strong>. Dr. K. Hoef-Emden (Universität zu Köln, Germany)<br />
Dr. P. Rouzé (Universiteit Gent)<br />
Pr<strong>of</strong>. Dr. A. V<strong>and</strong>erpoorten (Université de Liège)<br />
Overige leden van de examencommissie:<br />
Pr<strong>of</strong>. Dr. K. Sabbe (Universiteit Gent)<br />
Pr<strong>of</strong>. Dr. Erik Smets (Katholieke Universiteit Leuven <strong>and</strong> National Herbarium <strong>of</strong> the Nederl<strong>and</strong>s)<br />
Pr<strong>of</strong>. Dr. W. Vyverman (Universiteit Gent)<br />
Photographs cover: Frederik Leliaert <strong>and</strong> Heroen Verbruggen<br />
Photographs upper b<strong>and</strong>, from left to right <strong>and</strong> from top to bottom:<br />
Boodlea, Phyllodictyon, Dictyosphaeria, Ulva, Cladophora <strong>and</strong> Valonia<br />
Photographs lower b<strong>and</strong>, from left to right:<br />
Boergesenia, Codium, Halimeda, Dictyosphaeria <strong>and</strong> Cladophora<br />
Photographs at the back, from left to right <strong>and</strong> from top to bottom:<br />
Blastophysa, Trentepohlia, Ignatius <strong>and</strong> Chlamydomonas<br />
The research reported in this thesis was funded by the Special Research Fund (Ghent University,<br />
DOZA-01107605) <strong>and</strong> performed in the Research Group <strong>Phycology</strong> <strong>and</strong> the Center for Molecular<br />
Phylogenetics <strong>and</strong> Evolution, Biology Department, Ghent University, Krijgslaan 281-S8, B-9000,<br />
Ghent, Belgium. www.phycology.ugent.be
Dankwoord<br />
Vooreerst zou ik mijn promotor Olivier willen bedanken. Bijna negen jaar geleden stapte ik op het<br />
vliegtuig richting Zuid-Afrika. Ik mocht gedurende 2 ma<strong>and</strong>en wieren inzamelen langsheen de Zuid-<br />
Afrikaanse kust en zou leren ‘kijken’ naar roodwieren, samen met Olivier die daar toen gedurende<br />
een jaar aan de Universiteit van Kaapstad werkte. Op de luchthaven van Kaapstad aangekomen vroeg<br />
Olivier verwondert: “Is dat alles wat je mee hebt?”, wijzend naar mijn klein rugzakje. Tja, er zat een<br />
rugby team op het vliegtuig en niet alle bagage was meegeraakt. De mijne stond nog in Londen. ’t Is<br />
gelukkig allemaal goed gekomen en ik heb daar een fantastisch tijd gehad!<br />
Eenmaal ik mijn licentiaatdiploma behaalde, ging ik nog even langs het labo om goedendag te<br />
zeggen. Olivier stelde toen voor om met een Marie Curie beurs een tijdje bij Christine Maggs aan de<br />
Queen’s University <strong>of</strong> Belfast te gaan werken. Hm, ik zou eigenlijk net gaan samenwonen met Toon.<br />
Uiteindelijk ben ik toch vertrokken voor een half jaartje. Daar heb ik voor het eerst DNA<br />
geëxtraheerd en PCR’s gedaan, en eveneens een fantastisch tijd beleeft. Terug in België mocht ik<br />
onder voorwaarde dat ik een IWT beurs zou aanvragen, beginnen als laborante bij onze<br />
onderzoeksgroep. Die IWT beurs werd niets, maar na <strong>and</strong>erhalf jaar kon ik dan toch beginnen aan<br />
een doctoraat met een BOF beurs. Het resultaat daarvan is dit doctoraat!<br />
Olivier, bedankt om me te begeleiden doorheen al die jaren.<br />
Ten tweede, zou ik mijn co-promotor Heroen willen bedanken. Als laborante heb ik voor zijn<br />
doctoraat veel praktisch werk gedaan, maar het laatste <strong>and</strong>erhalf jaar heb ik ontzettend veel hulp<br />
van hem gekregen. Heroen, bedankt voor de hulp bij het analyseren van mijn gegevens en het snel<br />
en grondig nalezen en verbeteren van de teksten.<br />
Ten derde, zou ik Olivier, Heroen en Frederik willen bedanken om me te steunen. Zonder de talloze<br />
brainstormmomenten en de hulp van jullie alle drie bij het verwerken en uitschrijven van de<br />
resultaten, was ik nooit tot dit resultaat gekomen.<br />
Caroline, het was leuk om gedurende drie jaar bureau en labo met je te delen. Eveneens bedankt<br />
voor de hulp bij het praktisch werk. Andy en Renata, bedankt voor al het sequentiewerk.<br />
Kadriye thanks to help me with PCR’s <strong>and</strong> cloning <strong>of</strong> some <strong>of</strong> the nuclear genes. It was <strong>of</strong>ten a<br />
frustrating job, with a lot <strong>of</strong> trial <strong>and</strong> error.<br />
Koen Sabbe, Ann Willems en Paul De Vos, bedankt voor de tijd die jullie hebben vrij gemaakt om,<br />
vooral in het begin, te luisteren naar mijn vorderingen en me met jullie suggesties telkens een stapje<br />
vooruit te helpen. Ook Steven Robbens en Yves van de Peer hielpen me door me in het begin de kans<br />
te geven over het nog niet gepubliceerde Ostreococcus genoom te beschikken.<br />
Klaus Valentin, thanks for the cDNA service. The generation <strong>of</strong> this cDNA library was a big step<br />
forward during this PhD study. The people from VERTIS Biotechnologie AG (Freising , Germany) also<br />
helped a lot to solve the problems I encountered during the screening <strong>of</strong> the cDNA library.
Aan de mensen van de plantkunde in de Ledeganckstraat, het was altijd leuk en gezellig tijdens de<br />
middag <strong>of</strong> aan de k<strong>of</strong>fietafel. Liesbeth, op het bankje aan het kleine vijvertje was het ook steeds<br />
gezellig vertoeven. Ik heb daar goeie herinneringen aan!<br />
Het laatste <strong>and</strong>erhalf jaar was het met de mensen van op de Sterre minstens even gezellig tijdens de<br />
middagen in de Resto.<br />
Katrien en Elke, bedankt voor het nalezen van een stukje Nederl<strong>and</strong>stalige tekst.<br />
Eric, al wist je nooit goed waar ik nu precies mee bezig was, toch zou ik je willen bedanken om me<br />
warm te maken voor de algologie, en om je vlucht naar Sri Lanka te verzetten zodat je aanwezig kunt<br />
zijn op mijn publieke verdediging.<br />
Ook mijn ouders en vrienden zou ik willen bedanken om me steeds te blijven steunen doorheen de<br />
jaren.<br />
En tenslotte, Toon die nu al bijna negen jaar lang mijn vriend is… nog vele fijne jaren voor ons!<br />
Ellen<br />
juni 2009
Contents<br />
Chapter 1 General introduction <strong>and</strong> thesis outline 1<br />
Chapter 2 Ancient relationships among <strong>green</strong> <strong>algae</strong> inferred from nuclear <strong>and</strong><br />
chloroplast genes<br />
Chapter 3 Gain <strong>and</strong> loss <strong>of</strong> elongation factor genes in <strong>green</strong> <strong>algae</strong> 43<br />
Chapter 4 Complex phylogenetic distribution <strong>of</strong> a non-canonical genetic code in <strong>green</strong><br />
<strong>algae</strong><br />
Chapter 5 Codon usage bias <strong>and</strong> GC content in <strong>green</strong> <strong>algae</strong> 81<br />
Chapter 6 A multi-locus time-calibrated phylogeny <strong>of</strong> the siphonous <strong>green</strong> <strong>algae</strong> 91<br />
Chapter 7 Systematics <strong>of</strong> the marine micr<strong>of</strong>ilamentous <strong>green</strong> <strong>algae</strong> Uronema curvatum<br />
<strong>and</strong> Urospora microscopica (Chlorophyta)<br />
Chapter 8 General discussion 129<br />
References 143<br />
Summary 161<br />
Samenvatting 165<br />
19<br />
69<br />
115
1<br />
Introduction<br />
Algae<br />
Algae are a large <strong>and</strong> diverse group <strong>of</strong> eukaryotic photosynthetic organisms occurring in almost every<br />
habitat. They exhibit a huge morphological diversity, ranging from tiny unicells to huge kelps over 50<br />
m long. The first algal groups arose between 1 <strong>and</strong> 1.5 billion years ago (Douzery et al. 2004, Yoon et<br />
al. 2004) after the symbiogenesis <strong>of</strong> a heterotrophic eukaryotic organism with a photosynthetic<br />
cyanobacterium. This event gave rise to the primary plastids which are still present in the<br />
Glaucophyta, red <strong>algae</strong> <strong>and</strong> <strong>green</strong> lineages including l<strong>and</strong> plants (Reyes-Prieto et al. 2007). These<br />
three lineages are collectively called Plantae or Archaeplastida (Cavalier-Smith 1981, Adl et al. 2005).<br />
The other photosynthetic protists arose through secondary endosymbiosis <strong>of</strong> either a <strong>green</strong> or a red<br />
alga. The euglenids <strong>and</strong> chlorarachniophytes are thought to have acquired their plastids from a <strong>green</strong><br />
alga in two separate secondary endosymbiotic events, while <strong>molecular</strong> evidence suggests that the<br />
red algal plastid <strong>of</strong> cryptomonads, heterokonts, haptophytes, apicomplexans <strong>and</strong> din<strong>of</strong>lagellates was<br />
acquired by a single secondary endosymbiosis in their common ancestor (Archibald 2005, Archibald<br />
2008). This process <strong>of</strong> serial cell capture <strong>and</strong> subsequent enslavement explains the diversity <strong>of</strong><br />
photosynthetic eukaryotes. Endosymbiosis forms the l<strong>and</strong>mark <strong>evolution</strong>ary event, responsible for<br />
the spread <strong>of</strong> photosynthesis through the Eukaryotic tree <strong>of</strong> life. Photosynthesis occurs in four <strong>of</strong> the<br />
six supergroups: Archaeplastida (Glaucophyta, red <strong>algae</strong>, <strong>green</strong> plants), Chromalveolata<br />
(cryptophytes, Stramenopila or heterokonts including diatoms <strong>and</strong> brown <strong>algae</strong>, haptophytes <strong>and</strong><br />
din<strong>of</strong>lagallates), Rhizaria (Chlorarachniophyta) <strong>and</strong> Excavata (euglenoids) (Fig. 1).<br />
Figure 1. Eukaryotic tree <strong>of</strong> life. The first<br />
<strong>algae</strong> arose after the symbiogenesis <strong>of</strong> a<br />
heterotrophic eukaryotic organism with a<br />
photosynthetic cyanobacterium, giving rise<br />
to the Archaeplastida. The other<br />
photosynthetic protists arose through<br />
secondary endosymbiosis <strong>of</strong> either a <strong>green</strong><br />
or a red alga <strong>and</strong> occur in four <strong>of</strong> six<br />
supergroups (marked with respectively<br />
<strong>green</strong> <strong>and</strong> red circles). The monophyly <strong>of</strong><br />
the Archaeplastida is well-supported <strong>and</strong><br />
most recent evidence favours the<br />
Glaucophyta as earliest diverging lineage<br />
within the Archaeplastida (modified after<br />
Baldauf 2008, Lane <strong>and</strong> Archibald 2008).
2 CHAPTER 1<br />
Archaeplastida<br />
The monophyly <strong>of</strong> primary plastids has long been suggested by several features, such as a similar<br />
gene content <strong>of</strong> plastid genomes, the presence <strong>of</strong> plastid-specific gene clusters that are distinct from<br />
those found in Cyanobacteria, the conservation <strong>of</strong> the plastid-protein import machinery <strong>and</strong> proteintargeting<br />
signals, <strong>and</strong> phylogenies based on plastid <strong>and</strong> cyanobacterial gene sequences (Palmer<br />
2003). Nevertheless, several single-gene phylogenies <strong>and</strong> a few multigene phylogenies have<br />
challenged this hypothesis (e.g., Stiller et al. 2001, Nozaki et al. 2003a, Nozaki et al. 2003b, Stiller <strong>and</strong><br />
Harrell 2005). Conclusive evidence for the monophyly <strong>of</strong> the Glaucophyta, red <strong>algae</strong> <strong>and</strong> <strong>green</strong> plants<br />
was provided only relatively recently by Rodriguez-Ezpeleta et al. (2005) based on: (1) chloroplast<br />
gene phylogenies showing the monophyly <strong>of</strong> primary plastid <strong>and</strong> (2) a phylogenomic dataset<br />
containing 143 nuclear genes, ca. 30,000 amino acid positions which show the monophyly <strong>of</strong> all<br />
organisms with a primary plastid (Fig. 1). The latter study, however, could not reveal the relation<br />
among the three major lineages. Several nuclear genes suggest that red <strong>algae</strong> are the earliest<br />
diverging Archaeplastida, but such results are inconsistent with many plastid gene trees that identify<br />
glaucophytes as the earliest divergence. Most recent evidence favours the early divergence <strong>of</strong><br />
glaucophytes, as demonstrated by Reyes-Prieto et al. (2007) using a concatenated dataset <strong>of</strong><br />
conserved nuclear-encoded plastid targeted proteins <strong>of</strong> cyanobacterial origin. The latter <strong>evolution</strong>ary<br />
scenario corroborates with two important putatively ancestral characters shared by glaucophyte<br />
plastids <strong>and</strong> the cyanobacterial endosymbiont that gave rise to this organelle: the presence <strong>of</strong><br />
carboxysomes <strong>and</strong> a peptidoglycan deposition between the two organelle membranes. Both traits<br />
were apparently lost in the common ancestor <strong>of</strong> red <strong>and</strong> <strong>green</strong> <strong>algae</strong> after the divergence <strong>of</strong><br />
glaucophytes.<br />
Figure 2. The <strong>green</strong> <strong>algae</strong> exhibit a remarkable cytological diversity ranging from unicellar organisms (coccoid<br />
or flagellates), over multicellular filaments <strong>and</strong> foliose blades, to coenocytic <strong>and</strong> siphonous life forms that are<br />
essentially composed <strong>of</strong> a single giant cell containing countless nuclei (after Coppejans 1998). Arrows indicate<br />
trends in morphological complexity rather than <strong>evolution</strong>ary hypotheses. For example, <strong>green</strong> <strong>algae</strong> are thought<br />
to have evolved from a unicellular flagellate (the Ancestral Green Flagellate, AGF) rather than a coccoid life<br />
form.
Green lineage or Viridiplantae<br />
INTRODUCTION 3<br />
Green <strong>algae</strong> are distributed worldwide <strong>and</strong> can be found in almost every habit ranging from polar to<br />
tropical marine, freshwater <strong>and</strong> terrestrial environments <strong>and</strong> as symbionts (Pröschold <strong>and</strong> Leliaert<br />
2007). They exhibit a remarkable cytological diversity ranging from the world’s smallest free-living<br />
eukaryote known to date Ostreococcus taurii (Derelle et al. 2006), over multicellular filaments <strong>and</strong><br />
foliose blades, to siphonous life forms that are essentially composed <strong>of</strong> a single giant cell containing<br />
countless nuclei (Fig. 2). Together with l<strong>and</strong> plants, <strong>green</strong> <strong>algae</strong> form the <strong>green</strong> lineage or<br />
Viridiplantae (also written as Virideaplantae or known as <strong>green</strong> plants, Chlorobionta, Chloroplastida<br />
or Chlorophycophyta). Morphological <strong>and</strong> <strong>molecular</strong> studies have identified a major split within the<br />
Viridiplantae giving rise to two monophyletic lineages, the Chlorophyta <strong>and</strong> the Streptophyta<br />
(Pickett-Heaps <strong>and</strong> Marchant 1972, Lewis <strong>and</strong> McCourt 2004) (Fig. 3). The streptophytes comprise<br />
several lineages <strong>of</strong> predominantly freshwater <strong>green</strong> <strong>algae</strong> (<strong>of</strong>ten called charophytes or charophyte<br />
<strong>green</strong> <strong>algae</strong>) <strong>and</strong> the l<strong>and</strong> plants (Embryophyta) which evolved roughly 470 million years ago from a<br />
charophyte ancestor. The majority <strong>of</strong> <strong>green</strong> <strong>algae</strong>, however, belong to the Chlorophyta.<br />
Streptophyta<br />
When motile cells are present, the Streptophyta are characterized by biflagellate cells with<br />
asymmetrically flagellar roots including a multilayered structure or MLS (a distinct parallel<br />
arrangement <strong>of</strong> microtubules) <strong>and</strong> a smaller root. In all representatives the nuclear envelope breaks<br />
down before the chromosomes separate (open mitosis) <strong>and</strong> the mitotic spindle is persistent which<br />
helps to keep the daughter nuclei separate until cytokinesis has been accomplished. Biochemical<br />
characters such as photorespiratory enzymes are different from those found in most chlorophyte<br />
<strong>green</strong> <strong>algae</strong> (Figs. 4 <strong>and</strong> 5; Table 1).<br />
Several phylogenetic studies have tried to determine the origins <strong>of</strong> the l<strong>and</strong> plants, focussing on the<br />
<strong>green</strong> algal progenitors <strong>of</strong> the Streptophyta. Recent studies have indicated the scaly <strong>green</strong> flagellate<br />
Mesostigma as the earliest diverging streptophyte. Initially, the scaly flagellate was placed within the<br />
prasinophytes (Mattox <strong>and</strong> Stewart 1984), later ultrastructural investigations (e.g. a flagellum which<br />
is anchored in the cell by means <strong>of</strong> an asymmetric root) revealed the association with the<br />
Streptophyta (Melkonian 1989). Molecular phylogenies also showed conflicting results regarding the<br />
phylogenetic relationships <strong>of</strong> this enigmatic species: Mesostigma either diverges before the<br />
Chlorophyta/Streptophyta split (Lemieux et al. 2000, Turmel et al. 2002a, Turmel et al. 2002b) or as<br />
an early diverging flagellate within the Streptophyta (Bhattacharya et al. 1998, Marin <strong>and</strong> Melkonian<br />
1999, Karol et al. 2001). Increasing taxon <strong>and</strong> gene sampling <strong>and</strong> the use <strong>of</strong> more realistic models <strong>of</strong><br />
<strong>evolution</strong> provide evidence that Mesostigma is an early diverging lineage within the Streptophyta<br />
(Petersen et al. 2006, Lemieux et al. 2007, Rodriguez-Ezpeleta et al. 2007). The colonial soil alga<br />
Chlorokybus diverges after Mesostigma in most phylogenies (Karol et al. 2001), although more recent<br />
studies united Mesostigma <strong>and</strong> Chlorokybus as the earliest diverging branch <strong>of</strong> the Streptophyta<br />
(Lemieux et al. 2007). Unbranched filaments that form the class Klebsormidiophyceae diverge next,<br />
followed by the Zygnematophyceae clade, which includes unicells <strong>and</strong> unbranched filaments with<br />
isogamous sexual reproduction. The more complex charophytes are Coleochaetophyceae <strong>and</strong><br />
Charophyceae both consisting <strong>of</strong> branched filaments with oogamous sexual reproduction. It remains
4 CHAPTER 1<br />
inconclusive from which group <strong>of</strong> <strong>algae</strong> Embryophytes emerged. Karol et al. (2001) resolved the<br />
stoneworts (Charophyceae) as the closest relatives <strong>of</strong> the Embryophyta, while evidence from plastid<br />
genomes point toward the conjugating <strong>algae</strong> or Zygnematophyceae (Lemieux et al. 2007).<br />
Figure 3. Phylogenetic relationships between <strong>green</strong> <strong>algae</strong> inferred from several phylogenetic studies:<br />
Streptophyta (Karol et al. 2001: SSU nrDNA, mitochondrial nad5 gene <strong>and</strong> plastid rbcL <strong>and</strong> atpB genes),<br />
prasinophytes (Guillou et al. 2004: SSU nrDNA), Trebouxiophyceae (Karsten et al. 2005: SSU nrDNA),<br />
Chlorophyceae (Turmel et al. 2008: chloroplast genes), Ulvophyceae (Lopez-Bautista <strong>and</strong> Chapman 2003: SSU<br />
nrDNA) <strong>and</strong> (Watanabe <strong>and</strong> Nakayama 2007: SSU nrDNA). The main interest <strong>of</strong> chapter 2 is to resolve relations<br />
between Ulvophyceae, Trebouxiophyceae <strong>and</strong> Chlorophyceae (1) <strong>and</strong> among Ulvophyceae (2). Representatives<br />
from each clade are studied (except those marked in gray).
INTRODUCTION 5<br />
Figure 4. Variation in flagellar apparatuses found among <strong>green</strong> <strong>algae</strong>, viewed from the top (upper figure) <strong>and</strong><br />
from the side (lower figure), modified after Graham et al. (2009) <strong>and</strong> Pröshold <strong>and</strong> Leliaert (2007). The flagellar<br />
apparatus generally include two or four basal bodies (shown here as rectangles or cylinders), microtubular<br />
roots (s or d), <strong>and</strong> distal (DF) or proximal (PF) connecting fibers. A. Flagellar apparatus with cruciate roots <strong>and</strong><br />
basal bodies displaced in counter-clockwise direction. B. Flagellar apparatus with cruciate roots showing<br />
directly opposed placement <strong>of</strong> flagellar basal bodies. C. Flagellar apparatus with clockwise displaced flagellar<br />
basal bodies. D. Flagellar apparatus with parallel basal bodies <strong>and</strong> asymmetrical distribution <strong>of</strong> the flagellar<br />
roots, showing the characteristic multilayered structure (MLS).<br />
Figure 5. Ultrastructural features <strong>of</strong> <strong>green</strong> <strong>algae</strong>. 1.<br />
Comparison <strong>of</strong> cytokinesis among <strong>green</strong> <strong>algae</strong><br />
(after Graham et al. 2009). A. Phycoplasts, arrays<br />
<strong>of</strong> microtubules which lie parallel to the developing<br />
cleavage furrow, are <strong>of</strong>ten present in the<br />
Chlorophyceae <strong>and</strong> Trebouxiophyceae. B.<br />
Furrowing, sometimes with involvement <strong>of</strong><br />
microtubules, is observed in the early charophytes<br />
<strong>and</strong> some Ulvophyceae. C. Phragmoplasts very<br />
similar, if not identical, to those <strong>of</strong> l<strong>and</strong> plants are<br />
found in later diverging charophytes <strong>and</strong> the<br />
Trentepohliales (Ulvophyceae). Little furrowing is<br />
involved, the cell plates develop from the center<br />
toward the cell periphery. Microtubules arranged<br />
perpendicular to the developing cell plate. 2.<br />
Different types <strong>of</strong> mitosis among <strong>green</strong> <strong>algae</strong><br />
during the metaphase indicating the fate <strong>of</strong> the<br />
nuclear envelope <strong>and</strong> position <strong>of</strong> the centrioles<br />
(after Graham et al. 2009). A. Closed mitosis. B.<br />
Metacentric mitosis C. Open mitosis.
6 CHAPTER 1<br />
Chlorophyta<br />
The current classification <strong>of</strong> the Chlorophyta, which relies on a combination <strong>of</strong> morphology,<br />
ultrastructural features <strong>of</strong> the flagellar root system, <strong>and</strong> characters relating to the mitotic spindle<br />
during cell division <strong>and</strong> cytokinesis, has been largely confirmed by phylogenetic analysis (Figs. 4 <strong>and</strong><br />
5, Table 1) (Mattox <strong>and</strong> Stewart 1984, Pröschold <strong>and</strong> Leliaert 2007). Four major groups, commonly<br />
regarded as classes, are recognized by consensus: “Prasinophyceae”, Chlorophyceae,<br />
Trebouxiophyceae <strong>and</strong> Ulvophyceae (Fig. 3) (reviewed in Lewis <strong>and</strong> McCourt 2004). The<br />
prasinophytes form a paraphyletic group <strong>of</strong> unicellular flagellates or coccoid cells at the base <strong>of</strong> the<br />
Chlorophyta (Steinkötter et al. 1994, Fawley et al. 2000, Lopez-Bautista <strong>and</strong> Chapman 2003, Guillou<br />
et al. 2004). The Ulvophyceae, Trebouxiophyceae <strong>and</strong> Chlorophyceae are resolved as a wellsupported<br />
clade (UTC clade) in most studies (Mishler et al. 1994), but the relationships among these<br />
lineages form the basis <strong>of</strong> a longst<strong>and</strong>ing debate. Furthermore, the monophyly <strong>of</strong> the three classes<br />
remains to be demonstrated unequivocally (O'Kelly <strong>and</strong> Floyd 1984a, Zechman et al. 1990, Krienitz et<br />
al. 2003).<br />
Certain ultrastructural characteristic are shared between the Ulvophyceae, Trebouxiophyceae <strong>and</strong><br />
Chlorophyceae. In all representatives the nuclear envelope remains intact until the chromosomes<br />
finally separate (closed mitosis). The flagella are anchored in the cell by means <strong>of</strong> cruciate flagellar<br />
roots with mostly an X-2-X-2 configuration <strong>of</strong> the microtubules (Moestrup 1978, Lewis <strong>and</strong> McCourt<br />
2004). Other ultrastructural observations are useful diagnostic characters to separate the three<br />
classes. The orientation <strong>of</strong> the basal bodies, short cylindrical arrays <strong>of</strong> microtubules at the base <strong>of</strong> a<br />
flagellum, is one <strong>of</strong> those discriminative characters. The Ulvophyceae <strong>and</strong> Trebouxiophyceae have a<br />
counter-clockwise orientation <strong>of</strong> the basal bodies, while the Chlorophyceae have a direct opposite or<br />
clockwise orientation <strong>of</strong> the basal bodies (Fig. 4) (Lewis <strong>and</strong> McCourt 2004). The Ulvophyceae have a<br />
persistent mitotic spindle which helps to keep the daughter nuclei separate until cytokinesis has<br />
been accomplished. The Trebouxiophyceae <strong>and</strong> Chlorophyceae both have a non-persistent mitotic<br />
spindle <strong>and</strong> a phycoplast composed <strong>of</strong> a set <strong>of</strong> microtubules which lie parallel to the plane <strong>of</strong><br />
cytokinesis (Fig. 5) (Friedl 1995, Lewis <strong>and</strong> McCourt 2004). Based on these ultrastructural<br />
observations Mattox <strong>and</strong> Stewart (1984) suggest that the Ulvophyceae diverged first, followed by the<br />
Trebouxiophyceae <strong>and</strong> Chlorophyceae (Fig. 6). While Mattox <strong>and</strong> Stewart (1984) based their<br />
classification on the orientation <strong>of</strong> the basal bodies in the flagellar apparatus <strong>and</strong> differences <strong>of</strong> the<br />
mitotic spindle during cell division <strong>and</strong> cytokinesis, Sluiman (1989) only used the orientation <strong>of</strong> basal<br />
bodies in the flagellar apparatus as diagnostic character <strong>and</strong> merged the Trebouxiophyceae with the<br />
Ulvophyceae based on the counter-clockwise orientation <strong>of</strong> the basal bodies in the flagellar<br />
apparatus (Fig. 6).<br />
Molecular phylogenetic studies have been highly inconclusive about the relationships between UTC<br />
classes (Fig. 6). The first <strong>molecular</strong> phylogenies based on small subunit nuclear ribosomal DNA (SSU<br />
or 18S nrDNA) sequences all observed that Ulvophyceae branch first, leaving Trebouxiophyceae <strong>and</strong><br />
Chlorophyceae as sisters (Friedl 1995, Bhattacharya et al. 1996, Krienitz et al. 2001, Lopez-Bautista<br />
<strong>and</strong> Chapman 2003), while more recent SSU nrDNA phylogenitic studies using exp<strong>and</strong>ed taxon<br />
sampling <strong>and</strong> likelihood-based methods with more realistic models <strong>of</strong> sequence <strong>evolution</strong> revealed a<br />
sister relation between Chlorophyceae <strong>and</strong> Ulvophyceae (Friedl <strong>and</strong> O'Kelly 2002, Lewis <strong>and</strong> Lewis<br />
2005, Watanabe <strong>and</strong> Nakayama 2007). Chloroplast gene order data <strong>and</strong> genomic structural features
INTRODUCTION 7<br />
(shared gene losses <strong>and</strong> rearrangements within conserved gene clusters), along with a phylogenetic<br />
analysis <strong>of</strong> seven mitochondrial genes supported this sister relation between Ulvophyceae <strong>and</strong><br />
Chlorophyceae, while phylogenetic analysis <strong>of</strong> 58 concatenated chloroplast genes supported a sister<br />
relation between Ulvophyceae <strong>and</strong> Trebouxiophyceae (Pombert et al. 2004, Pombert et al. 2005). In<br />
this way, all possible relations between the UTC <strong>algae</strong> have been proposed the latest decennia.<br />
Figure 6. The three alternative topologies for Ulvophyceae, Trebouxiophyceae <strong>and</strong> Chlorophyceae (UTC) have<br />
been supported by ultrastructural characteristics, <strong>molecular</strong> phylogenies <strong>and</strong>/or genomic structural features.<br />
“Prasinophyceae” – The prasinophytes are planktonic <strong>and</strong> predominantly marine unicellular<br />
flagellates (with one to eight flagella) or coccoid organisms exhibiting a wide variety <strong>of</strong> ultrastructural<br />
features <strong>and</strong> photosynthetic pigment signatures (see O'Kelly 2007 <strong>and</strong> references therein). The cells<br />
<strong>and</strong> flagella <strong>of</strong> many members are covered by up to seven distinct types <strong>of</strong> organic scales, which are<br />
formed in the Golgi apparatus. The absence <strong>of</strong> clear synapomorphies suggest that the prasinophytes<br />
are not monophyletic but rather form a cluster <strong>of</strong> several independent lineages (Chlorodendrales,<br />
Picocystis clade, Pycnococcus clade, Nephroselmis clade, Mamiellales, Prasinococcales,<br />
Pyramimonadales) at the base <strong>of</strong> the Chlorophyta, which have been formally described <strong>and</strong><br />
confirmed by SSU nrDNA phylogenies (Fig. 3 + Table 1) (Steinkötter et al. 1994, Fawley et al. 2000,<br />
Guillou et al. 2004, Turmel et al. 2009). It should be noted that our knowledge <strong>of</strong> these diverse,<br />
mainly picoplanktonic <strong>algae</strong> is far from comprehensive. The application <strong>of</strong> new technologies such<br />
environmental sequencing results in the discovery <strong>of</strong> new lineages, the majority <strong>of</strong> which remains<br />
hitherto uncultured <strong>and</strong> undescribed.<br />
The Chlorodendrales (Tetraselmis <strong>and</strong> Scherffelia) is the only prasinophyte lineage which is robustly<br />
placed at the base <strong>of</strong> the UTC clade in <strong>molecular</strong> phylogenies <strong>and</strong> which is characterised by the<br />
presence <strong>of</strong> a counter-clockwise orientation <strong>of</strong> the basal bodies, a non-persistent mitotic spindle <strong>and</strong><br />
the occurrence <strong>of</strong> a phycoplast. All the rest <strong>of</strong> the prasinophytes contain ancestral morphological<br />
treats, which makes it difficult to assign them either to the Chlorophyta or Streptophyta. In this view,<br />
the Pyramimonadales are crucial in our underst<strong>and</strong>ing <strong>of</strong> the early history <strong>of</strong> <strong>green</strong> plants. The<br />
combination <strong>of</strong> a well-represented fossil record, a flagellar apparatus configuration from which all<br />
other patterns in the <strong>green</strong> plants can be plausibly derived by reduction, <strong>and</strong> the only documented<br />
instances <strong>of</strong> phagotrophic mixotrophy suggests that the Pyramimonadales are the modern<br />
representatives <strong>of</strong> the earliest <strong>green</strong> <strong>algae</strong> (O’Kelly 2007). The prasinophytes further contain<br />
Ostreococcus tauri (Mamiellales), which is the smallest free-living eukaryote <strong>and</strong> which has the
8 CHAPTER 1<br />
smallest nuclear genome <strong>of</strong> all photosynthetic eukaryotes (Derelle et al. 2006) <strong>and</strong> Nephroselmis<br />
(Nephroselmidales) a small unicellular flagellate.<br />
Trebouxiophyceae - The Trebouxiophyceae mainly consist <strong>of</strong> freshwater (e.g. Chlorella) <strong>and</strong><br />
terrestrial <strong>algae</strong> (e.g. the phycobiont Trebouxia in lichens), some members (e.g. Prasiola) occur in<br />
marginally marine habitats. In contrast to most trebouxiophytes, the genus Prototheca is colorless<br />
<strong>and</strong> obligately heterotrophic <strong>and</strong> mainly lives in soil, but there are also some disease causing species.<br />
The enigmatic parasitic alga Helicosporidium is closely related to Prototheca (Tartar et al. 2002).<br />
Trebouxiophyceae occur as non-flagellate unicells or colonies, unbranched or branched filaments, or<br />
small blades (e.g. Prasiola) similar to those found among Ulvophyceae. Trebouxiophyceae commonly<br />
produce asexual, non-motile autospores. Sexual reproduction, involving flagellate sperm <strong>and</strong> nonmotile<br />
eggs, is only known for some representatives (e.g. Prasiola).<br />
The Trebouxiophyceae are characterized by a combination <strong>of</strong> ultrastructural characteristics: counterclockwise<br />
orientation <strong>of</strong> the basal bodies (Fig. 4), non-persistent metacentric mitotic spindles (Fig.<br />
5B) <strong>and</strong> the presence <strong>of</strong> a phycoplast (Fig. 5A), none <strong>of</strong> which is unique to the class. The basal body<br />
orientation is shared with the Ulvophyceae, metacentric spindles with the prasinophytes <strong>and</strong> nonpersistent<br />
spindles <strong>and</strong> phycoplasts with the Chlorophyceae. The monophyly <strong>of</strong> the<br />
Trebouxiophyceae has still to be proven due to the lack <strong>of</strong> unique structural or reproductive features<br />
<strong>and</strong> the failure <strong>of</strong> <strong>molecular</strong> phylogenetic studies to support monophyly (Krienitz et al. 2003, Lewis<br />
<strong>and</strong> McCourt 2004).<br />
Chlorophyceae - The Chlorophyceae mainly contain freshwater <strong>and</strong> terrestrial <strong>green</strong> <strong>algae</strong>. The class<br />
exhibits all major body plans found among <strong>green</strong> <strong>algae</strong>: unicells (flagellates <strong>and</strong> non-flagellates),<br />
sarcinoid organisms which are composed <strong>of</strong> packets <strong>of</strong> non-motile cells, colonies, unbranched or<br />
branched filaments <strong>and</strong> some multinucleate organisms. Asexual reproduction <strong>of</strong>ten occurs by means<br />
<strong>of</strong> flagellated zoospores but can also occur with non-motile aplanospores or autospores. Sexual<br />
reproduction may be isogamous, involving gametes that are morphological identical; anisogamous, in<br />
which case flagellate gametes are structurally distinguishable; or oogamous, with a large non-motile<br />
egg <strong>and</strong> smaller flagellate sperm. When sexual reproduction is present, Chlorophyceae always have a<br />
haploid vegetative phase <strong>and</strong> a single celled, <strong>of</strong>ten dormant, zygote as diploid stage (zygotic meiosis).<br />
Cell division is fairly uniform among Chlorophyceae <strong>and</strong> includes closed mitosis <strong>and</strong> a non-persitent<br />
mitotic spindle which collapses before cytokinesis. Cleavage is mostly mediated by a phycoplast but<br />
some Chlorophyceae divide by simple centripetal furrowing <strong>of</strong> the cell wall. The production <strong>of</strong> a cell<br />
plate that develops centrifugally by fusion <strong>of</strong> Golgi-derived vesicles in which case plasmodesmata or<br />
channels through the cell wall will allow intercellular communication after division have been<br />
reported for Cylindrocapsa <strong>and</strong> Uronema (see chapter 7 <strong>and</strong> van den Hoek et al. 1995, Graham et al.<br />
2009).<br />
The monophyly <strong>of</strong> the Chlorophyceae is corroborated by the presence <strong>of</strong> clockwise or direct opposite<br />
flagellar root supports (Fig. 4). The two major clades are formed by the Chlamydomonadales<br />
(clockwise basal body orientation) which include genera like Chlamydomonas <strong>and</strong> Volvox <strong>and</strong> the
INTRODUCTION 9<br />
Sphaeropleales (direct opposite basal body orientation) which contain for instance Scenedesmus.<br />
Other orders are Chaetophorales, Chaetopeltidales <strong>and</strong> Oedogoniales (Turmel et al. 2008).<br />
Ulvophyceae - The Ulvophyceae mainly include marine <strong>green</strong> macro<strong>algae</strong> among which some wellknown<br />
<strong>green</strong> <strong>algae</strong> such as the sea lettuce Ulva, the model organism Acetabularia <strong>and</strong> the weedy<br />
Codium <strong>and</strong> Bryopsis. Morphological diversity ranges from flagellate <strong>and</strong> non-flagellate unicells <strong>and</strong><br />
colonies to branched <strong>and</strong> unbranched filaments, foliose blades <strong>and</strong> multinucleate life forms. The<br />
sexual life cycle <strong>of</strong> most Ulvophyceae involves an alternation between a diploid sporophyte <strong>and</strong><br />
haploid, free-living gametophytes (sporic meiosis), but zygotic meiosis with a haploid vegetative<br />
phase <strong>and</strong> single celled zygote as diploid stage also occurs. In some representatives (e.g. some<br />
Ulotrichales), flagellate reproductive cells are covered by a layer <strong>of</strong> small scales similar to those<br />
found in some prasinophytes (Sluiman 1989).<br />
Since the class lacks clear synapomorphies, the monophyly <strong>of</strong> the Ulvophyceae has been doubted<br />
since its establishment (O'Kelly <strong>and</strong> Floyd 1984b). Therefore, the Ulvophyceae are defined by a suite<br />
<strong>of</strong> characters such as a counter clockwise orientation <strong>of</strong> the basal bodies (Fig. 4), a persistent mitotic<br />
spindle (Fig. 5B) <strong>and</strong> cytokinesis mediated by centripetal furrowing <strong>of</strong> the plasma membrane, none <strong>of</strong><br />
which is exclusive for the Ulvophyceae (Mattox <strong>and</strong> Stewart 1984, O'Kelly <strong>and</strong> Floyd 1984a). The<br />
Trentepohliales for which <strong>molecular</strong> phylogenies revealed their relationship to ulvophycean<br />
seaweeds, have some enigmatic streptophyte-like characteristics such as an asymmetric flagellar<br />
root anchored in the cell with a multilayered structures <strong>and</strong> the formation <strong>of</strong> a phragmoplast during<br />
cytokinesis.<br />
Molecular phylogenies based on SSU nrDNA failed to provide solid support for the monophyly <strong>of</strong> the<br />
Ulvophyceae <strong>and</strong> revealed the presence <strong>of</strong> two distinct groups within the Ulvophyceae. One group is<br />
represented by the orders Ulvales <strong>and</strong> Ulotrichales <strong>and</strong> contains unicellular, filamentous <strong>and</strong> bladelike<br />
organisms. The other group is composed <strong>of</strong> the branched filamentous order Trentepohliales, the<br />
siphonocladous seaweed order Cladophorales (synonymous with Siphonocladales), <strong>and</strong> the<br />
siphonous seaweed orders Dasycladales <strong>and</strong> Bryopsidales (Zechman et al. 1990, Watanabe et al.<br />
2001, Lopez-Bautista <strong>and</strong> Chapman 2003, Watanabe <strong>and</strong> Nakayama 2007). In these trees, long<br />
<strong>evolution</strong>ary distances separate the <strong>green</strong> seaweed orders from the rest <strong>of</strong> the Ulvophyceae which<br />
consequently obscures the relationships among them. Based on these long branches <strong>and</strong> the<br />
apparent differences in thallus architecture, cellular organization, chloroplast morphology, cell wall<br />
composition, <strong>and</strong> life histories, some authors suggested to elevate the ulvophycean orders<br />
Cladophorales, Bryopsidales, Dasycladales <strong>and</strong> Trentepohliales to the class level (van den Hoek et al.<br />
1995). In addition to the uncertainty regarding the affinities between the main orders, the position <strong>of</strong><br />
some enigmatic Ulvophyceae such as Ignatius, Oltmannsiellopsis <strong>and</strong> Blastophysa is not well-known.
10 CHAPTER 1<br />
Green algal phylogenies<br />
The estimated divergence time between Streptophyta <strong>and</strong> Chlorophyta varies considerably among<br />
studies. The split between these lineages is generally situated in the Neoproterozoic to late<br />
Mesoproterozoic (Fig. 7) (between 1200 <strong>and</strong> 700 million years ago: Douzery et al. 2004, Hedges et al.<br />
2004, Yoon et al. 2004, Berney <strong>and</strong> Pawlowski 2006, Roger <strong>and</strong> Hug 2006, Zimmer et al. 2007, Herron<br />
et al. 2009). The ancient age in combination with the short time span over which the major lineages<br />
<strong>of</strong> <strong>green</strong> <strong>algae</strong> diverged likely caused the unstable relationships among these classes. Determining<br />
relationships among the different orders <strong>of</strong> the Ulvophyceae poses a similar problem. Up to now,<br />
<strong>green</strong> algal phylogenies using a broad taxon sampling were always based on SSU nrDNA (Zechman et<br />
al. 1990), while studies using whole plastid genome sequences contend with a small taxon sampling<br />
(Pombert et al. 2004, Pombert et al. 2005). It is well-known that phylogenetic information contained<br />
in a single gene is <strong>of</strong>ten insufficient to obtain firm statistical support for deep nodes (Philippe et al.<br />
2005). Hence, improved character sampling by the inclusion <strong>of</strong> a larger number genes <strong>of</strong>ten leads to<br />
more accurate estimates <strong>of</strong> phylogenetic relationships. Unfortunately there is a limited availability <strong>of</strong><br />
genomic data for <strong>green</strong> <strong>algae</strong>. Whole genome sequences were only available for the chlorophycean<br />
Chlamydomonas reinhardtii <strong>and</strong> the prasinophycean Ostreococcus tauri at the start <strong>of</strong> this project.<br />
Some other whole genome sequences have been recently released or are on the way for the<br />
chlorophyceae Volvox <strong>and</strong> the prasinophytes Micromonas <strong>and</strong> Bathycoccus. However, up till present<br />
no genome has been sequenced for a representative <strong>of</strong> the Ulvophyceae or Trebouxiophyceae. In<br />
addition to whole genome sequences, there are small to moderately sized EST libraries <strong>and</strong> complete<br />
organelle genomes available for some <strong>green</strong> <strong>algae</strong> (table 2). However, the ulvophycean seaweed<br />
orders remain underrepresented: no sequenced plastid genome <strong>and</strong> only 2 smaller EST libraries are<br />
available.<br />
This limited availability <strong>of</strong> genomic information for the Chlorophyta inevitably poses a restriction on<br />
taxon sampling. Most studies which have addressed deep relationships <strong>of</strong> Chlorophyta are seriously<br />
constrained in taxon sampling (e.g., Pombert et al. 2005, Rodriguez-Ezpeleta et al. 2007).<br />
Furthermore, sparse <strong>and</strong> uneven taxon sampling, with most species belonging to either the<br />
prasinophytes or Chlorophyceae, increases the risk <strong>of</strong> systematic error due to long branch attraction<br />
<strong>and</strong> other biases (Verbruggen <strong>and</strong> Theriot 2008).<br />
Resolving deep <strong>green</strong> algal relationships will inevitably request the combined analysis <strong>of</strong> many<br />
markers. Since genomic data are rare, it will be necessary to design primers for new markers. Lowcopy<br />
nuclear markers proved to be good c<strong>and</strong>idates due to a higher <strong>evolution</strong>ary rate than organellar<br />
genes, the potential to analyze multiple unlinked genes <strong>and</strong> the bi-parentally inheritance (Small et al.<br />
2004). However, the greater difficulty <strong>of</strong> isolating <strong>and</strong> characterizing low-copy nuclear markers in<br />
comparison with SSU nrDNA <strong>and</strong> chloroplast genes which can be amplified with universal primers<br />
<strong>and</strong> the difficulty <strong>of</strong> assessing orthology are the major challenge when using low-copy nuclear<br />
markers (Small et al. 2004).
INTRODUCTION 11<br />
Figure 7. The estimated divergence time between Streptophyta <strong>and</strong> Chlorophyta, which are based on<br />
<strong>molecular</strong> clock studies, vary considerably among studies. The split between these lineages is generally situated<br />
in the Neoproterozoic to late Mesoproterozoic (between 1200 <strong>and</strong> 700 million years ago). The best<br />
characterized Precambrian fossils which most likely are <strong>green</strong> <strong>algae</strong> are Proterocladus <strong>and</strong> Palaeastrum at<br />
Svanbergfjellet, Tasmanites <strong>and</strong> Pterospermella at Thule <strong>and</strong> Spiromorpha at Ruyang. The oldest reliable fossil<br />
<strong>green</strong> <strong>algae</strong> are 540 million years old (Dasycladales). Other fossil Ulvophyceae are found more recently.<br />
Evolution <strong>of</strong> nuclear markers<br />
One <strong>of</strong> the major challenges when using nuclear genes for phylogenetic purposes is to assess<br />
orthology. Gene duplications lead to the formation <strong>of</strong> gene families (e.g. actin gene family, <strong>and</strong><br />
GapA/B gene duplication in Streptophytes <strong>and</strong> the prasinophyte Ostreococcus), in which case<br />
extreme caution should be taken to ensure that the same orthologues gene is used in each species<br />
(An et al. 1999, Petersen et al. 2006, Robbens et al. 2007). Apart from difficulties in assessing<br />
orthology, there are indications <strong>of</strong> the occurrence <strong>of</strong> lateral gene transfer between eukayotes<br />
(Andersson 2005, Keeling <strong>and</strong> Palmer 2008). Two key genes <strong>of</strong> the translational apparatus,<br />
elongation factor-1 alpha (EF-1α) <strong>and</strong> elongation factor-like (EFL) have an almost mutually exclusive<br />
distribution in eukaryotes. In the <strong>green</strong> plant lineage, the Chlorophyta encode EFL except<br />
Acetabularia (Dasycladales, Ulvophyceae) where EF-1α is found, <strong>and</strong> the Streptophyta possess EF-1α<br />
except Mesostigma, which has EFL (Noble et al. 2007). The punctuated distribution <strong>of</strong> these two<br />
genes make it worth to further explore their distribution <strong>and</strong> <strong>evolution</strong>ary patterns <strong>of</strong> gain <strong>and</strong> loss<br />
within the <strong>green</strong> plant lineage. In this context it is interesting that Acetabularia not only has a<br />
different elongation factor gene compared to the rest <strong>of</strong> the Chlorophyta but also uses a different<br />
genetic code. In Acetabularia, <strong>and</strong> its close relative Batophora, stop codons TAG <strong>and</strong> TAA code for<br />
the amino acid glutamine (Schneider et al. 1989, Schneider <strong>and</strong> de Groot 1991). It is interesting to<br />
see if other <strong>green</strong> <strong>algae</strong>, especially close relatives <strong>of</strong> Acetabularia, also have the EF-1α gene or use<br />
the same alternative (non-canonical) code.
12 CHAPTER 1<br />
Designing primers for low-copy nuclear markers<br />
For phylogenetic analyses we will concentrate on the development <strong>of</strong> low-copy nuclear markers.<br />
There are several alternative approaches to isolate <strong>and</strong> characterize novel low-copy nuclear markers:<br />
1) the design <strong>of</strong> new primers from information in sequence databases (e.g., GenBank), 2) obtaining<br />
novel sequences via cDNA cloning 3) isolation <strong>of</strong> homologous DNA using a gene probe from another<br />
organism, <strong>and</strong> 4) characterization <strong>of</strong> sequence markers from DNA fingerprints (Schluter et al. 2005).<br />
In order to find suitable nuclear markers we first searched the literature for potentially useful lowcopy<br />
nuclear markers <strong>and</strong> then applied the first two approaches (Fig. 8). When designing new<br />
primers from information already available in GenBank, we used genomic sequences <strong>of</strong> two<br />
unicellular <strong>green</strong> <strong>algae</strong> (Chlamydomonas reinhartii <strong>and</strong> Ostreococcus tauri) <strong>and</strong> aligned them with<br />
Genbank sequences from l<strong>and</strong> plants <strong>and</strong> other <strong>green</strong> <strong>algae</strong> if available. For the second approach we<br />
made an EST library for the siphonocladous ulvophyte Cladophora coelothrix. All Cladophora<br />
coelothrix EST sequences were blasted against the GenBank protein database (blastx) for annotating<br />
the genes. Only genes with a certain annotation (hits to Swiss-Prot database) were retained <strong>and</strong><br />
aligned with GenBank sequences from other <strong>green</strong> <strong>algae</strong> <strong>and</strong> l<strong>and</strong> plant. If those genes were long<br />
enough <strong>and</strong> contained conserved regions, primers were designed <strong>and</strong> tested on a variety <strong>of</strong> <strong>green</strong><br />
<strong>algae</strong>.<br />
Figure 8. Flow chart showing three different methods to select suitable nuclear markers in <strong>green</strong> <strong>algae</strong> for<br />
which primers can be designed <strong>and</strong> tested on a wide range <strong>of</strong> <strong>green</strong> <strong>algae</strong>.
Tree building methods<br />
Maximum likelihood <strong>and</strong> Bayesian Inference<br />
INTRODUCTION 13<br />
Using the most accurate tree building methods <strong>and</strong> <strong>evolution</strong>ary models available is a basic necessity<br />
to obtain accurate phylogenies (Fig. 9) (Delsuc et al. 2005). Likelihood-based methods (maximum<br />
likelihood <strong>and</strong> Bayesian Inference) generally outperform methods based on distance or parsimony<br />
criteria because they allow the explicit incorporation <strong>of</strong> the processes <strong>of</strong> character <strong>evolution</strong> into<br />
probabilistic models to calculate the likelihood <strong>of</strong> the data given the model <strong>and</strong> tree. Maximum<br />
likelihood (ML) selects the tree that maximizes the probability <strong>of</strong> observing the data under a given<br />
model <strong>of</strong> sequence <strong>evolution</strong>. Bayesian methods derive the distribution <strong>of</strong> trees according to their<br />
posterior probability, using Bayes’ mathematical formula to combine the likelihood function<br />
(including tree <strong>and</strong> model parameters) with prior probabilities on trees. Since prior knowledge is<br />
mostly lacking or bias towards one or the other tree is not generally desirable, flat priors are usually<br />
chosen, i.e. giving the same prior probability to all trees. Consequently, posterior tree probabilities<br />
depend primarily on the tree likelihood. Unlike ML, which optimizes model parameters to find the<br />
highest peak in parameter space <strong>and</strong> where confidence is obtained by non-parametric bootstrapping,<br />
Bayesian approaches integrate the model parameters by measuring the volume under a posterior<br />
probability surface rather than finding its maximum height <strong>and</strong> simultaneously estimates trees <strong>and</strong><br />
measurements <strong>of</strong> uncertainty for every branch (Holder <strong>and</strong> Lewis 2003, Delsuc et al. 2005,<br />
Verbruggen <strong>and</strong> Theriot 2008). During Bayesian analysis, Markov chain Monte Carlo (MCMC)<br />
simulation is used to approximate the posterior probability distribution because the complexity <strong>of</strong><br />
the phylogenetic likelihood functions prevents its analytical calculation. During each generation, a<br />
parameter change is proposed (topology, branch lengths <strong>and</strong> model parameters) <strong>and</strong> accepted if it<br />
increases the posterior probability. If the posterior probability decreases, the parameter change is<br />
either accepted or rejected depending on the amount <strong>of</strong> change in posterior probability. Whereas<br />
small changes are <strong>of</strong>ten accepted, large decreases are usually rejected. Because parameters are<br />
usually not near their optimal values during initial generations these first generations, called burn-in,<br />
need to be removed before a consensus tree <strong>of</strong> all post-burn-in samples can be made. In order to<br />
search tree space even more thoroughly, Metropolis-coupled MCMC, in which several chains are run<br />
in parallel can be applied. Metropolis-coupled MCMC is implemented in the commonly used BI<br />
program MrBayes (Ronquist <strong>and</strong> Huelsenbeck 2003). The first chain is the called the cold chain <strong>and</strong><br />
only propose small parameter changes. The other chains are incrementally heated <strong>and</strong> propose<br />
larger parameter changes in order to find distant regions with high posterior probabilities. After each<br />
generation, chains can be swapped, i.e. a heated chain in a higher posterior probability region than<br />
the current cold chain can become the cold chain in order to find the local optimum. Only the output<br />
from the cold chain is used to summarize the posterior distribution <strong>and</strong>, due to chain swapping, this<br />
chain will contain a more complete image <strong>of</strong> the high posterior probability regions <strong>of</strong> tree space<br />
compared with a BI analysis based on a single MCMC chain. The downside <strong>of</strong> Metropolis-coupled<br />
MCMC is a considerably higher computational cost because several chains have to be run in parallel.
14 CHAPTER 1<br />
Missing data<br />
Deep phylogenies require the simultaneous analysis <strong>of</strong> many characters <strong>and</strong> many taxa (Delsuc et al.<br />
2005). Individual, orthologous genes can be combined into a supermatrix which inevitably involves a<br />
certain amount <strong>of</strong> missing data. Many studies have studied the effects <strong>of</strong> missing data on<br />
phylogenetic reconstruction. A simulation study suggests that the placement <strong>of</strong> individual taxa in a<br />
tree is robust to large amounts <strong>of</strong> missing data in the sequences <strong>of</strong> the taxa in question (up to 50%<br />
under the simulated conditions) <strong>and</strong> that model-based methods can deal with even greater amounts<br />
<strong>of</strong> missing data (Wiens 2005). Another simulations study demonstrates that Bayesian analyses are<br />
even more robust to missing data, i.e. the phylogenetic position <strong>of</strong> taxa with 95% <strong>of</strong> missing data in<br />
their sequence is still accurate, as long as the total number <strong>of</strong> characters in the dataset is large<br />
(Wiens <strong>and</strong> Moen 2008). Studies <strong>of</strong> empirical datasets have shown that datasets with up to 92% <strong>of</strong><br />
missing data are still able to provide insights into various parts <strong>of</strong> the tree <strong>of</strong> life (Driskell et al. 2004,<br />
Philippe et al. 2004, Delsuc et al. 2005).<br />
Models <strong>of</strong> sequence <strong>evolution</strong><br />
The General Time Reversible (GTR) model <strong>and</strong> its simpler variants include one or more parameters to<br />
describe the substitution rate between the different bases. The GTR model uses a set <strong>of</strong> parameters<br />
to describe the relative substitution rate between all combinations <strong>of</strong> bases (AC, AG, AT, CG, CT, <strong>and</strong><br />
GT). The simpler models only consider transitions versus transversions or attribute an equal<br />
substitution rate to all possible changes. A second important component <strong>of</strong> a model are the base<br />
frequencies. They can be calculated directly from the dataset (‘empirical’ base frequencies) or<br />
optimized along with the other parameters <strong>of</strong> the model. A third common element <strong>of</strong> the model<br />
allows for variations <strong>of</strong> <strong>evolution</strong>ary rate across site (e.g. different codon positions in protein coding<br />
genes, loops <strong>and</strong> stems in ribosomal DNA). Such among site rate variation is commonly accounted for<br />
by assuming that the site rates follow a gamma distribution <strong>and</strong>/or by incorporating a proportion <strong>of</strong><br />
invariable sites.<br />
Partitioning strategies<br />
A supermatrix, a dataset composed <strong>of</strong> different genes, <strong>of</strong>ten dem<strong>and</strong>s data partitioning to account<br />
for across site heterogeneity in <strong>evolution</strong>ary rate (Delsuc et al. 2005). Therefore, careful attention<br />
has to be paid to the selection <strong>of</strong> suitable partitioning strategies (Brown <strong>and</strong> Lemmon 2007, Li et al.<br />
2008, Verbruggen <strong>and</strong> Theriot 2008). Protein coding genes usually benefit from partitioning into<br />
codon position. Empirical studies showed that codon position models perform better than models<br />
which do not take codon position into account (Shapiro et al. 2006). In order to accommodate<br />
differences in <strong>evolution</strong>ary rate among partitions rate multipliers can be used.
INTRODUCTION 15<br />
Figure 9. Flow chart for accurate phylogenetic reconstruction. A. Phylogenetic reconstruction. B. Removal <strong>of</strong><br />
fast-evolving sites.<br />
Selection <strong>of</strong> the optimal partitioning strategy <strong>and</strong> model<br />
A great number <strong>of</strong> models <strong>of</strong> sequence <strong>evolution</strong> have been described, ranging from simple models<br />
to complex models incorporating a lot <strong>of</strong> parameters. To reconstruct an accurate phylogenetic tree it<br />
is important to select a model <strong>of</strong> sequence <strong>evolution</strong> that approximates the <strong>evolution</strong>ary history <strong>of</strong><br />
genes under study. A number <strong>of</strong> criteria have been developed to evaluate the fit <strong>of</strong> the different<br />
models to the data. The Akaike Information Criterion (AIC) <strong>and</strong> Bayesian Information Criterion (BIC)<br />
are two <strong>of</strong> these criteria that can be used for selection <strong>of</strong> the optimal partitioning strategy <strong>and</strong><br />
<strong>evolution</strong>ary model (Figure 9A). Whereas AIC only penalizes for the number <strong>of</strong> model parameters,<br />
BIC also incorporates alignment length <strong>and</strong> thus penalizes a situation in which many parameters have<br />
to be estimated from a small dataset. In other words for the same dataset, AIC will prefer a more<br />
complex model than BIC. Because Bayesian analysis appears to be more sensitive to model underspecifications<br />
than ML, some authors have suggested that AIC scores can be used to choose a<br />
complex model for Bayesian analysis <strong>and</strong> BIC to choose a less complex model for ML analysis<br />
(Verbruggen <strong>and</strong> Theriot 2008). AIC <strong>and</strong> BIC calculation starts from a guide tree which is inferred with<br />
a fast distance based method (e.g. NJ) or a fast ML search under a simple model (e.g. PhyML,
16 CHAPTER 1<br />
Treefinder). In the second step log likelihoods <strong>of</strong> the guide tree under different partitioning strategies<br />
<strong>and</strong> models are calculated. Subsequently, the corresponding AIC or BIC scores are calculated <strong>and</strong><br />
compared. The condition with the lowest AIC <strong>and</strong>/or BIC score is chosen for phylogenetic analysis.<br />
Alternatively, Bayes factors (Nyl<strong>and</strong>er et al. 2004) can be used to compare different partitioning<br />
strategies <strong>and</strong> models. For each tested condition a separate Bayesian analyses has to be run which<br />
implies high computational times. This makes it unrealistic to compare many partitioning strategies<br />
<strong>and</strong> models in a Bayesian framework.<br />
Complex models <strong>of</strong> sequence <strong>evolution</strong><br />
The secondary structure <strong>of</strong> ribosomal RNA consists <strong>of</strong> loops <strong>and</strong> stems. The nucleotides in the stem<br />
regions form base pairs <strong>and</strong> are interdependent because a change on one side <strong>of</strong> the stem has to be<br />
compensated in the other side <strong>of</strong> stem to avoid malfunction <strong>of</strong> the molecule. Since models <strong>of</strong><br />
sequence <strong>evolution</strong> have to approach real <strong>evolution</strong> as close by as possible, it is recommended to<br />
incorporate this site interdependence in the model. This can be done by partitioning the ribosomal<br />
RNA into loops <strong>and</strong> stems <strong>and</strong> using a doublet model for the stem regions (Schöniger <strong>and</strong> Von<br />
Haeseler 1994). However, the use <strong>of</strong> a doublet model is computational dem<strong>and</strong>ing.<br />
Instead <strong>of</strong> partitioning protein coding genes into codon positions, a codon substitution model can be<br />
applied. In this model, nucleotide triplets are considered as a single character <strong>and</strong> changes from one<br />
triplet to another one are considered taking into account that some changes are more likely than<br />
others (e.g. synonymous versus non-synonymous substitution). Although codon substitution models<br />
are a more realistic approximation <strong>of</strong> protein sequence <strong>evolution</strong> than codon position models, they<br />
come with a very high computational cost, hindering their use for large datasets (Shapiro et al. 2006).<br />
Mixture models<br />
Mixture models <strong>of</strong>fer an attractive alternative to data partitioning <strong>and</strong> applying different models to<br />
the partitions. Whereas a partitioned analysis assumes that all sites within a partition arose from a<br />
single <strong>evolution</strong>ary process, mixture models relax this assumption by not expecting any prior<br />
partitioning <strong>and</strong> applying a set <strong>of</strong> different models to each site in the alignment. The log likelihood <strong>of</strong><br />
each site is calculated as a weighted sum <strong>of</strong> the log likelihoods <strong>of</strong> each model for that site. The model<br />
weights correspond to the probability that the site has evolved under the model in question. Mixture<br />
models can thus apply different rate matrices to different parts <strong>of</strong> the dataset without explicitly<br />
partitioning it (Pagel <strong>and</strong> Meade 2004, Venditti et al. 2008). This is an elegant way to incorporate<br />
across site heterogeneity in the <strong>evolution</strong>ary process because it does not require prior knowledge<br />
about differences <strong>of</strong> <strong>evolution</strong>ary processes between different parts <strong>of</strong> the dataset <strong>and</strong> it avoids<br />
problems associated with differences <strong>of</strong> the <strong>evolution</strong>ary process within partitions that are defined a<br />
priori. Although analyses using mixture models outperform analyses based on partitioned datasets,<br />
they are restrictively time-consuming for large datasets.
Removal <strong>of</strong> fast-evolving sites<br />
INTRODUCTION 17<br />
It has been shown that even the most accurate phylogenetic method <strong>and</strong> <strong>evolution</strong>ary models are<br />
unable to account for differences in the <strong>evolution</strong>ary process between species causing the wellknown<br />
long-branch attraction artifact (Delsuc et al. 2005). Long-branch attraction artifacts can be<br />
reduced by improving taxon sampling <strong>and</strong> removing fast-evolving sites (Brinkmann et al. 2005, Delsuc<br />
et al. 2005). Fast-evolving sites are particularly challenging because they mask the true phylogenetic<br />
signal, resulting in loss <strong>of</strong> resolution <strong>and</strong> decrease <strong>of</strong> accuracy (Rodriguez-Ezpeleta et al. 2007). In<br />
chapter 2, we will illustrate that removal <strong>of</strong> fast-evolving sites (site stripping: Waddell et al. 1999)<br />
improves phylogenetic signal in the desired epoch (Fig. 9B).<br />
Aims <strong>and</strong> outline <strong>of</strong> this thesis<br />
First, we want to improve the phylogeny <strong>of</strong> the <strong>green</strong> lineage. To avoid biases caused by taxon or<br />
character sampling we examine deep relations <strong>of</strong> Chlorophyta by analyzing a combined dataset <strong>of</strong><br />
several single copy nuclear markers, together with SSU nrDNA <strong>and</strong> plastid rbcL <strong>and</strong> atpB genes,<br />
including taxa from all major <strong>green</strong> algal lineages. Broad taxon <strong>and</strong> character sampling in<br />
combination with careful selection <strong>of</strong> models <strong>of</strong> sequence <strong>evolution</strong> <strong>and</strong> partitioning strategies, <strong>and</strong><br />
thorough phylogenetic analyses, including methods to reduce data saturation will yield optimal<br />
resolution in the desired epoch (relation between UTC classes <strong>and</strong> relations within Ulvophyceae).<br />
Guided by this improved <strong>green</strong> algal phylogenetic tree, we address various topics relating to<br />
<strong>molecular</strong> <strong>evolution</strong> <strong>of</strong> the Chlorophyta. The patterns <strong>of</strong> gain <strong>and</strong> loss <strong>of</strong> EF-1α <strong>and</strong> EFL genes, key<br />
enzymes in the translational apparatus, are interpreted in this phylogenetic framework. In addition<br />
we will screen <strong>green</strong> algal nuclear genes for the presence <strong>of</strong> non-canonical genetic codes, with<br />
emphasis on the ulvophycean relatives <strong>of</strong> the Dasycladales, where a non-canonical code had been<br />
detected earlier. Their phylogenetic distribution pattern will be studied <strong>and</strong> we will look for biological<br />
factors influencing the origin <strong>of</strong> a non-canonical code.<br />
In Chapter 2 deep relations <strong>of</strong> Chlorophyta will be examined <strong>and</strong> interpreted with respect to<br />
<strong>evolution</strong> <strong>of</strong> multicellularity <strong>and</strong> multinucleate cells.<br />
In Chapter 3 a 74-taxon phylogeny <strong>of</strong> the <strong>green</strong> lineage based on SSU nrDNA <strong>and</strong> two plastid genes<br />
(rbcL <strong>and</strong> atpB) is inferred <strong>and</strong> used to study the distribution <strong>and</strong> gain-loss patterns <strong>of</strong> elongation<br />
factor genes in <strong>green</strong> <strong>algae</strong>.<br />
In Chapter 4 the presence <strong>of</strong> a non-canonical code in some <strong>green</strong> <strong>algae</strong> is evaluated <strong>and</strong> discussed.<br />
Codon usage <strong>of</strong> canonical <strong>and</strong> non-canonical glutamine codons are calculated <strong>and</strong> their <strong>evolution</strong> is<br />
reconstructed.<br />
Chapter 5 explores synonymous codon usage bias <strong>and</strong> GC content among the <strong>green</strong> plant lineage.<br />
Chapter 6 calibrates a multi-locus phylogeny <strong>of</strong> the siphonous <strong>green</strong> <strong>algae</strong> in a geological timeframe.
18 CHAPTER 1<br />
In Chapter 7 the phylogenetic positions <strong>of</strong> the enigmatic micr<strong>of</strong>ilamentous species Uronema<br />
curvatum <strong>and</strong> Urospora microscopica are assessed by <strong>molecular</strong> phylogenetic analysis <strong>of</strong> nuclearencoded<br />
small <strong>and</strong> large subunit rDNA sequences<br />
Finally, the main conclusions are summarized <strong>and</strong> discussed in Chapter 8 <strong>and</strong> perspectives for future<br />
research are provided.<br />
Authors’ contribution<br />
Chapter 2: Ellen Cocquyt <strong>and</strong> Olivier De Clerck designed the study. Ellen Cocquyt carried out lab<br />
work. Ellen Cocquyt <strong>and</strong> Frederik Leliaert maintained algal cultures <strong>and</strong> performed sequence<br />
alignment. Ellen Cocquyt <strong>and</strong> Heroen Verbruggen analyzed data. All authors wrote, revised <strong>and</strong><br />
approved the final manuscript.<br />
Chapter 3: Ellen Cocquyt, Olivier De Clerck, Heroen Verbruggen <strong>and</strong> Koen Sabbe designed the study.<br />
Ellen Cocquyt carried out lab work. Ellen Cocquyt <strong>and</strong> Frederik Leliaert maintained algal cultures <strong>and</strong><br />
performed sequence alignment. Ellen Cocquyt <strong>and</strong> Heroen Verbruggen analyzed data <strong>and</strong> wrote the<br />
manuscript. Fredirick W. Zechman provided atpB sequences. All authors revised <strong>and</strong> approved the<br />
final manuscript.<br />
Chapter 4: Ellen Cocquyt <strong>and</strong> Olivier De Clerck designed the study. Ellen Cocquyt <strong>and</strong> Gillian H. Gile<br />
carried out labwork. Ellen Cocquyt, Frederik Leliaert <strong>and</strong> Gillian H. Gile maintained algal cultures.<br />
Ellen Cocquyt <strong>and</strong> Heroen Verbruggen analyzed data. Ellen Cocquyt, Heroen Verbruggen <strong>and</strong> Olivier<br />
De Clerck wrote the manuscript. All authors revised <strong>and</strong> approved the final manuscript.<br />
Chapter 5: Ellen Cocquyt <strong>and</strong> Olivier De Clerck designed the study. Ellen Cocquyt carried out lab<br />
work. Ellen Cocquyt <strong>and</strong> Heroen Verbruggen analyzed data <strong>and</strong> wrote the manuscript. All authors<br />
revised <strong>and</strong> approved the final manuscript.<br />
Chapter 6: Heroen Verbruggen <strong>and</strong> Steven T. LoDuca designed <strong>and</strong> wrote the manuscript. Frederick<br />
W. Zechman, Diane S. Littler, Mark M. Littler, Frederik Leliaert, <strong>and</strong> Olivier De Clerck collected<br />
samples. Ellen Cocquyt, Matt Ashworth, Caroline Vlaeminck <strong>and</strong> Thomas Sauvage carried out lab<br />
work. Heroen Verbruggen analyzed data. All authors revised <strong>and</strong> approved the final manuscript.<br />
Chapter 7: Frederik Leliaert, Jan Rueness <strong>and</strong> Christine A. Maggs designed the study. Jan Rueness<br />
provided the culture strains <strong>of</strong> Uronema curvatum <strong>and</strong> Urospora microscopica. Christian Boedeker<br />
provided sequences <strong>of</strong> Chaetomorpha <strong>and</strong> Wittrockiella. Frederik Leliaert <strong>and</strong> Ellen Cocquyt carried<br />
out lab work <strong>and</strong> analyzed the data. All authors revised <strong>and</strong> approved the final manuscript.
2<br />
Ancient relationships among <strong>green</strong> <strong>algae</strong> inferred from nuclear <strong>and</strong><br />
chloroplast genes 1<br />
Ellen Cocquyt, Heroen Verbruggen, Frederik Leliaert <strong>and</strong> Olivier De Clerck<br />
<strong>Phycology</strong> Research Group <strong>and</strong> Center for Molecular Phylogenetics <strong>and</strong> Evolution, Ghent University,<br />
Krijgslaan 281 S8, 9000 Ghent, Belgium<br />
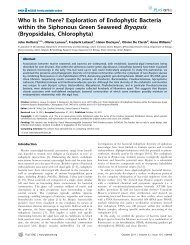
Abstract<br />
The Chlorophyta is one <strong>of</strong> the two divisions <strong>of</strong> <strong>green</strong> plants <strong>and</strong> harbors a wide range <strong>of</strong> <strong>green</strong> <strong>algae</strong>.<br />
The ancient relationships among three classes <strong>of</strong> this division, the Ulvophyceae, Trebouxiophyceae<br />
<strong>and</strong> Chlorophyceae (UTC) have been at the center <strong>of</strong> a long-st<strong>and</strong>ing debate. Our phylogenetic<br />
analyses (ML <strong>and</strong> BI) <strong>of</strong> seven nuclear genes, SSU nrDNA <strong>and</strong> two plastid markers with carefully<br />
chosen partitioning strategies <strong>and</strong> models <strong>of</strong> sequence <strong>evolution</strong> result in high support across the<br />
topology <strong>of</strong> the Chlorophyta, show the monophyly <strong>of</strong> the UTC classes <strong>and</strong> resolve the branching<br />
order among them. Even though topology tests (AU) do not exclude an alternative branching order <strong>of</strong><br />
UTC classes, we show that moderate removal <strong>of</strong> fast-evolving sites improves the phylogenetic signal<br />
in the desired epoch. We also infer the relationships among the orders <strong>of</strong> the Ulvophyceae, providing<br />
novel insights into the <strong>evolution</strong> <strong>of</strong> multicellularity <strong>and</strong> multinucleate cells in the <strong>green</strong> tree <strong>of</strong> life.<br />
Keywords<br />
single-copy nuclear genes, Chlorophyta, <strong>green</strong> <strong>algae</strong>, <strong>molecular</strong> phylogenetics, Ulvophyceae,<br />
Chlorophyceae, Trebouxiophyceae<br />
1 submitted article
20 CHAPTER 2<br />
Introduction<br />
The <strong>green</strong> plant lineage or Viridiplantae represents one <strong>of</strong> three groups <strong>of</strong> photosynthetic eukaryotes<br />
that diverged after enslavement <strong>of</strong> a cyanobacterium to make a primary chloroplast (Rodriguez-<br />
Ezpeleta et al. 2005). Ultrastructural <strong>and</strong> <strong>molecular</strong> studies have identified a major split within the<br />
Viridiplantae giving rise to two lineages, the Chlorophyta <strong>and</strong> the Streptophyta (Pickett-Heaps <strong>and</strong><br />
Marchant 1972, Lewis <strong>and</strong> McCourt 2004). The Streptophyta consists <strong>of</strong> several lineages <strong>of</strong><br />
freshwater <strong>green</strong> <strong>algae</strong> from which l<strong>and</strong> plants evolved approximately 470 million years ago 2 (Karol<br />
et al. 2001, McCourt et al. 2004, Hall <strong>and</strong> Delwiche 2007). Whereas considerable progress has been<br />
made during the past decade in clarifying the relationships among the streptophyte <strong>green</strong> <strong>algae</strong> <strong>and</strong><br />
l<strong>and</strong> plants (Parkinson et al. 1999, Turmel et al. 2003, Turmel et al. 2006, Lemieux et al. 2007, Moore<br />
et al. 2007, Rodriguez-Ezpeleta et al. 2007, Saarela et al. 2007), the phylogeny <strong>and</strong> <strong>evolution</strong>ary<br />
history <strong>of</strong> the Chlorophyta has been more difficult to elucidate.<br />
Members <strong>of</strong> the Chlorophyta are common inhabitants <strong>of</strong> aquatic environments <strong>and</strong> exhibit a<br />
remarkable morphological <strong>and</strong> cytological diversity ranging from the world’s smallest free-living<br />
eukaryote Ostreococcus, over multicellular filaments <strong>and</strong> foliose blades, to highly complex siphonous<br />
life forms. Four classes are recognized within the Chlorophyta: Prasinophyceae, Ulvophyceae,<br />
Trebouxiophyceae <strong>and</strong> Chlorophyceae. The predominantly marine planktonic Prasinophyceae form a<br />
paraphyletic assemblage <strong>of</strong> unicellular organisms from which the Ulvophyceae, Trebouxiophyceae<br />
<strong>and</strong> Chlorophyceae (UTC) are derived (Steinkötter et al. 1994, Fawley et al. 2000, Lopez-Bautista <strong>and</strong><br />
Chapman 2003, Guillou et al. 2004). The latter three classes form a monophyletic group termed UTC<br />
clade but the relationships among them form the basis <strong>of</strong> a longst<strong>and</strong>ing debate (Pröschold <strong>and</strong><br />
Leliaert 2007). All possible relationships between the UTC classes have been hypothesized over the<br />
years, depending on which ultrastructural characters were interpreted or which DNA locus or<br />
phylogenetic analysis method was used (Fig. 1). The unstable relationships exhibited among these<br />
three classes are likely due to a combination <strong>of</strong> their ancient age <strong>and</strong> the short time span over which<br />
they diverged from one another (O'Kelly 2007). The fossil record indicates the presence <strong>of</strong> the classes<br />
in the mid-Neoproterozoic (Butterfield et al. 1994) <strong>and</strong> <strong>molecular</strong> clock estimates situate the UTC<br />
divergence in the early Neoproterozoic (Douzery et al. 2004, Zimmer et al. 2007, Herron et al. 2009).<br />
The UTC lineages occupy distinct <strong>and</strong> widely divergent ecological niches. The Chlorophyceae <strong>and</strong><br />
Trebouxiophyceae are ubiquitous in freshwater <strong>and</strong> soil ecosystems. Furthermore, trebouxiophycean<br />
<strong>algae</strong> are the favored partner in symbiotic relationships with fungi to form lichens. Members <strong>of</strong> the<br />
Ulvophyceae, on the other h<strong>and</strong>, are best known as marine macro<strong>algae</strong> in coastal ecosystems, but<br />
some <strong>of</strong> them live in damp subaerial habitats such as humid soil, rocks, tree bark <strong>and</strong> leaves (Lopez-<br />
Bautista <strong>and</strong> Chapman 2003, Watanabe <strong>and</strong> Nakayama 2007). Having evolved from a marine<br />
prasinophyte ancestor, the UTC lineages have experienced one to several transitions to a freshwater<br />
2 This estimate is based on a plant phylogeny derived from 27 plastid protein-coding genes calibrated with<br />
plant fossils (S<strong>and</strong>erson et al. 2003). Estimates based on phylogenies <strong>of</strong> eukaryotes derived from 75 nuclear<br />
protein coding genes calibrated with vertebrate fossil suggest that vascular plant already diverged from mosses<br />
about 700 mya, which suggest that l<strong>and</strong> plants are at least 700 my old (Heckman et al. 2001; Hedges 2004). A<br />
possible explanations for this huge difference might be the use <strong>of</strong> other calibration points (i.e. plant versus<br />
vertebrate fossils).
PHYLOGENY OF GREEN ALGAE 21<br />
environment, which involves pr<strong>of</strong>ound physiological adaptation (Mann 1996, Becker <strong>and</strong> Marin<br />
2009). Furthermore, marine versus freshwater lifestyles coincide with differentiations in life-style:<br />
whereas the marine Ulvophyceae have a haplodiplontic life cycle with alternating generations <strong>of</strong><br />
free-living gametophyte <strong>and</strong> sporophyte phases <strong>and</strong> sporic meiosis, freshwater <strong>green</strong> <strong>algae</strong><br />
predominantly have a haploid vegetative phase <strong>and</strong> a single-celled, <strong>of</strong>ten dormant zygote as the<br />
diploid stage (haplontic life cycle with zygotic meiosis) (Lewis <strong>and</strong> McCourt 2004). Resolving the<br />
branching order among the three classes can help to underst<strong>and</strong> the diversification <strong>of</strong> ecological,<br />
physiological <strong>and</strong> life history features <strong>of</strong> the UTC clade.<br />
Whereas Prasinophyceae are unicellular marine plankton <strong>and</strong> Trebouxiophyceae <strong>and</strong> Chlorophyceae<br />
are unicells, colonies or in a few cases simple filaments, the predominantly marine class Ulvophyceae<br />
has evolved an unrivalled diversity <strong>of</strong> morphologies <strong>and</strong> cytological types. Morphologies in the class<br />
range from simple unicells to multicellular organisms <strong>of</strong> various levels <strong>of</strong> complexity (the <strong>green</strong><br />
seaweeds). Cytological diversity is equally diverse <strong>and</strong> ranges from uni- to multinucleate cells <strong>and</strong>, in<br />
the extreme, giant tubular cells with millions <strong>of</strong> nuclei. Five major groups are recognized in the<br />
Ulvophyceae. The first has fairly typical cells <strong>and</strong> ranges in morphology from unicells to multicellular<br />
filaments <strong>and</strong> sheets, the multicellular types being more derived (orders Oltmannsiellopsidales,<br />
Ulvales <strong>and</strong> Ulotrichales) (Cocquyt et al. 2009). The second group has similar cells in a filamentous<br />
organization (order Trentepohliales). In contrast to these two groups, the other groups possess<br />
multinucleate cells. Representatives <strong>of</strong> the third group (Cladophorales) are branched filamentous<br />
seaweeds consisting <strong>of</strong> multinucleate cells with a few to thous<strong>and</strong>s <strong>of</strong> nuclei arranged in non-motile<br />
cytoplasmic domains (siphonocladous organization). Members <strong>of</strong> the fourth group (Bryopsidales) are<br />
essentially unicellular: they consist <strong>of</strong> a single, giant tubular cell with thous<strong>and</strong>s to millions <strong>of</strong> nuclei<br />
<strong>and</strong> complex patterns <strong>of</strong> cytoplasmic flow (siphonous organization). This siphonous cell can branch<br />
<strong>and</strong> coalesce to form highly complex seaweeds that dominate the flora <strong>of</strong> tropical coastal ecosystems<br />
(Vroom <strong>and</strong> Smith 2003). The seaweeds belonging to the fifth group (order Dasycladales) also feature<br />
a siphonous organization. Acetabularia <strong>and</strong> Batophora (Dasycladales) form an exception, because<br />
they have a single, giant nucleus situated in the rhizoid with which the alga is attached to its rocky<br />
substrate. Before sexual reproduction, this nucleus divides meiotically followed by several mitotic<br />
divisions, leading to the formation <strong>of</strong> numerous nuclei that populate the gametes. In addition to<br />
these five major multicellular or multinucleate groups, the Ulvophyceae also include the genus<br />
Ignatius, a soil alga forming clusters <strong>of</strong> a few cells (Watanabe <strong>and</strong> Nakayama 2007), <strong>and</strong> Blastophysa,<br />
a microscopic endophytic <strong>green</strong> alga. Several problems surround the classification <strong>of</strong> the<br />
Ulvophyceae. First, the monophyly <strong>of</strong> the Ulvophyceae has been questioned since its establishment<br />
because it lacks unique ultrastructural synapomorphies (Mattox <strong>and</strong> Stewart 1984, O'Kelly <strong>and</strong> Floyd<br />
1984, Lewis <strong>and</strong> McCourt 2004). Second, <strong>molecular</strong> phylogenetic studies have not fully resolved the<br />
relationships among the orders. Most studies did reveal the presence <strong>of</strong> two major groups:<br />
Oltmannsiellopsidales–Ulvales–Ulotrichales, <strong>and</strong> a clade consisting <strong>of</strong> Trentepohliales <strong>and</strong> the<br />
siphonocladous <strong>and</strong> siphonous seaweed orders (Zechman et al. 1990, Watanabe et al. 2001, Lopez-<br />
Bautista <strong>and</strong> Chapman 2003, Watanabe <strong>and</strong> Nakayama 2007). However, the relationships within the<br />
latter clade, <strong>and</strong> the positions <strong>of</strong> the enigmatic genera Ignatius <strong>and</strong> Blastophysa have not been<br />
resolved satisfactorily.<br />
The Chlorophyta thus <strong>of</strong>fer a unique opportunity to study the proliferation <strong>of</strong> cytological types,<br />
morphological complexity, ecophysiological adaptations <strong>and</strong> life cycle <strong>evolution</strong>. A first step towards
22 CHAPTER 2<br />
underst<strong>and</strong>ing this diversification is to resolve the phylogenetic relationships among the UTC classes<br />
<strong>and</strong> the ulvophycean orders. The fact that previous <strong>molecular</strong> phylogenetic analyses have not yielded<br />
a satisfactory resolution <strong>of</strong> these taxa can be attributed at least in part to the difficulty in obtaining a<br />
good combination <strong>of</strong> taxon <strong>and</strong> gene sampling. Single-gene analyses with good taxon sampling have<br />
suffered from poor resolving power due to the low number <strong>of</strong> characters (Watanabe <strong>and</strong> Nakayama<br />
2007). Conversely, studies based on longer alignments from complete organelle genomes have<br />
suffered from sparse <strong>and</strong> uneven taxon sampling (Pombert et al. 2004, Pombert et al. 2005), which<br />
can lead to systematic error in phylogenetic analysis (Brinkmann et al. 2005, Philippe et al. 2005).<br />
Our goal in this study is to infer ancient relationships within the Chlorophyta, more specifically the<br />
divergence <strong>of</strong> UTC classes <strong>and</strong> ulvophycean orders. Our approach consists <strong>of</strong> phylogenetic analysis <strong>of</strong><br />
a dataset that <strong>of</strong>fers a good balance between taxon <strong>and</strong> gene sampling. Our alignment consists <strong>of</strong><br />
seven single-copy nuclear markers, SSU nrDNA <strong>and</strong> two plastid genes for 43 taxa representing the<br />
major lineages <strong>of</strong> the Viridiplantae. Phylogenetic analyses are carried out with model-based<br />
techniques, paying careful attention to the selection <strong>of</strong> suitable partitioning strategies <strong>and</strong> models <strong>of</strong><br />
sequence <strong>evolution</strong>. Noise-reduction techniques targeted at improving signal in the epoch <strong>of</strong> interest<br />
are applied.<br />
Figure 1. The three alternative topologies for Ulvophyceae, Trebouxiophyceae <strong>and</strong> Chlorophyceae (UTC) have<br />
been supported by ultrastructural characteristics, <strong>molecular</strong> phylogenies <strong>and</strong>/or genomic structural features.<br />
Topology hypothesis testing using an AU tests based on our dataset containing seven nuclear genes, SSU<br />
nrDNA <strong>and</strong> two plastid genes suggested that an alternative branching order for the UTC classses (second<br />
column) was not significantly worse than the ML solution (first column), which supports a sister relationship<br />
between the Ulvophyceae <strong>and</strong> Chlorophyceae. Topology hypothesis testing using Bayesian factors provided<br />
very strong support in favor <strong>of</strong> the T(UC) topology.<br />
Results<br />
We generated EST data from a siphonocladous ulvophyte, Cladophora coelothrix, to facilitate the<br />
development <strong>of</strong> PCR primers for single-copy nuclear genes across the <strong>green</strong> <strong>algae</strong>. We selected 43<br />
taxa representing all major lineages <strong>of</strong> the <strong>green</strong> <strong>algae</strong> <strong>and</strong> obtained DNA sequences for seven<br />
nuclear genes, the nuclear SSU rDNA <strong>and</strong> two plastid genes (Fig. S1, Table S1). The concatenated<br />
matrix is 10209 bp long <strong>and</strong> is 63% filled at the gene level <strong>and</strong> 61% at the nucleotide level (Fig. S1).
PHYLOGENY OF GREEN ALGAE 23<br />
Our phylogenetic tree shows high resolution <strong>of</strong> the backbone <strong>of</strong> the <strong>green</strong> algal tree <strong>of</strong> life, including<br />
the branching order among the UTC classes <strong>and</strong> most ulvophycean orders (Figs. 2, S2 <strong>and</strong> S3). It<br />
reveals a sister relationship between the Ulvophyceae <strong>and</strong> Chlorophyceae, with the branch joining<br />
these two classes being very short, indicative <strong>of</strong> a rapid diversification. Although Bayes factors<br />
strongly favor the T(UC) configuration over the C(UT) <strong>and</strong> U(TC) topologies, AU tests suggested that<br />
an alternative branching order for the UTC classes was not significantly worse than the ML solution<br />
(Fig. 1).<br />
Because the former result may in part be due to the application <strong>of</strong> tests that rely on character<br />
resampling to a dataset with a suboptimal signal to noise ratio, we used a site removal approach to<br />
counteract the erosion <strong>of</strong> ancient phylogenetic signal caused by fast-evolving sites. Our approach<br />
consisted <strong>of</strong> maximizing the phylogenetic signal in the epoch corresponding to the radiation <strong>of</strong> UTC<br />
classes <strong>and</strong> ulvophycean orders (Fig. 3). Incremental removal <strong>of</strong> fast-evolving sites did not change the<br />
topology but yielded a positive trend in phylogenetic signal in the relevant epoch (Fig. 3D, GE = gain in<br />
relevant epoch), with an optimum at moderate amounts <strong>of</strong> site removal (25%). Fig. 3C clearly<br />
illustrates that statistical support for phylogenetic relationships within the relevant epoch is<br />
substantially improved by removing the 25% fastest sites, at the expense <strong>of</strong> signal in more recent<br />
epochs that are outside the scope <strong>of</strong> our study. The tree in Fig. 2 was inferred from the dataset with<br />
optimal signal in the relevant epoch (25% sites removed); the result <strong>of</strong> the phylogenetic analysis on<br />
the full data matrix is given in Fig. S2.<br />
Discussion<br />
Ancient, rapid radiations are difficult to resolve even with large datasets because there has been<br />
little time for the accumulation <strong>of</strong> substitutions, the underlying genes may have discordant<br />
phylogenetic histories, <strong>and</strong> inference methods can suffer from systematic error in some<br />
circumstances, e.g. the long branch attraction artifact (Delsuc et al. 2005, Wiens et al. 2008). We<br />
have taken some precautions to avoid systematic error: the use <strong>of</strong> multiple genes, broad taxon<br />
sampling, <strong>and</strong> the incremental removal <strong>of</strong> fast-evolving sites. The use <strong>of</strong> broad taxon sampling has<br />
been proven to be one <strong>of</strong> the most important design criteria leading to improved accuracy in<br />
phylogenetic studies (Zwickl <strong>and</strong> Hillis 2002, Geuten et al. 2007). Additionally, because fast-evolving<br />
sites can erode the overall phylogenetic signal <strong>of</strong> a dataset by masking the more reliable signal <strong>of</strong><br />
slow sites, removing them can reveal a more accurate signal (Delsuc et al. 2005).<br />
Radiation <strong>of</strong> the UTC classes<br />
Our phylogenetic tree indicates an early divergence <strong>of</strong> the freshwater-terrestrial clades<br />
Trebouxiophyceae <strong>and</strong> Chlorophyceae from marine prasinophycean progenitors, closely followed by<br />
the diversification <strong>of</strong> the marine Ulvophyceae. A consistent timeframe <strong>of</strong> chlorophytan <strong>evolution</strong> is<br />
still lacking, mainly due to ambiguities in the interpretation <strong>of</strong> the scarce fossils, the estimated age <strong>of</strong><br />
the clade being highly dependent on the taxonomic assignment <strong>of</strong> key fossils like Proterocladus <strong>and</strong><br />
Palaeastrum (Butterfield et al. 1994, O'Kelly 2007). Yet, our data clearly shows that the radiation <strong>of</strong>
24 CHAPTER 2<br />
the UTC clades <strong>and</strong> the coinciding ecological diversification was rapid. Even with a liberal estimate <strong>of</strong><br />
the Streptophyta-Chlorophyta split set at 1200 My (Herron et al. 2009), the UTC radiation would have<br />
occurred in ca. 20 to 30 million years (unpublished results), complicating interpretation <strong>of</strong> the<br />
ecological diversification.<br />
The relationships between the Ulvophyceae, Trebouxiophyceae <strong>and</strong> Chlorophyceae have not been<br />
unambiguously resolved up until now. Phylogenies based on SSU nrDNA sequences have been<br />
inconclusive, with the branching order <strong>of</strong> the UTC classes depending on taxon sampling, alignment<br />
methods <strong>and</strong> phylogenetic techniques (Fig. 1). Some early SSU phylogenies showed a sister<br />
relationship between Chlorophyceae <strong>and</strong> Trebouxiophyceae (Friedl 1995, Bhattacharya et al. 1996,<br />
Krienitz et al. 2001, Lopez-Bautista <strong>and</strong> Chapman 2003) while others revealed a sister relation<br />
between the Chlorophyceae <strong>and</strong> Ulvophyceae (Friedl <strong>and</strong> O'Kelly 2002, Lewis <strong>and</strong> Lewis 2005,<br />
Watanabe <strong>and</strong> Nakayama 2007). Although chloroplast phylogenomics has been valuable to resolve<br />
problematic relationships among <strong>green</strong> <strong>algae</strong> (Qiu et al. 2006, Jansen et al. 2007, Lemieux et al. 2007,<br />
Turmel et al. 2008, Turmel et al. 2009), it has not been able to resolve the branching order <strong>of</strong> the UTC<br />
classes conclusively. Whereas phylogenetic analysis <strong>of</strong> 58 concatenated chloroplast genes supported<br />
a sister relation between Ulvophyceae <strong>and</strong> Trebouxiophyceae, chloroplast gene order data <strong>and</strong><br />
genome structure (gene losses <strong>and</strong> rearrangements within conserved gene clusters), as well as a<br />
phylogenetic analysis <strong>of</strong> seven mitochondrial genes supported a sister relationship between<br />
Ulvophyceae <strong>and</strong> Chlorophyceae (Pombert et al. 2004, Pombert et al. 2005).<br />
Ultrastructural evidence has been interpreted as either providing support for a sister relation<br />
between Chlorophyceae <strong>and</strong> Trebouxiophyceae (Mattox <strong>and</strong> Stewart 1984) or between<br />
Trebouxiophyceae <strong>and</strong> Ulvophyceae (Sluiman 1989) based on the shared presence <strong>of</strong> a phycoplast<br />
<strong>and</strong> a non-persistent mitotic spindle in the first case <strong>and</strong> a counterclockwise orientation <strong>of</strong> the<br />
flagellar basal bodies in the second case (Fig 1). Our phylogeny suggests an alternative branching<br />
order that necessitates reinterpretation <strong>of</strong> the <strong>evolution</strong> <strong>of</strong> ultrastructural features. It now appears<br />
more likely that the ancestor <strong>of</strong> the UTC clade had a phycoplast <strong>and</strong> a non-persistent mitotic spindle,<br />
<strong>and</strong> that both characters have been lost in the Ulvophyceae. The ancestral status <strong>of</strong> a phycoplast <strong>and</strong><br />
a non-persistent mitotic spindle is congruent with the presence <strong>of</strong> these features in the<br />
Chlorodendrales (e.g. Tetraselmis), the closest prasinophyte relatives <strong>of</strong> the UTC clade (Mattox <strong>and</strong><br />
Stewart 1984). Likewise the ancestor <strong>of</strong> the UTC clade probably had a counterclockwise orientation<br />
<strong>of</strong> the flagellar basal bodies, evolving to a direct opposite or clockwise orientation in the<br />
Chlorophyceae. Again this interpretation is congruent with the presence <strong>of</strong> a counterclockwise basal<br />
body orientation in Tetraselmis. The modern UTC clade appeared after that a new mode <strong>of</strong> cell<br />
division, which is mediated by a phycoplast <strong>and</strong> enables complex multicellular growth, was<br />
introduced in the marine ancestor <strong>of</strong> the UTC clade. The following ecophysiological adaptations lead<br />
to the success <strong>of</strong> the Chlorophyceae <strong>and</strong> Trebouxiophyceae in freshwater habitats (Becker <strong>and</strong> Marin<br />
2009).
PHYLOGENY OF GREEN ALGAE 25<br />
Figure 2. <strong>Phylogeny</strong> <strong>of</strong> the <strong>green</strong> plant lineage obtained by maximum likelihood inference <strong>of</strong> the 25% site<br />
stripped dataset containing 7 nuclear genes, nuclear SSU nrDNA <strong>and</strong> plastid genes rbcL <strong>and</strong> atpB. Numbers at<br />
nodes indicate ML bootstrap values (top) <strong>and</strong> posterior probabilities (bottom); values below respectively 50<br />
<strong>and</strong> 0.9 are not shown. BCD clade st<strong>and</strong>s for the orders Bryopsidales, Cladophorales <strong>and</strong> Dasycladales.<br />
Diversification <strong>and</strong> specialization <strong>of</strong> the Ulvophyceae<br />
For the first time, the monophyly <strong>of</strong> the Ulvophyceae is inferred with high statistical support (BV =<br />
98; PP = 1.00). In addition, our phylogeny provides a solid hypothesis to explain the cytological <strong>and</strong><br />
ecophysiological differentiation <strong>of</strong> this predominantly marine class <strong>of</strong> <strong>green</strong> <strong>algae</strong>, by resolving the
26 CHAPTER 2<br />
relationships among the major clades. Our phylogeny reveals several ancient lineages which diverged<br />
early in the <strong>evolution</strong> <strong>of</strong> the Ulvophyceae. In contrast to previous studies, the basal divergences in<br />
the present tree are well-supported. Congruent with earlier studies, the clade comprising Ulvales <strong>and</strong><br />
Ulotrichales branches first. Ignatius <strong>and</strong> Trentepohliales, two relatively inconspicuous <strong>and</strong> somewhat<br />
neglected taxa both confined to subaerial habitats, form separate, ancient lineages. They are<br />
associated with the clade consisting <strong>of</strong> Bryopsidales, Cladophorales <strong>and</strong> Dasycladales (BCD clade) (BV<br />
84; PP 0.96). Contrary to expectations based on ultrastructure (O'Kelly <strong>and</strong> Floyd 1984), the<br />
Dasycladales group with the Bryopsidales instead <strong>of</strong> the Cladophorales 3 .<br />
The position <strong>of</strong> Ignatius has never been fully resolved, being either embedded in the Ulvales—<br />
Ulotrichales clade or clustering with the Trentepohliales <strong>and</strong> the BCD clade (Watanabe <strong>and</strong><br />
Nakayama 2007). The relationship <strong>of</strong> Ignatius with the Trentepohliales <strong>and</strong> the BCD clade revealed in<br />
this study is corroborated by features <strong>of</strong> the flagellar apparatus (Watanabe <strong>and</strong> Nakayama 2007) <strong>and</strong><br />
the shared presence <strong>of</strong> the elongation factor-1 alpha gene instead <strong>of</strong> the elongation factor-like gene<br />
used in all earlier diverging chlorophytan lineages (Cocquyt et al. 2009). The enigmatic, endophytic<br />
<strong>green</strong> alga Blastophysa, which has <strong>of</strong>ten been allied with the Bryopsidales (Burrows 1991, Brodie et<br />
al. 2007, Kraft 2007), is here revealed to be sister to the Cladophorales (BV 91 <strong>and</strong> PP 1.00). This<br />
relationship is supported by morphological, ultrastructural, cytological, <strong>and</strong> biochemical features 4<br />
(O'Kelly <strong>and</strong> Floyd 1984, Chappell et al. 1991).<br />
The observed branching pattern yields insight in the morphological <strong>and</strong> cytological diversification <strong>of</strong><br />
the Ulvophyceae. Multicellularity evolved independently in the Ulvales—Ulotrichales <strong>and</strong> the<br />
Trentepohliales + BCD clade. After multinucleate cells evolved in a common ancestor <strong>of</strong> the BCD<br />
clade, the siphonous thallus structure evolved from a multicellular state in the Bryopsidales <strong>and</strong><br />
Dasycladales. This interpretation is further supported by the occurrence <strong>of</strong> cross walls at the base <strong>of</strong><br />
reproductive structures in one <strong>of</strong> the two major bryopsidalean lineages (Bryopsidineae). The<br />
<strong>evolution</strong> <strong>of</strong> siphonocladalean <strong>and</strong> siphonous architectures coincides with several cytological <strong>and</strong><br />
cytoskeletal specializations. These giant-celled <strong>green</strong> <strong>algae</strong> have evolved a unique mechanism <strong>of</strong><br />
wounding response, in which injured cells contract their protoplasm into numerous spheres that<br />
regenerate into new cells <strong>and</strong> thalli (O'Neil <strong>and</strong> La Claire 1984, Menzel 1988, Kim et al. 2001). This<br />
mechanism has also given rise to segregative cell division, a specialized type <strong>of</strong> cell division found in<br />
some Cladophorales (Leliaert et al. 2007). Unlike the Cladophorales, the siphonous seaweeds<br />
Bryopsidales <strong>and</strong> Dasycladales are characterized by vigorous cytoplasmic streaming in which<br />
organelles are transported in a thin parietal layer <strong>of</strong> cytoplasm. This cytoplasmic transport has been<br />
shown to have certain selective advantages, such as transport <strong>of</strong> nutrients from the rhizoidal holdfast<br />
3 Common features <strong>of</strong> the Dasycladales <strong>and</strong> Cladophorales relate to certain aspects <strong>of</strong> the flagellar apparatus:<br />
its flattened aspect, structure <strong>of</strong> the striated distal fibers <strong>and</strong> absence <strong>of</strong> terminal caps. Based on these<br />
observations O’Kelly <strong>and</strong> Floyd O'Kelly C. J. <strong>and</strong> G. L. Floyd. 1984. Correlations among patterns <strong>of</strong> sporangial<br />
structure <strong>and</strong> development, life histories, <strong>and</strong> ultrastructural features in the Ulvophyceae. Pp. 121-156 in D.<br />
Irvine, <strong>and</strong> D. John, eds. Systematics <strong>of</strong> the <strong>green</strong> <strong>algae</strong>. The Systematics Association Special Volume 27,<br />
Academic Press, London <strong>and</strong> Orl<strong>and</strong>o. suggested a closer relationship between Dasycladales <strong>and</strong> Cladophorales<br />
than to any other group within the Ulvophyceae.<br />
4 See Chapter 8 for a more detailed discussion
PHYLOGENY OF GREEN ALGAE 27<br />
to the upright photosynthetic thallus parts (Littler et al. 1988, Chisholm et al. 1996), or chloroplast<br />
migration for optimal photosynthesis (Drew <strong>and</strong> Abel 1992). Despite the fact that siphonous thalli are<br />
essentially composed <strong>of</strong> a single giant cell, many bryopsidalean <strong>and</strong> dasycladalean representatives<br />
form large, differentiated thalli with a complex organization <strong>of</strong> interwoven siphons (Verbruggen et al.<br />
2009).<br />
The Ulvophyceae are an essentially marine clade, but a few representatives have adapted to<br />
freshwater environments (a number <strong>of</strong> Ulvales, Ulotrichales <strong>and</strong> Cladophorales) <strong>and</strong> subaerial<br />
habitats (Ignatius, Trentepohliales <strong>and</strong> two Cladophorales species). Our phylogeny thus implies that<br />
the transition to freshwater <strong>and</strong> terrestrial habitats must not only have occurred in the<br />
Chlorophyceae <strong>and</strong> Trebouxiophyceae (Becker <strong>and</strong> Marin 2009), but also several times<br />
independently within the Ulvophyceae.<br />
Figure 3. Illustration <strong>of</strong> the site stripping approach.<br />
(A) Based on a rate-smoothed tree, the epoch in which the relationships <strong>of</strong> interest are situated is selected<br />
(gray b<strong>and</strong> across figure).<br />
(B) The strength <strong>of</strong> the phylogenetic signal in the data (measured as average bootstrap values [BV] in a sliding<br />
window across the tree) is plotted for an analysis from which the 25% fastest-evolving characters had<br />
been stripped <strong>and</strong> compared to the condition without site stripping.<br />
(C) The gain in bootstrap values, calculated as the BV <strong>of</strong> site stripped condition minus the BV <strong>of</strong> the condition<br />
without site stripping is plotted. This graph shows net gain in older epochs <strong>and</strong> net loss in younger epochs.<br />
In this example, there is net gain in the epoch <strong>of</strong> interest (dark gray).<br />
(D) The gain in the epoch <strong>of</strong> interest is calculated for all site stripping conditions. This table shows that<br />
moderate site stripping yields optimal phylogenetic signal in the relevant epoch.
28 CHAPTER 2<br />
Progress <strong>and</strong> perspectives<br />
The slow progress in <strong>green</strong> algal phylogenetics can in part be attributed to the limited availability <strong>of</strong><br />
genomic data <strong>and</strong> the difficulties in consistently amplifying single-copy nuclear markers over the<br />
entire spectrum <strong>of</strong> a group <strong>of</strong> organisms that dates back well into the Proterozoic. Our results<br />
indicate that advanced phylogenetic analyses <strong>of</strong> multiple markers from different genomic<br />
compartments show great promise in resolving ancient divergences within the <strong>green</strong> <strong>algae</strong>. The<br />
present phylogeny has provided us with a framework to advance our underst<strong>and</strong>ing <strong>of</strong> the nature <strong>of</strong><br />
the morphological, cytological <strong>and</strong> ecological diversification <strong>of</strong> the Chlorophyta. Additional insight<br />
would be gained from a dated phylogeny, which would allow an assessment <strong>of</strong> the timing <strong>of</strong> these<br />
<strong>evolution</strong>ary events <strong>and</strong>, by consequence, the global ecological circumstances under which this<br />
radiation took place.<br />
Material <strong>and</strong> methods<br />
Algal strains<br />
Algal strain information is provided in Table S2. Cultures were grown under cool white fluorescent<br />
lights at 18°C, with a 12/12h light/dark cycle. Dasycladales, Cladophorales <strong>and</strong> Derbesia were grown<br />
at 23°C. Bold's basal medium <strong>and</strong> f/2 medium was used for freshwater <strong>and</strong> marine species,<br />
respectively (Andersen 2005).<br />
RNA isolation<br />
Total RNA was extracted with a RNeasy Plant Mini Kit (Qiagen) or a NucleoSpin® RNA Plant kit<br />
(Machery-Nagel) according to the manufacturer’s instructions, including a DNAse step to eliminate<br />
genomic DNA contamination. RNA quality was checked on a 1% agarose gel <strong>and</strong> with<br />
spectrophotometric analysis (Sambrook et al. 1989).<br />
cDNA library construction <strong>and</strong> primer design<br />
A st<strong>and</strong>ard cDNA library was constructed from 30 µg <strong>of</strong> total RNA <strong>of</strong> Cladophora coelothrix by VERTIS<br />
Biotechnologie AG (Germany) <strong>and</strong> screened for nuclear genes potentially useful for <strong>green</strong> algal<br />
phylogeny. After the cDNA library had been plated, 200 clones were r<strong>and</strong>omly picked <strong>and</strong> sequenced<br />
with M13 reverse primer (Table S3). Clones with a positive blastx hit to the Swiss-Prot database were<br />
also sequenced with the M13 forward primer (Table S3).<br />
For each recovered gene, an alignment including GenBank sequences from other <strong>green</strong> plants was<br />
made. Primers were designed for sufficiently long genes that contained conserved regions <strong>and</strong> tested<br />
on a variety <strong>of</strong> <strong>green</strong> <strong>algae</strong>, leading to successful amplification <strong>of</strong> 4 nuclear genes across a wide range<br />
<strong>of</strong> <strong>green</strong> <strong>algae</strong>: 40S ribosomal protein S9, 60S ribosomal proteins L3 <strong>and</strong> L17 <strong>and</strong> oxygen-evolving<br />
enhancer protein (OEE1). Actin <strong>and</strong> some glyceraldehyde-3-phosphate dehydrogenase (GapA)
PHYLOGENY OF GREEN ALGAE 29<br />
primers were found in literature (Table S3). Glucose-6-phosphate isomerase (GPI) <strong>and</strong> other GapA<br />
primers were based upon aligned GenBank sequences from <strong>green</strong> <strong>algae</strong> (e.g., available genome<br />
sequences <strong>of</strong> Ostreococcus <strong>and</strong> Chlamydomonas) <strong>and</strong> l<strong>and</strong> plants (Table S3). Primers <strong>of</strong> rbcL<br />
(Hanyuda et al. 2000), atpB (Wolf 1997, Karol et al. 2001) <strong>and</strong> SSU nrDNA (Zechman et al. 1990, Lewis<br />
<strong>and</strong> Lewis 2005) were taken from the literature.<br />
Reverse Transcriptase <strong>and</strong> Polymerase Chain Reaction<br />
For amplification <strong>of</strong> the nuclear genes, cDNA was constructed from total RNA with the Omniscript RT<br />
kit (Qiagen) according to the manufacturer’s instructions. The reaction was incubated for several<br />
hours at 37°C. PCR amplification was performed with the following reaction mixture: 1 µl <strong>of</strong> cDNA,<br />
2.5 µl <strong>of</strong> 10x Buffer (Qiagen), 0.5 µl dNTP’s (10 mM), 0.5 µl MgCl (25 mM, Qiagen), 0.5 µl <strong>of</strong> each<br />
primer (10 µM), 0.25 µl BSA (10 µg/µl), 18.125 µl sterilized MilliQ water <strong>and</strong> 0.125 µl Taq polymerase<br />
(5 U/µl, Qiagen). The amplification pr<strong>of</strong>ile consisted <strong>of</strong> an initial denaturation <strong>of</strong> 2 min at 94 °C,<br />
followed by 35 cycles <strong>of</strong> 30 s at 94 °C, 30 s at 50°C or 55 °C <strong>and</strong> 45 s at 72 °C <strong>and</strong> a final extension <strong>of</strong><br />
10 min at 72 °C. Products <strong>of</strong> expected size (Table S4) were either sequenced directly or cloned first.<br />
Cloning <strong>and</strong> sequencing<br />
PCR products were first sequenced with the forward primer with an Applied Biosystems 3130xl.<br />
Sequences were blasted against the GenBank protein database (blastx) to check for potential<br />
bacterial contaminants. Sequences without ambiguous base calls yielding a significant hit for<br />
Viridiplantae were further sequenced with the reverse primer. When ambiguous base calls were<br />
present in sequences, samples were cloned if the rough sequence gave a significant blastx hit for<br />
Viridiplantae. Cloning was performed with the pGEM®-T Vector System (Promega) according to the<br />
manufacturer’s instructions. After ligation, transformation <strong>and</strong> incubation, the white colonies were<br />
transferred to 15 µl distilled water, boiled for 10 minutes to lyse cells <strong>and</strong> centrifuged to pellet cells<br />
walls <strong>and</strong> harvest the DNA in the liquid phase. Three to five clones were PCR amplified <strong>and</strong><br />
sequenced with the vector specific primers T7 <strong>and</strong> SP6 following the protocol described above.<br />
Alignment<br />
Sequence reads were assembled with AutoAssembler 1.4.0 (ABI Prism, Perkin Elmer). Additional<br />
sequences were retrieved from GenBank <strong>and</strong> aligned with our own sequences (Table S1). Nuclear<br />
<strong>and</strong> plastid genes were aligned by eye, taking their corresponding amino acids into account. SSU<br />
nrDNA sequences were aligned based on their RNA secondary structure (Cocquyt et al. 2009). The<br />
ten loci were concatenated, yielding an alignment <strong>of</strong> 10209 bases.
30 CHAPTER 2<br />
Model selection procedure<br />
A suitable partitioning strategy <strong>and</strong> suitable models <strong>of</strong> sequence <strong>evolution</strong> were selected with a<br />
three-step procedure based on the Bayesian Information Criterion (BIC). The guide tree used during<br />
the entire procedure was obtained by ML analysis <strong>of</strong> the unpartitioned concatenated alignment with<br />
PhyML, using a JC+ 8 model (Guindon <strong>and</strong> Gascuel 2003). All subsequent likelihood optimizations<br />
<strong>and</strong> BIC calculations were carried out with Treefinder (Jobb et al. 2004). The first step consisted <strong>of</strong><br />
optimizing the likelihood for eight potential partitioning strategies, assuming a HKY+ 8 model for<br />
each partition. The three partitioning strategies with the best fit to the data (lowest BIC scores) were<br />
retained for further evaluation. The second step involved model selection for individual partitions.<br />
The likelihood <strong>of</strong> each partition present in the three retained partitioning strategies was optimized<br />
for three variants <strong>of</strong> the general time reversible model (F81, HKY <strong>and</strong> GTR), with <strong>and</strong> without among-<br />
site rate heterogeneity (+ 8). Because not all genes were sampled for all taxa, the guide tree was<br />
pruned to the taxa present in the partition in question before each optimization. The partitionspecific<br />
models obtaining the lowest BIC score were passed on to the third step, which consisted <strong>of</strong> a<br />
re-evaluation <strong>of</strong> the three partitioning strategies retained from the first step using the models<br />
selected for these partitions in the second step. The partitioning strategy plus model combination<br />
that received the lowest BIC score in the third step was used in the phylogenetic analyses. The model<br />
selection procedure proposed 8 partitions: SSU nrDNA was partitioned into loops <strong>and</strong> stems (2<br />
partitions), nuclear <strong>and</strong> plastid genes were partitioned according to codon position (2 3 partitions).<br />
GTR+ 8 was the optimal model for all partitions.<br />
Phylogenetic analysis<br />
Maximum likelihood analysis was performed with TreeFinder, which allows likelihood searches under<br />
partitioned models (Jobb et al. 2004). Due to the relatively low tree space coverage in TreeFinder<br />
compared to other ML programs, an analysis pipeline was created to increase tree space coverage by<br />
running analyses from many starting trees. A first set <strong>of</strong> starting trees was created by r<strong>and</strong>omly<br />
modifying the PhyML guide tree by 100 <strong>and</strong> 200 nearest neighbor interchange (NNI) steps (50<br />
replicates each). ML searches were run from these 100 starting trees <strong>and</strong> the three trees yielding the<br />
highest likelihood were used as the starting point for another set <strong>of</strong> NNI modifications <strong>of</strong> 20 <strong>and</strong> 50<br />
steps (50 replicates each). A second set <strong>of</strong> ML searches was run from each <strong>of</strong> the resulting 300<br />
starting trees. The tree with the highest likelihood resulting from this set <strong>of</strong> analyses was retained as<br />
the global ML solution. The bootstrap resampling method was used to assess statistical support<br />
(1000 pseudo-replicates).<br />
Bayesian phylogenetic inference was carried out with MrBayes 3.1.2 (Ronquist <strong>and</strong> Huelsenbeck<br />
2003). Two parallel runs, each consisting <strong>of</strong> four incrementally heated chains were run for 25 million<br />
generations, sampling every thous<strong>and</strong> generations. Convergence <strong>of</strong> log-likelihoods <strong>and</strong> parameter<br />
values was assessed in Tracer v1.4 (Rambaut <strong>and</strong> Drummond 2007). A burnin sample <strong>of</strong> 2.5 million<br />
trees was removed before constructing the majority rule consensus tree.
Topological hypothesis testing<br />
PHYLOGENY OF GREEN ALGAE 31<br />
Approximately unbiased tests (AU test, Shimodaira 2002) were used to test the alternative<br />
relationships between UTC classes. Site likelihoods were calculated by maximum likelihood<br />
optimization in Treefinder using the same model specifications as for phylogenetic inference. AU<br />
tests were performed with CONSEL V0.1i (Shimodaira <strong>and</strong> Hasegawa 2001).<br />
In addition Bayes Factors were used to evaluate the alternative branching order between UTC classes<br />
(Kass <strong>and</strong> Raftery 1995). Two additional Bayesian analyses using identical conditions as the original<br />
analysis that yielded the T(UC) phylogeny were run while constraining the topology to conform to<br />
either C(UT) or U(TC). The harmonic mean estimates <strong>of</strong> the marginal likelihoods <strong>of</strong> the competing<br />
hypotheses were obtained with the sump comm<strong>and</strong> in MrBayes <strong>and</strong> used to calculate the Bayes<br />
Factors (BF) as twice the difference in marginal likelihood between the competing hypotheses<br />
(Nyl<strong>and</strong>er et al. 2004).<br />
Removal <strong>of</strong> fast-evolving sites: site stripping<br />
We applied a modified site stripping approach (Waddell et al. 1999) to improve the signal to noise<br />
ratio in the epoch <strong>of</strong> interest. Site-specific rates were calculated in HyPhy (Pond et al. 2005).<br />
Progressive removal <strong>of</strong> the fastest sites, 5% each time, resulted in a set <strong>of</strong> alignments that were<br />
subjected to ML analysis as described above. We used a novel modus oper<strong>and</strong>i to reveal the trend <strong>of</strong><br />
signal change with increasing amounts <strong>of</strong> site stripping <strong>and</strong> select an optimal site stripping condition<br />
(Fig. 3). First, we performed rate smoothing on the ML tree obtained from the complete alignment to<br />
make branch lengths roughly proportional to <strong>evolution</strong>ary time (Fig. 3A), using the nonparametric<br />
rate smoothing (NPRS) method with the Powell optimization algorithm implemented in r8s<br />
(S<strong>and</strong>erson 2003). Second, the epoch <strong>of</strong> interest (containing the UTC <strong>and</strong> ulvophycean<br />
diversification) was located in the tree. Third, the strength <strong>of</strong> phylogenetic signal, measured as<br />
average bootstrap values (BV) in a sliding window across the rate-smoothed tree, was plotted for all<br />
site-stripping conditions (e.g. Fig. 3B). Fourth, we calculated signal gain in the epoch <strong>of</strong> interest (GE)<br />
by integrating the function representing the difference between the BV <strong>of</strong> the site-stripped condition<br />
<strong>and</strong> the BV <strong>of</strong> the analysis on the complete alignment across the epoch <strong>of</strong> interest (Fig. 3C). Finally,<br />
these gain values were compared between site stripping conditions, leading to the conclusion that<br />
moderate site stripping (25% <strong>of</strong> characters removed) yielded maximum signal in the epoch <strong>of</strong> interest<br />
(Fig. 3D). The rationale <strong>of</strong> using BV as a proxy <strong>of</strong> signal strength is that these values reflect the clarity<br />
<strong>of</strong> the signal in the data, i.e., are inversely related to the amount <strong>of</strong> conflict in the data (Felsenstein<br />
1985, Soltis <strong>and</strong> Soltis 2003). It may seem as circular reasoning to use BV to decide on the most<br />
suitable site stripping condition <strong>and</strong> subsequently use BV to come to conclusions about the strength<br />
<strong>of</strong> relationships. However, this is not entirely true because GE is calculated over a wide temporal<br />
range <strong>and</strong> across all lineages in the relevant epoch, so it does not rely exclusively on the BV <strong>of</strong> the<br />
branches we wish to resolve.
32 CHAPTER 2<br />
Acknowledgements<br />
We thank Barbara Rinkel, Hervé Moreau, Tatiana Klotchkova, Wytze Stam <strong>and</strong> Jeanine Olsen for<br />
providing cultures, Caroline Vlaeminck for assisting with the <strong>molecular</strong> work, Klaus Valentin for cDNA<br />
library services, Steven Robbens <strong>and</strong> Yves Van de Peer for early access to Ostreococcus data, Rick<br />
Zechman for atpB sequences, Peter Dawyndt for additional processing power, <strong>and</strong> Wim Gillis for IT<br />
support. Funding was provided by the Special Research Fund (Ghent University, DOZA-01107605)<br />
<strong>and</strong> the Research Foundation Fl<strong>and</strong>ers (postdoctoral fellowships to HV, FL <strong>and</strong> ODC). Phylogenetic<br />
analyses were largely carried out on the KERMIT computing cluster (Ghent University).
Additional files<br />
PHYLOGENY OF GREEN ALGAE 33<br />
Figure S2. <strong>Phylogeny</strong> <strong>of</strong> the <strong>green</strong> plant lineage obtained by maximum likelihood inference <strong>of</strong> the complete<br />
dataset containing 7 nuclear genes, nuclear SSU rDNA <strong>and</strong> plastid genes rbcL <strong>and</strong> atpB. Numbers at nodes<br />
indicate ML bootstrap values (top) <strong>and</strong> posterior probabilities (bottom); values below respectively 50 <strong>and</strong> 0.9<br />
are not shown.
ibosomal RNA plastid genes ribosomal protein-coding genes other nuclear genes<br />
nuclear SSU rDNA (18S)<br />
atpB<br />
rbcL<br />
40S S9 60S L3<br />
60S L17 actin<br />
G6PI<br />
GapA<br />
OEE1<br />
1974 bp<br />
1380 bp<br />
1380 bp<br />
537 bp 1152 bp<br />
468 bp 1122 bp<br />
753 bp<br />
966 bp<br />
477 bp<br />
Cyanophora paradoxa 1953 1380 1380 520 1152 468 1122 753 966 477 99% <strong>of</strong> sites<br />
Cyanidioschyzon merolae 1974 1380 633 1122 753 723 477 62% <strong>of</strong> sites<br />
Mesostigma viride 1953 1380 1380 1141 424 1122 684 966 453 92% <strong>of</strong> sites<br />
Chlorokybus atmophyticus 1971 1380 1380 741 966<br />
63% <strong>of</strong> sites<br />
Klebsormidium flaccidum 1953 1254 658 537 1137 424 966 428 63% <strong>of</strong> sites<br />
Entransia fimbriata 1936 1254 1316 1140 451 57% <strong>of</strong> sites<br />
Coleochaete sp. 1953 1255 1354 1122 963<br />
63% <strong>of</strong> sites<br />
Spirogyra sp. 1254 1372 1110 966<br />
45% <strong>of</strong> sites<br />
Closterium sp. 1974 1353 1060 753 474 54% <strong>of</strong> sites<br />
Chara sp. 1940 1254 1380 900 966 477 64% <strong>of</strong> sites<br />
Marchantia polymorpha 1953 1380 1380 537 1068 468 648 753 966 477 89% <strong>of</strong> sites<br />
Physcomitrella patens 1974 1380 1310 537 1152 468 1122 753 966 477 99% <strong>of</strong> sites<br />
Oryza sativa 1974 1380 1380 537 1152 468 1122 753 966 477 100% <strong>of</strong> sites<br />
Arabidopsis thaliana 1971 1380 1380 537 1152 468 1122 753 966 477 100% <strong>of</strong> sites<br />
Ostreococcus tauri 1973 1380 1380 1134 468 1011 753 966 453 92% <strong>of</strong> sites<br />
Nephroselmis olivacea 1974 1380 1380 412 657 519 441 54% <strong>of</strong> sites<br />
Scherffelia dubia 242 1059 465 1122 966 264 34% <strong>of</strong> sites<br />
Tetraselmis sp. 1953 1266 1356 424 883 738 418 64% <strong>of</strong> sites<br />
Chlorella sp. 1953 1380 1380 424 900 753 966 428 77% <strong>of</strong> sites<br />
Prototheca wickerhamii 1974 1380 373 1101 468 1118<br />
61% <strong>of</strong> sites<br />
Helicosporidium 399 468 893<br />
14% <strong>of</strong> sites<br />
Scenedesmus obliquus 1953 1380 1380 537 1120 424 833 507 420 77% <strong>of</strong> sites<br />
Chlamydomonas reinhardtii 1974 1380 1380 537 1152 468 1122 753 966 477 100% <strong>of</strong> sites<br />
Volvox carteri 1227 1350 537 1152 1122 477 56% <strong>of</strong> sites<br />
Halochlorococcum 1960 891 742<br />
33% <strong>of</strong> sites<br />
Bolbocoleon piliferum 1922 613 687 519<br />
24% <strong>of</strong> sites<br />
Acrochaete repens 1928 1325 537 753 520 426 48% <strong>of</strong> sites<br />
Ulva intestinalis 1971 1353 537 870 744 513 451 56% <strong>of</strong> sites<br />
Ulva sp. 1563 1354 1122 753 966 417 56% <strong>of</strong> sites<br />
Ignatius tetrasporus 1954 424 519 441 27% <strong>of</strong> sites<br />
Trentepohlia aurea 1961 1167 417 32% <strong>of</strong> sites<br />
Acetabularia sp. 1973 1142 1320 551 130 949 753 428 57% <strong>of</strong> sites<br />
Bornetella sp. 1973 1141 1318 906 435 53% <strong>of</strong> sites<br />
Halimeda sp. 1949 1209 1326 753<br />
49% <strong>of</strong> sites<br />
Derbesia sp. 1323 714 966 435 32% <strong>of</strong> sites<br />
Bryopsis sp. 716 1197 1323 1083 900 442 39% <strong>of</strong> sites<br />
Codium sp. 729 1380 424 955 452 26% <strong>of</strong> sites<br />
Blastophysa rhizopus 741 519 428 12% <strong>of</strong> sites<br />
Cladophora albida 1972 424 714 906<br />
38% <strong>of</strong> sites<br />
Valonia utricularis 1889 424 753 440 33% <strong>of</strong> sites<br />
Phyllodictyon sp. 1889 537 1149 424 831 753 438 55% <strong>of</strong> sites<br />
Boodlea composita 1889 537 424 900 753 519 453 46% <strong>of</strong> sites<br />
Cladophora coelothrix 1889 537 1152 468 900 753 477 58% <strong>of</strong> sites<br />
Boergesenia forbesii 1927 537 424 900 753<br />
41% <strong>of</strong> sites<br />
Siphonocladus tropicus 1927 537 424 900 753 441 45% <strong>of</strong> sites<br />
78% <strong>of</strong> sites<br />
50% <strong>of</strong> sites<br />
61% <strong>of</strong> sites<br />
37% <strong>of</strong> sites 36% <strong>of</strong> sites<br />
47% <strong>of</strong> sites 49% <strong>of</strong> sites<br />
65% <strong>of</strong> sites 48% <strong>of</strong> sites<br />
67% <strong>of</strong> sites<br />
Fig. S1. Data availability matrix. Graphical representation <strong>of</strong> our concatenated alignment, showing the availability <strong>of</strong> sequence data. The color <strong>of</strong> column <strong>and</strong> row headers indicate the<br />
amount <strong>of</strong> data available for that column or row. Green indicates high data availability, red indicates low data availability <strong>and</strong> yellow/orange represents intermediate data availability.<br />
outgroup<br />
Streptophyta<br />
Prasinophyceae<br />
Trebouxiophyceae<br />
Chlorophyceae<br />
Ulvophyceae<br />
0% 20% 40% 60% 80% 100%<br />
Data availability: percent <strong>of</strong> sites present
PHYLOGENY OF GREEN ALGAE 35<br />
Figure S3. <strong>Phylogeny</strong> <strong>of</strong> the <strong>green</strong> plant lineage inferred from amino-acid sequences <strong>of</strong> 7 nuclear genes <strong>and</strong><br />
plastid genes rbcL <strong>and</strong> atpB <strong>and</strong> nucleotide sequences <strong>of</strong> nuclear SSU rDNA with Bayesian techniques. Numbers<br />
at nodes indicate posterior probabilities; values below 0.9 are not shown.<br />
Because TreeFinder cannot simultaneously analyze nucleotide <strong>and</strong> amino acid sequences only MrBayes was<br />
used to infer this tree. Amino acid sequences used a WAG model with among-site rate heterogeneity (+ 8),<br />
SSU nrDNA was partitioned into loops <strong>and</strong> stems <strong>and</strong> used a GTR+ 8 model. Two parallel runs, each consisting<br />
<strong>of</strong> four incrementally heated chains were run for 3 million generations, sampling every thous<strong>and</strong> generations.<br />
Convergence <strong>of</strong> log-likelihoods <strong>and</strong> parameter values was assessed in Tracer v1.4 (Rambaut <strong>and</strong> Drummond<br />
2007). A burnin sample <strong>of</strong> 300.000 trees was removed before constructing the majority rule consensus tree.
Table S1. Genbank accession numbers for nucleotide sequences <strong>of</strong> actin, glucose-6-phosphate isomerase, glyceraldehydes-3-phosphate dehydrogenase, histone, oxygen<br />
evolving protein, 40S ribosomal protein S9 <strong>and</strong> 60S ribosomal protein L3 <strong>and</strong> L17.<br />
actin G6PI GapA histone OEE1 40S_S9 60S_L3 60S_L17<br />
Chlorophyta<br />
Ulvophyceae<br />
Ulotrichales<br />
Halochlorococcum moorei R102 R102 R73_2<br />
Ulvales<br />
Acrochaete repens R94 R94_Gap2 R94_2 R94 R94_2<br />
Bolbocoleon piliferum R95 R95_GapM R60_2<br />
Enteromorpha sp. R109 R106 R109_GapM R109_1 R109_1_Oxy1 R109_3UTR<br />
Ulva sp. AB106563 (U. pertusa) R110_10 R49_2 R110_1 R110_Oxy2<br />
Ignatius-clade<br />
Ignatius tetrasporus R66_GapM R66_4 R66 R66<br />
R105<br />
Bryopsidales<br />
Blastophysa rhizopus R104 R104_GapM R104 R104<br />
Bryopsis sp. R105 R105_1 R105/ AB293980<br />
(B. plumosa)<br />
Codium sp. R63 R63 R63_1_Oxy1 R63<br />
Derbesia sp. R98 R98_2 R98 R98<br />
Halimeda spp KZN2K4_20 (H. cuneata2) R65_1<br />
Dasycladales<br />
Acetabularia acetabulum R7 AAL00001487 (TBestDB) R103 R103_1_Oxy2 EC096877 CF259099<br />
Bornetella sphaerica R80 R80_1 R80<br />
Siphonocladales<br />
Boergesenia forbesii R21_1 R21_2 R78 R78_1 R78<br />
Boodlea composita R8_1 R38_6 R79_GapM R79 R79_1 R79<br />
Cladophora albida R88_2 R88_19 R88 R88<br />
Cladophora coelothrix R35_3 R35_12 cDNA_lib117 cDNA_lib122 cDNA_lib128 cDNA_lib44 cDNA_lib80<br />
Phyllodictyon spp R18 R85 R85 R85 R85_2 R85 R85<br />
Siphonocladus tropicus R29_3 R84 R84_5 R84 R84_1 R84<br />
Valonia utricularis R86 R86_5 R86 R86<br />
Trentepohliales<br />
Trentepohlia aurea R107 R107_Oxy2<br />
Chlorophyceae<br />
Chlamydomonas reinhardtii D50838 R44_2 L27668 R96_5 X13826 R96_2 = RPS9 R96 = RPL3 XM_001693402<br />
Scenedesmus obliquus R69 SOL00005809 (TBestDB) R69 R69 EC189050 EC189501 R69<br />
Volvox carteri M33963 X06963 AF110780 FD918100 FD837306<br />
Trebouxiophyceae<br />
Chlorella kessleri R97 R97_5 R97_5 R97 R97 R97_1<br />
Helicosporidium sp. AF317896 CX128748 CX128902 CX128917<br />
Prototheca wickerhamii EC181529 EC181191 EC183246 EC180670
actin G6PI GapA histone OEE1 40S_S9 60S_L3 60S_L17<br />
Prasinophyceae<br />
Chlorodendrales<br />
Scherffelia dubia AF061018 DQ270259 AJ919716 AJ919712 AL132935 AJ919390<br />
Tetraselmis spp R76 (T. striata) R76 (T. striata) R76 (T. striata) R76_Oxy2/ AB293977<br />
R76 (T. striata)<br />
(T. cordiformis)<br />
Mamiellales<br />
Ostreococcus tauri CR954216 Steven DQ649076 R68_2 R68 R68 CR954206<br />
Pseudoscourfieldiales<br />
Nephroselmis olivacea EC732532 R112_clon R112_2_GapM R112 R112/ AB293978<br />
Streptophyta<br />
Mesostigmatales<br />
Mesostigma viride AF061020 R111 R111_11 R111 R111/ DN255652 R111 R111<br />
Chlorokybales<br />
Chlorokybus atmophyticus R99 DQ270263 R99<br />
Klebsormidiales<br />
Entransia fimbriata R101 R101_1_Oxy1 R101<br />
Klebsormidium flaccidum R46_7 R67 R67_1_Oxy2 R67_2 R67 R67<br />
Zygnematales<br />
Closterium sp. R4 R4_3 AB293981<br />
R113_3 (C. orbicularis)<br />
Spirogyra sp. AF061021 AJ246030<br />
Coleochaetales<br />
Coleochaete spp AF061019 (C. scutata) DQ270264 (C.<br />
scutata)<br />
Charales<br />
AB293979 (C. braunii)<br />
Chara spp DQ846905 (C. contraria) DQ270262 (C.<br />
vulgaris)<br />
Embryophyta (l<strong>and</strong> plants)<br />
Marchantiophyta (Liverworts)<br />
Marchantia polymorpha AB100427 BJ863864 AJ246026 AB185062 BJ844290 BJ861755 BJ852563 BJ853031<br />
Bryophyta (Mosses)<br />
Physcomitrella patens XM_001782636 XM_001760154 DQ270266 BJ975811 XM_001763206 XM_001754317 XM_001782386 XM_001767807<br />
Spermatophyta (Seed plants)<br />
Arabidopsis thaliana M20016 AB044951 NM_101161 X60429 AJ145957 AB010077 M32655 AC004393<br />
Oryza sativa X16280 D45217 NM_001059519 NM_001056811 NM_001049669 NM_001055539 D12630 NM_001069236<br />
other eukaryotes<br />
Archaeplastida<br />
Glaucocystophyta<br />
Cyanophora paradoxa CPU90325 DQ812897 DQ270258 ES235644 AJ784854 EC666063 EC661414 EC666069<br />
Rhodophyta<br />
Cyanidiophyceae<br />
Cyanidioschyzon merolae D32140 CMT497C_Steven AP006492 AP006496 AB159597 AP006495
38 CHAPTER 2<br />
Table S1 continued. Genbank accession numbers for nucleotide sequences <strong>of</strong> atpB, rbcL <strong>and</strong> SSU rDNA.<br />
Chlorophyta<br />
Ulvophyceae<br />
Ulotrichales<br />
Ulvales<br />
atpB rbcL SSU rDNA<br />
Halochlorococcum moorei AY198122<br />
Acrochaete repens FJ715715 FJ715684<br />
Bolbocoleon piliferum FJ715716 AY205330<br />
Enteromorpha sp. AY422552 AJ000040<br />
Ulva sp. AF499668 (U. fenestrate)<br />
Ignatius-clade<br />
Ignatius tetrasporus AB110439<br />
Bryopsidales<br />
Bryopsis sp. FJ480417 (B. plumosa) FJ715718 FJ715685 (B. plumosa)<br />
Codium sp. M67453 (C. fragile) FJ715686 (C. platylobium)<br />
Derbesia sp. AF212142 (D. marina)<br />
Halimeda spp FJ480416 (H. discoidea) FJ715719 (H. incrassate) AY786526 (H. gracilis)<br />
Dasycladales<br />
Acetabularia spp FJ480413 (A. dentate) FJ715714 (A. acetabulum) Z33461 (A. acetabulum)<br />
Bornetella spp FJ480414 (B. nitida) FJ715717 (B. sphearica) Z33464 (B. nitida)<br />
Siphonocladales<br />
Boergesenia forbesii AM498746<br />
Boodlea composita AF510157<br />
Cladophora albida Z35317<br />
Cladophora coelothrix Z35315<br />
Phyllodictyon spp AF510163 (P. pulcherrimum)<br />
Siphonocladus tropicus AM498761<br />
Valonia utricularis Z35323<br />
Trentepohliales<br />
Chlorophyceae<br />
Trebouxiophyceae<br />
Prasinophyceae<br />
Streptophyta<br />
Trentepohlia aurea FJ534608/FJ715722 AB110783<br />
Chlamydomonas reinhardtii NC 005353 NC 005353 M32703<br />
Scenedesmus obliquus NC008101 NC008101 X56103<br />
Volvox carteri AB013999 D63446<br />
Chlorella spp NC 001865 (C. vulgaris) NC 001865 (C. vulgaris) X13688 (C. vulgaris)<br />
Prototheca wickerhamii AJ245645 X74003<br />
Chlorodendrales<br />
Tetraselmis spp DQ173248 (T. chuii suecica) DQ173247 (T. chuii suecica) X70802 (T. striata)<br />
Mamiellales<br />
Ostreococcus tauri NC 008289 NC 008289 AY329635<br />
Pseudoscourfieldiales<br />
Nephroselmis olivacea NC 00927 NC 00927 X74754<br />
Mesostigmatales<br />
Mesostigma viride NC 002186 NC 002186 AJ250109<br />
Chlorokybales<br />
Chlorokybus atmophyticus DQ422812 DQ422812 M95612<br />
Klebsormidiales<br />
Entransia fimbriata AY823688 E88 slordig LB2793<br />
Klebsormidium flaccidum AF408801 E87 rbcL2 X75520<br />
Zygnematales<br />
Closterium spp AJ553936 (C. lunula) AF352237 (C. gracile)
PHYLOGENY OF GREEN ALGAE 39<br />
atpB rbcL SSU rDNA<br />
Spirogyra spp AF408797 (S. maxima) FJ715721 (S. sp.)<br />
Coleochaetales<br />
Charales<br />
Coleochaete scutata AY082303 AY082313 X68825<br />
Chara spp AF408782 (C. connivens) L13476 (C. connivens) U18493 (C. connivens)<br />
Embryophyta (l<strong>and</strong> plants)<br />
other eukaryotes<br />
Archaeplastida<br />
Marchantiophyta (Liverworts)<br />
Marchantia polymorpha NC 001319 NC 001319 AB021684<br />
Bryophyta (Mosses)<br />
Physcomitrella patens AP005672 AB066207 X80986<br />
Spermatophyta (Seed plants)<br />
Glaucocystophyta<br />
Rhodophyta<br />
Arabidopsis thaliana NC 000932 NC 000932 AC006837<br />
Oryza sativa AC092750 AJ746297 X00755<br />
Cyanophora paradoxa NC 001675 NC 001675 AY823716<br />
Cyanidiophyceae<br />
Cyanidioschyzon merolae AB002583 AB158485
40 CHAPTER 2<br />
Table S2. Algal strain information.<br />
Chlorophyta<br />
Ulvophyceae<br />
Ulvales<br />
number Culture collection<br />
Acrochaete repens E093db Barbara Rinkel (Natural History Museum, London)<br />
Bolbocoleon piliferum E344pc Barbara Rinkel (Natural History Museum, London)<br />
Ulva intestinalis EE3 Field collection at Goese Sas (Netherl<strong>and</strong>s)<br />
Ulva sp. EE2 <strong>and</strong> EE6 Field collection at Goese Sas (Netherl<strong>and</strong>s)<br />
Ulotrichales<br />
Halochlorococcum tenue 19.92 Sammlung von Algenkulturen (University <strong>of</strong> Göttingen, Germany)<br />
Ignatius-clade<br />
Ignatius tetrasporus 2012 UTEX culture collection <strong>of</strong> <strong>algae</strong> (University <strong>of</strong> Texas at Austin, USA)<br />
Bryopsidales<br />
Blastophysa rhizopus LB 1029 UTEX culture collection <strong>of</strong> <strong>algae</strong> (University <strong>of</strong> Texas at Austin, USA)<br />
Bryopsis sp. EE4 Field collection at Goese Sas (Netherl<strong>and</strong>s)<br />
Codium sp HEC 15711 Field collection in Madeira<br />
Derbesia sp. 2773-1 Tatiana Klotchkova (Kongju National University, Korea)<br />
Ostreobium quekettii 6.99 Sammlung von Algenkulturen (University <strong>of</strong> Göttingen, Germany)<br />
Trentepohliales<br />
Trentepohlia aurea 483-1 Sammlung von Algenkulturen (University <strong>of</strong> Göttingen, Germany)<br />
Dasycladales<br />
Acetabularia acetabulum LB 2694 UTEX culture collection <strong>of</strong> <strong>algae</strong> (University <strong>of</strong> Texas at Austin, USA)<br />
Bornetella sphaerica LB 2690 UTEX culture collection <strong>of</strong> <strong>algae</strong> (University <strong>of</strong> Texas at Austin, USA)<br />
Siphonocladales<br />
Chlorophyceae<br />
Trebouxiophyceae<br />
Prasinophyceae<br />
Streptophyta<br />
Boergesenia forbesii Boerg2 <strong>and</strong> 3 <strong>Phycology</strong> Research Group, Ghent University*<br />
Boodlea composita Bcomp2, 4 <strong>and</strong> 6 <strong>Phycology</strong> Research Group, Ghent University*<br />
Cladophora albida Calb3 <strong>Phycology</strong> Research Group, Ghent University*<br />
Cladophora coelothrix Ccoel1 <strong>and</strong> 2 <strong>Phycology</strong> Research Group, Ghent University*<br />
Phyllodictyon orientale Struv1, West 1631 John West (University <strong>of</strong> Melbourne, Australia)<br />
Siphonocladus tropicus Siph2 <strong>and</strong> 3 <strong>Phycology</strong> Research Group, Ghent University*<br />
Valonia utricularis Vutric2 <strong>Phycology</strong> Research Group, Ghent University*<br />
Chlamydomonas reinhardtii CC1690 Chlamydomonas Center (Duke University, USA)<br />
Scenedesmus obliquus 1450 UTEX culture collection <strong>of</strong> <strong>algae</strong> (University <strong>of</strong> Texas at Austin, USA)<br />
Chlorella kessleri 211-11g Sammlung von Algenkulturen (University <strong>of</strong> Göttingen, Germany)<br />
Tetraselmis striata 41.85 Sammlung von Algenkulturen (University <strong>of</strong> Göttingen, Germany)<br />
Ostreococcus tauri OTH95 Hervé Moreau (Observatoire Océanologique de Banyuls)<br />
Nephroselmis olivacea 40.89 Sammlung von Algenkulturen (University <strong>of</strong> Göttingen, Germany)<br />
Chlorokybus atmophyticus 48.80 Sammlung von Algenkulturen (University <strong>of</strong> Göttingen, Germany)<br />
Entransia fimbriata LB 2793 UTEX culture collection <strong>of</strong> <strong>algae</strong> (University <strong>of</strong> Texas at Austin, USA)<br />
Klebsormidium flaccidum KL1 Hans Sluiman (Royal Bot Garden Edinburgh, Scotl<strong>and</strong>); described in<br />
G.M. Lokhorst (1996)<br />
Mesostigma viride 50-1 Sammlung von Algenkulturen (University <strong>of</strong> Göttingen, Germany)<br />
Nephroselmis olivacea 40.89 Sammlung von Algenkulturen (University <strong>of</strong> Göttingen, Germany)<br />
Spirogyra sp. 169.80 Sammlung von Algenkulturen (University <strong>of</strong> Göttingen, Germany)<br />
*donated by Jeanine Olsen <strong>and</strong> Wytze Stam (University <strong>of</strong> Groningen, Netherl<strong>and</strong>s)
PHYLOGENY OF GREEN ALGAE 41<br />
Table S3. Primer sequences used for PCR amplification <strong>and</strong> sequencing. Primers were found in literature, adapted<br />
from existing primers or based on aligned Genbank sequence <strong>of</strong> <strong>green</strong> <strong>algae</strong> <strong>and</strong> l<strong>and</strong> plants (Viridiplantae), <strong>of</strong>ten<br />
complemented with a Cladophora coelothrix cDNA sequence.<br />
Primer name Primer sequence (5’-3’) Primers based on<br />
Actin<br />
Actin_F GAC ATG GAR AAR ATN TGG CAC CAC AC 244F; An et al. (1999)<br />
Actin_R ATC CAC ATC TGY TGA AAR GTR G Ac3-R; Bhattacharya, Stickes, <strong>and</strong> Sogin (1993)<br />
Ac3-R GAA GCA YTT GCG RTG SAC RAT Bhattacharya, Stickes, <strong>and</strong> Sogin (1993)<br />
Fern5-F CTT GTY TGY GAC AAT GGA TCW GGA ATG GT An et al. (1999)<br />
Glucose-6-phosphate isomerase<br />
G6PI_F TTY GCR TTY TGG GAC TGG G Ostreococcus <strong>and</strong> l<strong>and</strong> plants<br />
G6PI_R CCC CAC TGG TCR AAI GAR TT Ostreococcus <strong>and</strong> l<strong>and</strong> plants<br />
Glyceraldehyde-3-phosphate dehydrogenase<br />
GapA_Fb GSN ATH AAY GGN TTY GG Petersen et al. (2006)<br />
GapA_Re CCA YTC RTT RTC RTA CCA Petersen et al. (2006)<br />
GapA_Fm GCI YSI TGC ACI ACY AAC TG <strong>green</strong> <strong>algae</strong> <strong>and</strong> l<strong>and</strong> plants<br />
Oxygen-evolving enhancer protein, chloroplastic (OEE1)<br />
Oxy_F1 TGA CCT AYI TGC ARR TYA AGG G Viridiplantae <strong>and</strong> cDNA library Cladophora<br />
Oxy_F2 CIG GCI TKG CCA ACA CIT GCC C Viridiplantae <strong>and</strong> cDNA library Cladophora<br />
Oxy_R GAR CCA CCR CGG CCC TTG GGG TC Viridiplantae <strong>and</strong> cDNA library Cladophora<br />
40S ribosomal protein S9 (RPS9)<br />
40S_S9_F ATG CCG AAG ATC GSC YAK TAY CGC Viridiplantae <strong>and</strong> cDNA library Cladophora<br />
40S_S9_R CAC KCK AGC GTG GTG GAT GGA CTT Viridiplantae <strong>and</strong> cDNA library Cladophora<br />
40S_S9_3’UTR GTC TAT CCT GTC CAG CCT GAG CAG C Viridiplantae <strong>and</strong> cDNA library Cladophora<br />
60S ribosomal protein L3 (RPL3)<br />
60S_L3_F ATG TCI CAC AGI AAG TTT GAA CAC CC Viridiplantae <strong>and</strong> cDNA library Cladophora<br />
60S_L3_R GTC TTG CGI GGM AGI CGG GTG AC Viridiplantae <strong>and</strong> cDNA library Cladophora<br />
60S ribosomal protein L17 (RPL17)<br />
60S_L17_F CAA GGC GCG CGG GTC GGA YCT Viridiplantae <strong>and</strong> cDNA library Cladophora<br />
60S_L17_R CAT GTA CGG GTT GAT GCG RCC RTG CGC Viridiplantae <strong>and</strong> cDNA library Cladophora<br />
cDNA library pExCell primers<br />
M13_F GTA AAA CGA CGG CCA GT<br />
M13_R GGA AAC AGC TAT GAC CAT G
42 CHAPTER 2<br />
Table S4. PCR conditions, expected length <strong>of</strong> PCR products <strong>and</strong> total length <strong>of</strong> the alignment used for<br />
phylogenetic inferences.<br />
primer combination Annealing Length <strong>of</strong> Total length Comment<br />
temperature PCR product alignment<br />
Actin 1122 bp<br />
Actin_F + Actin_R 55°C ≈ 850 bp<br />
Ac3-R + Fern5-F 55°C ≈ 1000 bp Closterium<br />
Glucose-6-phosphate isomerase 753 bp<br />
G6PI_F + G6PI_R 55°C ≈ 760 bp<br />
Glyceraldehyde-3-phosphate dehydrogenase 966 bp<br />
GapA_Fb + GapA_Re 50°C ≈ 1000 bp<br />
GapA_Fm +GapA_Re 50°C ≈ 550 bp<br />
Oxygen-evolving enhancer protein, chloroplastic 762 bp<br />
Oxy_F1 + Oxy_R 50°C ≈ 470 bp<br />
Oxy_F2 + Oxy_R 50°C ≈ 500 bp<br />
40S ribosomal protein S9 (RPS9) 537 bp<br />
40S_S9_F + 40S_S9_R 55°C ≈ 400 bp<br />
40S_S9_F + 40S_S9_3’UTR 55°C ≈ 550 bp Ulva intestinalis<br />
60S ribosomal protein L3 (RPL3) 1185 bp<br />
60S_L3_F + 60S_L3_R 55°C ≈ 730 bp<br />
60S ribosomal protein L17 (RPL17) 477 bp<br />
60S_L17_F + 60S_L17_R 55°C ≈ 380 bp
3<br />
Gain <strong>and</strong> loss <strong>of</strong> elongation factor genes in <strong>green</strong> <strong>algae</strong> 1<br />
Abstract<br />
Background<br />
Two key genes <strong>of</strong> the translational apparatus, elongation factor-1 alpha (EF-1α) <strong>and</strong> elongation<br />
factor-like (EFL) have an almost mutually exclusive distribution in eukaryotes. In the <strong>green</strong> plant<br />
lineage, the Chlorophyta encode EFL except Acetabularia where EF-1α is found, <strong>and</strong> the Streptophyta<br />
possess EF-1α except Mesostigma, which has EFL. These results raise questions about <strong>evolution</strong>ary<br />
patterns <strong>of</strong> gain <strong>and</strong> loss <strong>of</strong> EF-1α <strong>and</strong> EFL. A previous study launched the hypothesis that EF-1α was<br />
the primitive state <strong>and</strong> that EFL was gained once in the ancestor <strong>of</strong> the <strong>green</strong> plants, followed by<br />
differential loss <strong>of</strong> EF-1α or EFL in the principal clades <strong>of</strong> the Viridiplantae. In order to gain more<br />
insight in the distribution <strong>of</strong> EF-1α <strong>and</strong> EFL in <strong>green</strong> plants <strong>and</strong> test this hypothesis we screened the<br />
presence <strong>of</strong> the genes in a large sample <strong>of</strong> <strong>green</strong> <strong>algae</strong> <strong>and</strong> analyzed their gain-loss dynamics in a<br />
maximum likelihood framework using continuous-time Markov models.<br />
Results<br />
Within the Chlorophyta, EF-1α is shown to be present in three ulvophycean orders (i.e., Dasycladales,<br />
Bryopsidales, Siphonocladales) <strong>and</strong> the genus Ignatius. Models describing gene gain-loss dynamics<br />
revealed that the presence <strong>of</strong> EF-1α, EFL or both genes along the backbone <strong>of</strong> the <strong>green</strong> plant<br />
phylogeny is highly uncertain due to sensitivity to branch lengths <strong>and</strong> lack <strong>of</strong> prior knowledge about<br />
ancestral states or rates <strong>of</strong> gene gain <strong>and</strong> loss. Model refinements based on insights gained from the<br />
EF-1α phylogeny reduce uncertainty but still imply several equally likely possibilities: a primitive EF-<br />
1α state with multiple independent EFL gains or coexistence <strong>of</strong> both genes in the ancestor <strong>of</strong> the<br />
Viridiplantae or Chlorophyta followed by differential loss <strong>of</strong> one or the other gene in the various<br />
lineages.<br />
Conclusions<br />
EF-1α is much more common among <strong>green</strong> <strong>algae</strong> than previously thought. The mutually exclusive<br />
distribution <strong>of</strong> EF-1α <strong>and</strong> EFL is confirmed in a large sample <strong>of</strong> <strong>green</strong> plants. Hypotheses about the<br />
gain-loss dynamics <strong>of</strong> elongation factor genes are hard to test analytically due to a relatively flat<br />
likelihood surface, even if prior knowledge is incorporated. Phylogenetic analysis <strong>of</strong> EFL genes<br />
indicates misinterpretations in the recent literature due to uncertainty regarding the root position.<br />
1 Published as: Cocquyt, E.*, H. Verbruggen*, F. Leliaert, F. W. Zechman, K. Sabbe, <strong>and</strong> O. De Clerck. 2009. Gain<br />
<strong>and</strong> loss <strong>of</strong> elongation factor genes in <strong>green</strong> <strong>algae</strong>. BMC Evolutionary Biology 9:39.<br />
* Equal contributors
44 CHAPTER 3<br />
Background<br />
Elongation factor-1 alpha (EF-1α) is a core element <strong>of</strong> the translation apparatus <strong>and</strong> member <strong>of</strong> the<br />
GTPase protein family. The gene has been widely used as a phylogenetic marker in eukaryotes; either<br />
to resolve their early <strong>evolution</strong> (e.g., Baldauf et al. 1996, Roger et al. 1999) or more recent<br />
phylogenetic patterns (e.g., Hashimoto et al. 1994, Baldauf <strong>and</strong> Doolittle 1997, Beltran et al. 2007,<br />
Sung et al. 2007, Zhang <strong>and</strong> Qiao 2007). The <strong>evolution</strong>ary history <strong>of</strong> genes used for such inferences<br />
should closely match that <strong>of</strong> the organisms <strong>and</strong> not be affected by ancient paralogy or lateral gene<br />
transfer (Keeling <strong>and</strong> Inagaki 2004). A gene related to but clearly distinguishable from EF-1α, called<br />
elongation factor-like (EFL), appears to substitute EF-1α in a scattered pattern: several unrelated<br />
eukaryote lineages have representatives that encode EFL <strong>and</strong> others that possess EF-1α. The EFL <strong>and</strong><br />
EF-1α genes are mutually exclusive in all but two organisms: the zygomycete fungus Basidiobolus <strong>and</strong><br />
the diatom Thalassiosira (James et al. 2006, Kamikawa et al. 2008). Although EFL is found in several<br />
eukaryotic lineages, EF-1α is thought to be the most abundant <strong>of</strong> both (Rogers et al. 2007). So far,<br />
EFL has been reported in chromalveolates (Perkinsus, din<strong>of</strong>lagellates, diatoms, haptophytes,<br />
cryptophytes), the plant lineage (<strong>green</strong> <strong>and</strong> red <strong>algae</strong>), rhizarians (cercozoans, foraminifera), unikonts<br />
(some Fungi <strong>and</strong> choanozoans) <strong>and</strong> centrohelids (Keeling <strong>and</strong> Inagaki 2004, Gile et al. 2006, Noble et<br />
al. 2007, Kamikawa et al. 2008, Sakaguchi et al. 2008).<br />
The mutually exclusive distribution <strong>of</strong> EF-1α <strong>and</strong> EFL suggests similar functionality. The main function<br />
<strong>of</strong> EF-1α is translation initiation <strong>and</strong> termination, by delivering aminoacyl tRNAs to the ribosomes<br />
(Negrutskii <strong>and</strong> El'skaya 1998). Other functions include interactions with cytoskeletal proteins:<br />
transfer, immobilization <strong>and</strong> translation <strong>of</strong> mRNA <strong>and</strong> involvement in the ubiquitine-dependent<br />
proteolytic system, as such forming an intriguing link between protein synthesis <strong>and</strong> degradation<br />
(Negrutskii <strong>and</strong> El'skaya 1998). In contrast, the function <strong>of</strong> EFL is barely known. It is assumed to have<br />
a translational function because the putative EF-1β, aa-tRNA, <strong>and</strong> GTP/GDP binding sites do not differ<br />
between EF-1α <strong>and</strong> EFL (Keeling <strong>and</strong> Inagaki 2004). Based on a reverse transcriptase quantitative PCR<br />
assay in the diatom Thalassiosira, which possesses both genes, it was proposed that EFL had a<br />
translation function while EF-1α performed the auxiliary functions (Kamikawa et al. 2008).<br />
The apparently scattered distribution <strong>of</strong> EFL across eukaryotes raises questions about the gain-loss<br />
patterns <strong>of</strong> genes with an important role in the cell. This mutually exclusive <strong>and</strong> seemingly scattered<br />
distribution can be explained by two different mechanisms: ancient paralogy <strong>and</strong> lateral gene<br />
transfer. Ancient paralogy was considered unlikely because this would imply that both genes were<br />
present in ancestral eukaryotic genomes during extended periods <strong>of</strong> <strong>evolution</strong>ary history while the<br />
genes rarely coexist in extant species (Keeling <strong>and</strong> Inagaki 2004). Furthermore, a prolonged<br />
coexistence <strong>of</strong> both genes in early eukaryotes would have likely resulted in either functional<br />
divergence or pseudogene formation <strong>of</strong> one or the other copy (Van de Peer et al. 2001), as is<br />
suggested for EFL <strong>and</strong> EF-1α coexisting in the diatom Thalassiosira (Kamikawa et al. 2008). Keeling<br />
<strong>and</strong> Inagaki (Keeling <strong>and</strong> Inagaki 2004) proposed lateral gene transfer <strong>of</strong> the EFL gene between<br />
eukaryotic lineages as the most likely explanation for the scattered distribution <strong>of</strong> both genes.<br />
In the <strong>green</strong> plants (Viridiplantae), EF-1α <strong>and</strong> EFL seem to show a mutually exclusive distribution. Of<br />
the two major <strong>green</strong> plant lineages, the Chlorophyta were shown to have EFL with the exception <strong>of</strong><br />
Acetabularia where EF-1α is found, <strong>and</strong> the Streptophyta were shown to possess EF-1α with the
GAIN AND LOSS OF ELONGATION FACTOR GENES 45<br />
exception <strong>of</strong> Mesostigma, which has EFL (Noble et al. 2007). Noble et al. (2007) proposed the<br />
hypothesis that EFL was introduced once in the ancestor <strong>of</strong> the <strong>green</strong> lineage, followed by<br />
differential loss <strong>of</strong> EF-1α or EFL in the principal clades <strong>of</strong> the Viridiplantae (i.e., Streptophyta <strong>and</strong><br />
Chlorophyta).<br />
The goals <strong>of</strong> the present study are to extend our knowledge <strong>of</strong> the distribution pattern <strong>of</strong> EF-1α <strong>and</strong><br />
EFL in the <strong>green</strong> <strong>algae</strong> <strong>and</strong> investigate patterns <strong>of</strong> gain <strong>and</strong> loss <strong>of</strong> these key genes <strong>of</strong> the translational<br />
apparatus. We applied a RT-PCR <strong>and</strong> sequencing-based screening approach across a broad spectrum<br />
<strong>of</strong> <strong>green</strong> <strong>algae</strong>, with emphasis on the ulvophycean relatives <strong>of</strong> Acetabularia. To test the hypothesis <strong>of</strong><br />
Noble et al. (2007), we modeled patterns <strong>of</strong> gene gain <strong>and</strong> loss. To this goal, a reference phylogeny<br />
based on three commonly used loci was inferred, <strong>and</strong> gain-loss dynamics <strong>of</strong> EFL <strong>and</strong> EF-1α were<br />
optimized along this phylogeny using continuous-time Markov models.<br />
Results <strong>and</strong> Discussion<br />
Distribution <strong>of</strong> elongation factors in the <strong>green</strong> <strong>algae</strong><br />
EF-1α sequences were retrieved from streptophytes Entransia (Klebsormidiophyceae) <strong>and</strong><br />
Chlorokybus (Chlorokybophyceae), confirming previous observations that all Streptophyta except<br />
Mesostigma have EF-1α. We found EFL sequences in Chlorella (Trebouxiophyceae), Acrochaete <strong>and</strong><br />
Bolbocoleon (Ulvophyceae), Nephroselmis <strong>and</strong> Tetraselmis striata (prasinophytes), further confirming<br />
the formerly established distribution pattern within the Chlorophyta. We reaffirmed the presence <strong>of</strong><br />
EFL in Chlamydomonas <strong>and</strong> Scenedesmus (Chlorophyceae), Ulva intestinalis <strong>and</strong> U. fenestra<br />
(Ulvophyceae) <strong>and</strong> Ostreococcus (prasinophytes), previously shown by Noble et al. (2007). In addition<br />
to Acetabularia, EF-1α was discovered in representatives <strong>of</strong> the ulvophycean orders Dasycladales<br />
(Bornetella), Bryopsidales (Blastophysa, Bryopsis, Codium, Derbesia, Ostreobium), Siphonocladales<br />
(Boodlea, Cladophora, Dictyosphaeria, Ernodesmis, Phyllodictyon) <strong>and</strong> in Ignatius (see Figures 1 <strong>and</strong><br />
2). The RT-PCR approach did not reveal the presence <strong>of</strong> both genes in any <strong>of</strong> the screened species<br />
despite the fact that our primers could amplify the target genes across the Viridiplantae. Our RT-PCR<br />
experiments on two species whose genomes have been sequenced (Chlamydomonas <strong>and</strong><br />
Ostreococcus) yielded a single gene for each species, a result in compliance with the knowledge<br />
derived from their genome sequences (DOE Joint Genome Institute).<br />
The reference phylogeny, inferred from a DNA matrix consisting <strong>of</strong> 72 taxa representing all major<br />
plant lineages <strong>and</strong> three loci (SSU rDNA, rbcL <strong>and</strong> atpB), is in accordance with recent phylogenetic<br />
studies, including the position <strong>of</strong> Mesostigma within the Streptophyta (Lemieux et al. 2007,<br />
Rodriguez-Ezpeleta et al. 2007). Figure 1 shows the phylogenetic relationships among the taxa for<br />
which we have information on elongation factors; the full 72-taxon phylogeny can be found as an<br />
online supplement [see Additional file 1]. Even though the tree shows improved resolution from<br />
previous studies, large parts <strong>of</strong> the backbone remained poorly resolved. In order to obtain a solid<br />
hypothesis <strong>of</strong> <strong>green</strong> algal <strong>evolution</strong>, much additional sequence data may have to be gathered. The<br />
occurrence <strong>of</strong> EF-1α <strong>and</strong> EFL in terminal taxa was plotted on the reference phylogeny in Figure 1.<br />
Mesostigma is the only streptophyte which encodes EFL. Within the chlorophytan class Ulvophyceae,
46 CHAPTER 3<br />
the order Ulvales possesses EFL whereas the other orders encode EF-1α (Dasycladales,<br />
Siphonocladales, Bryopsidales <strong>and</strong> Ignatius).<br />
Figure 1. Distribution <strong>of</strong> EF-1α <strong>and</strong> EFL in the <strong>green</strong> plants. The type <strong>of</strong> elongation factor is indicated with black<br />
(EF-1α) or gray (EFL) squares. The reference phylogeny was obtained by Bayesian phylogenetic inference <strong>of</strong><br />
nuclear SSU rDNA <strong>and</strong> the plastid genes rbcL <strong>and</strong> atpB. Numbers at nodes indicate posterior probabilities (top)<br />
<strong>and</strong> ML bootstrap values (bottom); values below respectively 0.9 <strong>and</strong> 50 are not shown.
GAIN AND LOSS OF ELONGATION FACTOR GENES 47<br />
Figure 2. Phylogenies inferred from EF-1α <strong>and</strong> EFL amino-acid sequences with Bayesian techniques. Sequences<br />
belonging to the <strong>green</strong> plant lineage are in gray boxes. Whereas all <strong>green</strong> plant EF-1α sequences group in a<br />
single clade, the <strong>green</strong> plant EFL sequences seem to form separate lineages. Sequences generated for this<br />
study are indicated with triangles. Numbers at nodes indicate posterior probabilities (top) <strong>and</strong> ML bootstrap<br />
values (bottom); values below respectively 0.9 <strong>and</strong> 50 are not shown.<br />
Phylogenies <strong>of</strong> EF-1α <strong>and</strong> EFL<br />
All <strong>green</strong> plant EF-1α sequences form a monophyletic group clearly differentiated from EF-1α<br />
sequences <strong>of</strong> a variety <strong>of</strong> other eukaryotes (Figure 2A). Even though the Viridiplantae form a strongly<br />
supported group, resolution among <strong>and</strong> within Streptophyta <strong>and</strong> Chlorophyta is generally low, which<br />
could in part be due to some short EF-1α sequences included in the analysis.<br />
In contrast, <strong>green</strong> plant EFL genes do not form a monophyletic lineage (Figure 2B). Although the<br />
backbone <strong>of</strong> the phylogeny is moderately resolved, monophyly <strong>of</strong> <strong>green</strong> plant EFL genes is unlikely<br />
because it is not observed in the MCMC output (zero posterior probability). EFL sequences <strong>of</strong> the<br />
Viridiplantae can be found in several clades. The chlorophytes, trebouxiophytes, ulvophytes <strong>and</strong><br />
prasinophyte Tetraselmis form a single monophyletic group. The other prasinophyte EFL sequences<br />
form two separate groups. The last clade consists <strong>of</strong> the streptophyte Mesostigma.<br />
To obtain an accurate root position for our EFL tree, we included related subfamilies <strong>of</strong> the GTPase<br />
translation factor superfamily: EF-1α, eukaryotic release factor 3 (eRF3), heat shock protein 70<br />
subfamily B suppressor (HBS1) <strong>and</strong> archaebacterial EF-1α sequences in our analyses. In accordance<br />
with Keeling <strong>and</strong> Inagaki (Keeling <strong>and</strong> Inagaki 2004), the tree is rooted with archaebacterial EF-1α<br />
sequences. All analyses (Bayesian <strong>and</strong> ML) resulted in a phylogeny very similar to the one shown in
48 CHAPTER 3<br />
Figure 2B, the complete phylogeny with all related subfamilies can be found as an online supplement<br />
[see Additional file 2]. This phylogeny shows seven EFL clades, with the following branching order:<br />
Bigelowiella, the diatoms, Planoglabratella, the cryptophyte Goniomonas, red <strong>algae</strong>, choanozoans,<br />
<strong>and</strong> a large clade containing the <strong>green</strong> plant lineage, chromalveolates (din<strong>of</strong>lagellates, haptophytes,<br />
cryptophytes), fungi <strong>and</strong> Rhaphidiophrys (Figures 2B). Deep branches generally received low<br />
statistical support, preventing strong conclusions about the relationship between the seven clades.<br />
Gain-loss dynamics<br />
The scattered distribution <strong>of</strong> EF-1α <strong>and</strong> EFL in the <strong>green</strong> plant lineage is a remarkable phenomenon<br />
that raises questions about <strong>evolution</strong>ary patterns <strong>of</strong> gain <strong>and</strong> loss <strong>of</strong> both genes. Noble et al. (2007)<br />
proposed the hypothesis that EF-1α was present in the common ancestor <strong>of</strong> the plant lineage,<br />
followed by a single gain <strong>of</strong> EFL early in <strong>evolution</strong> <strong>of</strong> the <strong>green</strong> lineage <strong>and</strong> subsequent differential<br />
loss <strong>of</strong> one or the other gene in the various lineages. Our aim was to test this hypothesis by modeling<br />
gain-loss dynamics <strong>and</strong> inferring ancestral presence-absence patterns <strong>of</strong> both genes in a maximum<br />
likelihood framework. Gene gain <strong>and</strong> loss rates were estimated by maximum likelihood (ML)<br />
optimization, using a dataset <strong>of</strong> presence-absence patterns <strong>of</strong> EF-1α <strong>and</strong> EFL <strong>and</strong> a reference<br />
phylogeny derived from the Bayesian analysis <strong>of</strong> three commonly used loci (SSU nrDNA, rbcL <strong>and</strong><br />
atpB).<br />
A first analysis, based on the reference tree, shows uncertain character state probabilities along the<br />
backbone <strong>of</strong> the Viridiplantae <strong>and</strong> suggests a loss <strong>of</strong> EF-1α in early Chlorophyta <strong>evolution</strong> <strong>and</strong> regain<br />
in some Ulvophyceae (Figure 3A). Because branch lengths play a crucial role in model optimization,<br />
the analysis was repeated on an alternative version <strong>of</strong> the reference tree in which branch lengths<br />
were transformed using a rate smoothing approach. Since our tree deviates from the <strong>molecular</strong><br />
clock, we performed rate smoothing to obtain branch lengths roughly proportional to time. Rate<br />
smoothing techniques relax the assumption <strong>of</strong> constant rates <strong>of</strong> <strong>evolution</strong> throughout the tree:<br />
differences in rates <strong>of</strong> <strong>molecular</strong> <strong>evolution</strong> are smoothed out by assuming that <strong>evolution</strong>ary rates<br />
change gradually throughout the phylogeny. The result is an ultrametric tree in which branch lengths<br />
are roughly proportional to <strong>evolution</strong>ary time instead <strong>of</strong> amounts <strong>of</strong> <strong>molecular</strong> <strong>evolution</strong>. Modeling<br />
gain-loss dynamics <strong>of</strong> elongation factor genes along the rate-smoothed tree yields results that<br />
strongly deviate from those obtained with the original reference tree: probabilities <strong>of</strong> the character<br />
states along the major part <strong>of</strong> backbone are now around 50 % for EFL <strong>and</strong> around 50 % for the<br />
presence <strong>of</strong> both genes (Figure 3B). Subsequently, an additional level <strong>of</strong> realism was introduced by<br />
taking phylogenetic uncertainty into account because several nodes in the reference tree are poorly<br />
supported. To this goal, all post-burnin MCMC trees were rate-smoothed <strong>and</strong> analyzed individually.<br />
The results were summarized on the rate-smoothed reference tree. Taking phylogenetic uncertainty<br />
into consideration had a minor influence on the probabilities <strong>of</strong> the characters states (Figure 3C).<br />
Although the exact numbers differ between analyses, gene gain rates were always lower than gene<br />
loss rates, reinforcing the notion that gene transfers are rare events in comparison to losses <strong>of</strong><br />
redundant genes (Barker et al. 2007). Whereas the analysis based on the original reference tree<br />
returned faster gain <strong>and</strong> loss rates for EFL than for EF-1α, analyses based on rate-smoothed trees
GAIN AND LOSS OF ELONGATION FACTOR GENES 49<br />
(including MCMC trees) suggested the inverse, marking the sensitivity <strong>of</strong> Markov models to the unit<br />
<strong>of</strong> operational time.<br />
Figure 3. Gain-loss dynamics <strong>of</strong> <strong>green</strong> algal elongation factor genes <strong>and</strong> their inferred presence in ancestral<br />
genomes. Gain <strong>and</strong> loss rates, as well as the estimated probabilities for presence <strong>of</strong> the genes in ancestral<br />
genomes are given for a variety <strong>of</strong> analysis conditions. Panels A-C show the outcome <strong>of</strong> models in which EF-1α<br />
<strong>and</strong> EFL gain <strong>and</strong> loss rates were not constrained. In panels D-F, the gain rate <strong>of</strong> EF-1α was constrained to be<br />
10 -6 . Colors were used to visualize estimated probabilities for presence <strong>of</strong> genes along the tree. Red indicates a<br />
high probability for EF-1α, blue marks a high probability <strong>of</strong> EFL <strong>and</strong> yellow st<strong>and</strong>s for a high probability <strong>of</strong> the<br />
presence <strong>of</strong> both genes. Intermediate colors indicate uncertainty.
50 CHAPTER 3<br />
From these results, it seems fair to conclude that there is major uncertainty about the ancestral<br />
states for a variety <strong>of</strong> reasons, including sensitivity to branch lengths <strong>and</strong> lack <strong>of</strong> prior knowledge<br />
about ancestral states or rates <strong>of</strong> gene gain <strong>and</strong> loss. Considering that the ancestors must have had<br />
either EF-1α, EFL or both genes opens perspectives for hypothesis comparison in a likelihood<br />
framework. Additionally, information about rates <strong>of</strong> gene gain <strong>and</strong> loss could be gleaned from the EF-<br />
1α <strong>and</strong> EFL phylogenies.<br />
Analyses constrained with various hypotheses about ancestral gene content resulted in a confidence<br />
set <strong>of</strong> 8 trees that differ extensively [see Additional file 3]. The fact that strongly different hypotheses<br />
are also present in the confidence set denotes that the likelihood surface is too flat to draw firm<br />
conclusions in favor <strong>of</strong> one or another hypothesis.<br />
The last option to reduce uncertainty is to inform the Markov models with information on gains <strong>and</strong><br />
losses gleaned from the EF-1α <strong>and</strong> EFL trees (cf. Barker et al. 2007). Because <strong>green</strong> plant EF-1α<br />
sequences form a monophyletic <strong>and</strong> strongly supported lineage, it seems fair to assume vertical<br />
descent <strong>of</strong> EF-1α throughout the Viridiplantae. This knowledge can be introduced in our Markov<br />
model by setting a very low gain rate <strong>of</strong> EF-1α. If the analysis is constrained in this way, both EFL <strong>and</strong><br />
EF-1α were inferred to be present along the backbone <strong>of</strong> the Viridiplantae in the original reference<br />
tree (Figure 3D) <strong>and</strong> a 50/50 probability for the presence <strong>of</strong> EF-1α or both genes was obtained in the<br />
rate-smoothed trees (Figures 3E-F). Comparison <strong>of</strong> hypotheses about ancestral gene content<br />
constrained with a very low EF-1α gain rate reduced the confidence set to 3 trees in which either EF-<br />
1α or both genes are present along the backbone [see Additional file 4]. The ML solution (hypothesis<br />
122) assumes that only EF-1α was present along the backbone <strong>of</strong> the tree <strong>and</strong> consequently shows<br />
independent gains <strong>of</strong> EFL in Mesostigma, prasinophytes, Chlorophyceae, Trebouxiophyceae <strong>and</strong><br />
Ulvales. An alternative scenario (hypothesis 123) in the confidence set has EF-1α at the base <strong>of</strong> the<br />
Viridiplantae, a gain <strong>of</strong> EFL in the ancestor <strong>of</strong> the Chlorophyta, <strong>and</strong> subsequent differential loss <strong>of</strong><br />
one or the other gene in the various lineages. Information from the EFL phylogeny may provide clues<br />
for further distinction between either multiple transfers or ancient paralogy with subsequent losses.<br />
The <strong>green</strong> EFL sequences form a highly supported clade together with din<strong>of</strong>lagellates, cryptophytes,<br />
haptophytes, fungi <strong>and</strong> Rhaphidiophrys, suggesting lateral gene transfer <strong>of</strong> the EFL gene between<br />
these distant eukaryotic lineages (Andersson 2005, Keeling <strong>and</strong> Palmer 2008). Considering the ability<br />
<strong>of</strong> chromalveolates (i.e., din<strong>of</strong>lagellates, cryptophytes <strong>and</strong> haptophytes) <strong>and</strong> Raphidiophrys to feed<br />
through phagocytosis (Sakaguchi et al. 2002) <strong>and</strong> the absence <strong>of</strong> this behavior in <strong>green</strong> <strong>algae</strong>, it<br />
would be tempting to assume that lateral gene transfer occurred from <strong>green</strong> <strong>algae</strong> to the<br />
din<strong>of</strong>lagellates, cryptophytes, haptophytes <strong>and</strong> Raphidiophrys instead <strong>of</strong> the other way around.<br />
Phagotrophic eukaryotes have been shown to have elevated rates <strong>of</strong> lateral gene transfer (Gogarten<br />
2003, Andersson 2005) because this feeding mechanism enables them to continually recruit genes<br />
from engulfed prey (Nosenko et al. 2006). Lateral gene transfers to fungi, although known to exist<br />
(Andersson et al. 2003), would require a different explanation because neither phagotrophy nor<br />
endosymbiosis occur in fungi. However, in the light <strong>of</strong> this peripheral information, it would be<br />
tempting to conclude that both EF-1α <strong>and</strong> EFL essentially show vertical descent in <strong>green</strong> plants <strong>and</strong><br />
that the observed mutually exclusive pattern <strong>of</strong> EFL <strong>and</strong> EF-1α sequences results from differential<br />
loss. In this scenario, lateral gene transfer must have occurred from <strong>green</strong> algal cells to other<br />
eukaryotic lineages.
GAIN AND LOSS OF ELONGATION FACTOR GENES 51<br />
In previous studies <strong>of</strong> functionally similar eukaryotic genes with mutually exclusive distributions,<br />
distinction between ancient paralogy with subsequent losses <strong>and</strong> multiple transfers was made based<br />
on two main criteria (Rogers et al. 2007). The first criterion states that if one gene dominates the tree<br />
<strong>and</strong> the other occurs in only a few lineages, multiple independent transfers should be regarded as<br />
the most probable explanation whereas equal representation would suggest common ancestry with<br />
subsequent differential loss. The second criterion is about the age <strong>of</strong> the taxa involved. If the<br />
mutually exclusive pattern occurs between closely related species, one can conclude common<br />
ancestry with subsequent losses. If the pattern is more ancient, multiple lateral transfers are a more<br />
probable explanation. It is obvious that such criteria are very difficult to apply in real situations.<br />
These difficulties can be overcome by taking a probabilistic angle on the problem <strong>and</strong> modeling gainloss<br />
dynamics with continuous-time Markov models. This approach brings statistical rigor to the<br />
analysis <strong>of</strong> gene presence-absence patterns <strong>and</strong> has the potential to discriminate between the<br />
alternative scenarios <strong>of</strong> ancient paralogy with differential losses <strong>and</strong> multiple independent lateral<br />
transfers. Application <strong>of</strong> this technique to our dataset <strong>of</strong> <strong>green</strong> algal elongation factors revealed the<br />
difficulty <strong>of</strong> arriving at firm conclusions about ancient gene transfer events because <strong>of</strong> a relatively flat<br />
likelihood surface <strong>and</strong>, consequently, ambiguous probabilities for gene content at ancestral nodes.<br />
When informed with external information, the analyses allow somewhat more definitive conclusions.<br />
The broader eukaryotic picture<br />
Figure 4. Visualization <strong>of</strong> the posterior<br />
probability <strong>of</strong> rooting <strong>of</strong> the EFL tree. The<br />
topology represents the unrooted topology <strong>of</strong><br />
EFL genes. Branch width is proportional to the<br />
posterior probability that the outgroup,<br />
consisting <strong>of</strong> archaebacterial EF-1α, EF-1α,<br />
eRF3 <strong>and</strong> HBS1 sequences, attaches to the<br />
ingroup tree at that point. Numbers at<br />
branches represent the total posterior<br />
probability that the root is situated along the<br />
branch in question.<br />
In addition to the information gained about elongation factor <strong>evolution</strong> in <strong>green</strong> <strong>algae</strong>, our results<br />
also highlight misinterpretations in recent literature on EFL <strong>evolution</strong> across the eukaryotes. Previous<br />
studies have not been explicit about whether or how their phylogenetic trees were rooted, but have<br />
drawn conclusions that require directionality in the tree. Kamikawa et al. (2008) concluded that<br />
lateral gene transfer from a foraminifer (Planoglabratella) to the ancestor <strong>of</strong> the diatoms must have
52 CHAPTER 3<br />
occurred because the diatom sequences were nested within the Rhizaria (foraminifera <strong>and</strong><br />
cercozoans). In case their tree was unrooted, this conclusion is flawed due to a lack <strong>of</strong> directionality<br />
in the tree. In their presentation <strong>of</strong> the tree, choanozoans are used as one <strong>of</strong> the basal clades,<br />
probably because they were the earliest-branching lineage in the tree presented by Keeling <strong>and</strong><br />
Inagaki (2004). Our EFL tree, which includes EF-1α, eRF3 <strong>and</strong> HBS1 sequences <strong>and</strong> is rooted with<br />
archaebacterial EF-1α sequences, indicates that the directionality inferred by Kamikawa et al. (2008)<br />
is likely to be wrong. Our phylogram (Figures 2B) suggest that the root position <strong>of</strong> EFL lies on the<br />
branch leading towards the cercozoan Bigelowiella, but support is lacking for the basal relationships.<br />
A plot <strong>of</strong> the posterior distribution <strong>of</strong> root placements (Figure 4) illustrates the uncertainty about the<br />
root placement more clearly. It is evident from this plot that the choanozoans are not the oldest<br />
diverging lineage. This finding overturns the conclusion from Kamikawa et al. (2008) because the<br />
nested position <strong>of</strong> the diatom EFL genes within the Rhizaria sequences can no longer be maintained.<br />
Our EFL phylogeny supports the presence <strong>of</strong> lateral gene transfer between eukaryotic lineages,<br />
however, the direction <strong>of</strong> lateral gene transfer is difficult to evaluate.<br />
Conclusions<br />
The mutually exclusive nature <strong>of</strong> EF-1α <strong>and</strong> EFL is confirmed in a large sample <strong>of</strong> <strong>green</strong> <strong>algae</strong>. The<br />
Streptophyta possess EF-1α with the exception <strong>of</strong> Mesostigma, which has EFL. The Chlorophyta<br />
encode EFL with the exception <strong>of</strong> Dasycladales, Bryopsidales, Siphonocladales <strong>and</strong> Ignatius, where<br />
EF-1α is found. This result establishes EF-1α as a widespread gene among <strong>green</strong> <strong>algae</strong>.<br />
Gain-loss models revealed that the probabilities <strong>of</strong> the presence <strong>of</strong> EF-1α, EFL or both genes along<br />
the backbone <strong>of</strong> the plant phylogeny are highly uncertain, <strong>and</strong> that a previously published hypothesis<br />
(Noble et al. 2007) is as likely as several other hypotheses. Model refinements based on insights<br />
gained from the EF-1α phylogeny were unable to distinguish between three possibilities: (1) multiple,<br />
independent gains <strong>of</strong> EFL throughout the plant lineage, (2) a single gain <strong>of</strong> EFL early in <strong>evolution</strong> <strong>of</strong><br />
the plant lineage followed by differential loss, or (3) independent gains <strong>of</strong> EFL in Mesostigma <strong>and</strong> the<br />
ancestor <strong>of</strong> the Chlorophyta followed by differential loss <strong>of</strong> one or the other gene in the various<br />
lineages (Figure 3 D-F <strong>and</strong> Additional file 4).<br />
Further research into the gain-loss dynamics <strong>of</strong> elongation factors <strong>of</strong> <strong>green</strong> plants <strong>and</strong> eukaryotes in<br />
general is needed to come to more definitive conclusions about their <strong>evolution</strong>. First, the EFL<br />
phylogeny should be refined by obtaining full-length sequences for a set <strong>of</strong> relevant taxa to confirm<br />
or reject the presence <strong>of</strong> multiple independent <strong>green</strong> lineages in this tree. The use <strong>of</strong> codon models<br />
may help to achieve this (Seo <strong>and</strong> Kishino 2008). An alternative approach would be to learn about the<br />
processes responsible for lateral transfer <strong>of</strong> elongation factors by studying their flanking regions for<br />
signature sequences <strong>of</strong> mobile elements (Zhang et al. 2006, Dybvig et al. 2007). Finally, studying gainloss<br />
dynamics across a wider spectrum <strong>of</strong> eukaryotic supergroups should lead to more stable<br />
conclusions. In addition to yielding more precise parameter estimates for gene gain <strong>and</strong> loss rates, a<br />
eukaryote-wide study would allow the use <strong>of</strong> more specific models for lateral gene transfer because<br />
both donor <strong>and</strong> recipient lineages would be present in the analysis (Than et al. 2006, Galtier 2007,<br />
Lake 2008). It remains an enigma that the <strong>evolution</strong> <strong>of</strong> elongation factors, genes crucial for cell<br />
functioning, is marked by such complex gain-loss patterns.
Methods<br />
Algal strains<br />
GAIN AND LOSS OF ELONGATION FACTOR GENES 53<br />
Algal strain information is provided as additional material online [see Additional file 5]. All cultures<br />
were grown at 18°C, except Dasycladales, Siphonocladales <strong>and</strong> Derbesia (23°C). Cool white<br />
fluorescent lamps were used for a 12/12 h light/dark cycle. Marine cultures were maintained in f/2<br />
medium <strong>and</strong> freshwater cultures in Bold’s Basal Medium (Andersen 2005).<br />
RNA isolation <strong>and</strong> cDNA library construction <strong>of</strong> Cladophora coelothrix<br />
Total RNA was extracted with a RNeasy Plant Mini Kit (Qiagen Benelux b.v., Venlo, the Netherl<strong>and</strong>s)<br />
or a NucleoSpin® RNA Plant kit (Macherey-Nagel GmbH & Co. KG, Düren, Germany) according to the<br />
manufacturer’s instructions, including a DNase step to eliminate genomic DNA contamination. RNA<br />
quality was checked on a 1 % agarose gel (made with 1x TAE diluted in 0,1 % DEPC water). RNA<br />
concentration <strong>and</strong> purity were measured in a spectrophotometer at 260 <strong>and</strong> 280 nm according to<br />
st<strong>and</strong>ard methods (Sambrook et al. 1989).<br />
Approximately 30 µg <strong>of</strong> total RNA <strong>of</strong> Cladophora coelothrix was extracted as described above. A<br />
st<strong>and</strong>ard cDNA library was constructed by VERTIS Biotechnologie AG (Freising , Germany). An EF-1α<br />
sequence <strong>of</strong> 624 bp was obtained by sequencing r<strong>and</strong>omly picked clones.<br />
Reverse Transcriptase <strong>and</strong> Polymerase Chain Reaction<br />
cDNA construction was performed with the Omniscript RT kit (Qiagen) <strong>and</strong> oligodT primers according<br />
to the manufacturer’s instructions; the reaction was incubated for several hours at 37°C.<br />
Primers were designed to fit the most conserved regions <strong>of</strong> EF-1α <strong>and</strong> EFL sequences across<br />
Viridiplantae. Primers for EF-1α were based upon aligned GenBank sequences from <strong>green</strong> <strong>algae</strong><br />
(Acetabularia <strong>and</strong> Chara) <strong>and</strong> l<strong>and</strong> plants, completed with our Cladophora coelothrix cDNA sequence<br />
(EF-1α-F: 5’-GGC CAT CTT ATC TAC AAG CTT GGC GG-3’ <strong>and</strong> EF-1α-R: 5’-CCA GGA GCA TCA ATC ACG<br />
GTG CAG-3’). EFL primers were adapted from Noble et al. (Noble et al. 2007) (EFL-F: 5’-TCC ATY GTS<br />
ATY TGC GGN CAY GTC GA-3’ <strong>and</strong> EFL-R: 5’-CTT GAT GTT CAT RCC RAC RTT GTC RCC-3’). PCR<br />
amplification was performed with the following reaction mixture: 1 µl <strong>of</strong> cDNA, 2.5 µl <strong>of</strong> 10x Buffer<br />
(Qiagen), 0.5 µl dNTP’s (10 mM), 0.5 µl MgCl (25 mM, Qiagen), 0.5 µl <strong>of</strong> each primer (10 µm), 0.25 µl<br />
BSA (10 µg/µl), 18.125 µl sterilized MilliQ water <strong>and</strong> 0.125 µl Taq polymerase (5 U/µl, Qiagen). The<br />
amplification pr<strong>of</strong>ile consisted <strong>of</strong> an initial denaturation <strong>of</strong> 2 min at 94 °C, followed by 35 cycles <strong>of</strong> 30<br />
s at 94 °C, 30 s at 55 °C <strong>and</strong> 45 s at 72 °C <strong>and</strong> a final extension <strong>of</strong> 10 min at 72 °C. Products <strong>of</strong><br />
expected size (300 bp for EF-1α <strong>and</strong> 900 bp for EFL) were either sequenced directly or cloned <strong>and</strong><br />
sequenced.
54 CHAPTER 3<br />
Cloning <strong>and</strong> sequencing<br />
PCR products were first sequenced with the forward primer with an Applied Biosystems 3130xl.<br />
Sequences were blasted against the GenBank protein database (blastx), to check for potential<br />
bacterial contaminants. Sequences without ambiguous base calls yielding a significant hit for<br />
Viridiplantae were further sequenced with the reverse primer. When ambiguous base calls were<br />
present in sequences, samples were cloned if the rough sequence gave a significant blastx hit for<br />
Viridiplantae. Cloning was performed with the pGEM®-T Vector System (Promega Benelux b.v.,<br />
Leiden, the Netherl<strong>and</strong>s) according to the manufacturer’s instructions. After ligation, transformation<br />
<strong>and</strong> incubation, the white colonies were transferred to 15 µl double distilled water, boiled for 10<br />
minutes to lyse cells <strong>and</strong> subsequently centrifuged to pellet the cells walls <strong>and</strong> allow harvest <strong>of</strong> the<br />
DNA in the liquid phase. Between three <strong>and</strong> five clones were PCR amplified <strong>and</strong> sequenced with the<br />
vector specific primers T7 <strong>and</strong> SP6 following the protocol described above. Cloning showed minor<br />
polymorphisms that most likely represent different alleles.<br />
Alignments <strong>and</strong> phylogenetic analysis <strong>of</strong> EF-1α <strong>and</strong> EFL<br />
Sequences [see Additional file 6] were assembled with AutoAssembler 1.4.0 (ABI Prism, Perkin Elmer,<br />
Foster City, CA, USA) <strong>and</strong> aligned manually for both genes separately, resulting in EF-1α <strong>and</strong> EFL<br />
alignments <strong>of</strong> 1374 <strong>and</strong> 1653 bp, respectively [see Additional file 7]. Sequences generated with our<br />
primers begin in the N-terminal part the <strong>of</strong> the gene <strong>and</strong> are 900 bp for EFL <strong>and</strong> 150-300 bp for EF-<br />
1α. We included eukaryotic EF-1α, eRF3 <strong>and</strong> HBS1 sequences as well as archeabacterial EF-1α<br />
sequences to serve as outgroups for the EFL phylogeny (Keeling <strong>and</strong> Inagaki 2004). Due to the large<br />
divergences between EFL <strong>and</strong> the other genes, Gblocks was run to remove ambiguously aligned<br />
regions (Castresana 2000). We ran Gblocks v.0.91b, allowing smaller final blocks, gap positions within<br />
the final blocks <strong>and</strong> less strict flanking positions, resulting in an alignment <strong>of</strong> 358 amino acids [see<br />
Additional file 7]. The resulting EFL <strong>and</strong> EF-1α alignments were subjected to Bayesian phylogenetic<br />
inference with MrBayes 3.1.2 (Ronquist <strong>and</strong> Huelsenbeck 2003) using the model suggested by<br />
ProtTest 1.4 (Abascal et al. 2005) (WAG with among site rate heterogeneity: gamma distribution<br />
with 8 categories). Two parallel runs, each consisting <strong>of</strong> four incrementally heated chains were run<br />
for 1,000,000 generations, sampling every 1,000 generations. Convergence <strong>of</strong> log-likelihoods was<br />
assessed in Tracer v1.4 (Rambaut <strong>and</strong> Drummond 2007). A burnin sample <strong>of</strong> 100 trees was removed<br />
before constructing the majority rule consensus tree for each <strong>of</strong> the genes. Maximum likelihood<br />
phylogenies were inferred for EF-1α <strong>and</strong> EFL with Treefinder (Jobb 2008). The analyses were based<br />
on amino acid sequences <strong>and</strong> used a WAG model with among site rate heterogeneity (gamma<br />
distribution with 8 categories). One thous<strong>and</strong> non-parametric bootstrap trees were inferred.<br />
Bootstrap values were summarized with consense from the Phylip package (Felsenstein 2005) <strong>and</strong><br />
plotted onto the Bayesian consensus tree.<br />
<strong>Phylogeny</strong> <strong>of</strong> the <strong>green</strong> plants: SSU rDNA, rbcL <strong>and</strong> atpB<br />
A reference phylogeny <strong>of</strong> <strong>green</strong> plants for which the presence <strong>of</strong> EF-1α or EFL is known was<br />
constructed using three commonly used phylogenetic markers: nuclear SSU rDNA <strong>and</strong> plastid atpB
GAIN AND LOSS OF ELONGATION FACTOR GENES 55<br />
<strong>and</strong> rbcL genes <strong>and</strong> rooted with red <strong>algae</strong> <strong>and</strong> a glaucophyte. To obtain an even species distribution<br />
<strong>and</strong> consequently a better phylogenetic tree (Zwickl <strong>and</strong> Hillis 2002), many additional species were<br />
included in the phylogenetic analysis [see Additional file 7]. Sequences were retrieved from GenBank<br />
<strong>and</strong> aligned with our own sequences [see Additional file 6]. DNA was extracted using a st<strong>and</strong>ard CTAB<br />
method. PCR conditions followed st<strong>and</strong>ard protocol. Primers were based on other publications: SSU<br />
rDNA (Zechman et al. 1990, Lewis <strong>and</strong> Lewis 2005), rbcL (Hanyuda et al. 2000) <strong>and</strong> atpB (Wolf 1997,<br />
Karol et al. 2001). The rbcL <strong>and</strong> atpB sequences were aligned by eye. The SSU rDNA sequences were<br />
aligned based on their RNA secondary structure with DCSE [see Additional file 8].<br />
The model selection procedure [see Additional file 8] proposed eight partitions: atpB <strong>and</strong> rbcL genes<br />
were partitioned into codon positions (6 partitions) <strong>and</strong> the SSU rDNA was partitioned into RNA<br />
loops <strong>and</strong> stems (2 partitions). Bayesian phylogenetic inference was carried out using a GTR model<br />
with gamma distribution <strong>and</strong> 8 rate categories per partition (all parameters unlinked) <strong>and</strong> rate<br />
multipliers to accommodate rate differences among partitions. Two parallel runs, each consisting <strong>of</strong><br />
four incrementally heated chains were run for 5,000,000 generations, sampling every 1,000<br />
generations. Convergence <strong>of</strong> log-likelihoods was assessed in Tracer v1.4 (Rambaut <strong>and</strong> Drummond<br />
2007). A burnin sample <strong>of</strong> 3,000 trees was removed before constructing the majority rule consensus<br />
tree. A maximum likelihood phylogeny was inferred with Treefinder (Jobb 2008). The analysis used a<br />
GTR model with among site rate heterogeneity (gamma distribution with 8 categories). One<br />
thous<strong>and</strong> non-parametric bootstrap trees were inferred. Bootstrap values were summarized with<br />
consense from the Phylip package (Felsenstein 2005) <strong>and</strong> plotted onto the Bayesian consensus tree.<br />
To obtain trees suitable for modeling gene gain <strong>and</strong> loss, the Bayesian consensus tree <strong>and</strong> the<br />
complete post-burnin set <strong>of</strong> trees were pruned to the set <strong>of</strong> species for which the type <strong>of</strong> elongation<br />
factor is known using the APE package (Paradis et al. 2004). Because our data deviate from the<br />
<strong>molecular</strong> clock, we performed rate smoothing to obtain branch lengths that are roughly<br />
proportional to time. We used the penalized likelihood method (S<strong>and</strong>erson 2002) implemented in<br />
the r8s program (S<strong>and</strong>erson 2003), with a log-additive penalty <strong>and</strong> a smoothing value <strong>of</strong> 2, which was<br />
the optimal value in cross-validation (S<strong>and</strong>erson 2002). PL rate smoothing was applied to the<br />
Bayesian consensus tree as well as the post-burnin set <strong>of</strong> MCMC trees.<br />
Modeling gene gain <strong>and</strong> loss<br />
If the presence <strong>of</strong> EF-1α <strong>and</strong> EFL are coded as two binary characters, their gain-loss dynamics can be<br />
modeled along a reference phylogeny using a continuous-time Markov model. Given the likely<br />
dependency <strong>of</strong> gain <strong>and</strong> loss between EF-1α <strong>and</strong> EFL, a model designed to study interdependent trait<br />
<strong>evolution</strong> was used (Pagel 1994). The rate matrix <strong>of</strong> this model is given by:<br />
Q<br />
D<br />
0,<br />
0<br />
0,<br />
1<br />
1,<br />
0<br />
1,<br />
1<br />
q<br />
q<br />
0,<br />
0 0,<br />
1 1,<br />
0 1,<br />
1<br />
q q 0<br />
21<br />
31<br />
0<br />
q<br />
12<br />
0<br />
42<br />
q<br />
13<br />
0<br />
43<br />
q<br />
q<br />
24<br />
34<br />
(1)
56 CHAPTER 3<br />
where (0,0) indicates the absence <strong>of</strong> both genes from the genome, (0,1) <strong>and</strong> (1,0) denote the<br />
presence <strong>of</strong> EFL <strong>and</strong> EF-1α, respectively, <strong>and</strong> (1,1) is the state where both genes are present in the<br />
genome. Different q's indicate relative rates <strong>of</strong> the respective changes in gene content. Transitions<br />
that require more than one event (e.g. 1,0 → 0,1) are not allowed to occur as a single step in this<br />
model, the logic being that the probability <strong>of</strong> two traits changing at exactly the same time is<br />
negligible. This is consistent with the fact that transitions from EF-1α to EFL <strong>and</strong> vice versa should<br />
pass through a stage where both genes are present in the genome. The elements <strong>of</strong> the diagonal are<br />
determined by the requirement that each row sums to zero. Because the absence <strong>of</strong> both genes is<br />
likely to be lethal, the matrix was constrained by introducing a series <strong>of</strong> very low rates as follows:<br />
Q<br />
D<br />
10<br />
10<br />
-6<br />
-6<br />
0<br />
10<br />
l<br />
0<br />
EF1<br />
-6<br />
10<br />
l<br />
0<br />
6<br />
EFL<br />
g<br />
g<br />
0<br />
EF1α<br />
EFL<br />
(2)<br />
In this matrix, gEF1α <strong>and</strong> gEFL denote gain rates <strong>and</strong> lEF1α <strong>and</strong> lEFL loss rates. It must be noted that the<br />
model does not take gene duplications into account because our data provided no indications for the<br />
presence <strong>of</strong> such events.<br />
The rate matrix (2) was specified as a special case <strong>of</strong> the "discrete dependent" model in BayesTraits<br />
(Pagel <strong>and</strong> Meade 2006). The model parameters were estimated by maximum likelihood (ML)<br />
optimization, using a dataset <strong>of</strong> presence-absence patterns <strong>of</strong> EF-1α <strong>and</strong> EFL. One hundred<br />
optimization attempts were carried out to find the ML solution. Ancestral state probabilities were<br />
calculated using the addNode comm<strong>and</strong>. The reference phylogeny used for inferring patterns <strong>of</strong> gain<br />
<strong>and</strong> loss was derived from the Bayesian analysis <strong>of</strong> SSU nrDNA, rbcL <strong>and</strong> atpB, <strong>and</strong> was varied as<br />
follows. First, the majority rule consensus tree provided by MrBayes was used. Second, a ratesmoothed<br />
version <strong>of</strong> this consensus tree was used to have branch lengths roughly proportional to<br />
<strong>evolution</strong>ary time. Third, topological uncertainty was introduced in the analysis by repeating analyses<br />
on the entire post-burnin set <strong>of</strong> MCMC trees after they had been rate-smoothed. For the analysis on<br />
MCMC trees, ancestral state probabilities were calculated with the addMRCA instead <strong>of</strong> the addNode<br />
comm<strong>and</strong>. Rate estimates <strong>and</strong> ancestral state probabilities were averaged across the MCMC trees.<br />
We opted not to use BayesTraits' Bayesian inference because we found its output to be strongly<br />
influenced by prior settings.<br />
In addition to these analyses, several specific hypotheses about ancestral genome content (EFL, EF-<br />
1α or both) were compared using ML optimization on the rate-smoothed reference tree. Constraints<br />
on ancestral genome content were placed on 5 ancestral nodes with the fossil comm<strong>and</strong> in<br />
BayesTraits, resulting in 3 5 = 243 hypotheses for which the log-likelihoods could be compared. Only<br />
hypotheses within two log-likelihood units from the ML solution were retained for interpretation.<br />
This set <strong>of</strong> hypotheses can be seen as a confidence set because two log-likelihood units is considered<br />
a significance threshold for such analyses (Pagel 1999).<br />
The BayesTraits output was mapped onto the trees with TreeGradients v1.02 (Verbruggen 2008).<br />
This program plots ancestral state probabilities on a phylogenetic tree as colors along a color<br />
gradient.
Authors' contributions<br />
GAIN AND LOSS OF ELONGATION FACTOR GENES 57<br />
EC, ODC, HV <strong>and</strong> KS designed the study. EC carried out lab work. EC <strong>and</strong> FL maintained algal cultures<br />
<strong>and</strong> performed sequence alignment. EC <strong>and</strong> HV analyzed data <strong>and</strong> drafted the manuscript. FWZ<br />
provided atpB sequences. All authors revised <strong>and</strong> approved the final manuscript.<br />
Acknowledgements<br />
We thank Barbara Rinkel, Hervé Moreau, Tatiana Klotchkova, Wytze Stam <strong>and</strong> Jeanine Olsen for<br />
providing cultures, Caroline Vlaeminck for assisting with the <strong>molecular</strong> work, Klaus Valentin for cDNA<br />
library services, Tom Degroote <strong>and</strong> Wim Gillis for IT support. We thank two anonymous referees for<br />
their constructive criticisms on a previous version <strong>of</strong> the manuscript. This research was funded by a<br />
BOF grant (Ghent University) to EC <strong>and</strong> FWO-Fl<strong>and</strong>ers funding to HV, FL <strong>and</strong> ODC. Phylogenetic<br />
analyses were carried out on the KERMIT computing cluster (Ghent University) <strong>and</strong> the<br />
Computational Biology Service Unit (Cornell University <strong>and</strong> Micros<strong>of</strong>t Corporation).
58 CHAPTER 3<br />
Additional files<br />
Additional file 1
Additional file 2<br />
GAIN AND LOSS OF ELONGATION FACTOR GENES 59
60 CHAPTER 3<br />
Additional file 3
Additional file 4<br />
GAIN AND LOSS OF ELONGATION FACTOR GENES 61
62 CHAPTER 3<br />
Additional file 5<br />
Table S1. Algal strain information.<br />
Chlorophyta<br />
Ulvophyceae<br />
Ulvales<br />
number Culture collection<br />
Acrochaete repens E093db Barbara Rinkel (Natural History Museum, London)<br />
Bolbocoleon piliferum E344pc Barbara Rinkel (Natural History Museum, London)<br />
Ulva fenestrata EE2 <strong>and</strong> EE6 Field collection at Goese Sas (Netherl<strong>and</strong>s)<br />
Ulva intestinalis EE3 Field collection at Goese Sas (Netherl<strong>and</strong>s)<br />
Ignatius-clade<br />
Ignatius tetrasporus B 2012 UTEX culture collection <strong>of</strong> <strong>algae</strong> (University <strong>of</strong> Texas at Austin, USA)<br />
Trentepohliales<br />
Trentepohlia aurea 483-1 Sammlung von Algenkulturen (University <strong>of</strong> Göttingen, Germany)<br />
Bryopsidales<br />
Blastophysa rhizopus LB 1029 UTEX culture collection <strong>of</strong> <strong>algae</strong> (University <strong>of</strong> Texas at Austin, USA)<br />
Bryopsis sp. EE4 Field collection at Goese Sas (Netherl<strong>and</strong>s)<br />
Codium sp HEC 15711 Field collection in Madeira<br />
Derbesia sp. 2773-1 Tatiana Klotchkova (Kongju National University, Korea)<br />
Ostreobium quekettii 6.99 Sammlung von Algenkulturen (University <strong>of</strong> Göttingen, Germany)<br />
Dasycladales<br />
Acetabularia acetabulum LB 2694 UTEX culture collection <strong>of</strong> <strong>algae</strong> (University <strong>of</strong> Texas at Austin, USA)<br />
Bornetella sphaerica LB 2690 UTEX culture collection <strong>of</strong> <strong>algae</strong> (University <strong>of</strong> Texas at Austin, USA)<br />
Siphonocladales<br />
Chlorophyceae<br />
Trebouxiophyceae<br />
Prasinophyceae<br />
Streptophyta<br />
Boodlea composita Bcomp4, BoTTd75 Jeanine Olsen <strong>and</strong> Wytze Stam (University <strong>of</strong> Groningen, Netherl<strong>and</strong>s)*<br />
Cladophora coelothrix Ccoel2, C83.14 Jeanine Olsen <strong>and</strong> Wytze Stam (University <strong>of</strong> Groningen, Netherl<strong>and</strong>s)*<br />
Dictyosphaeria cavernosa Dcav3, D.cavSJ25b Jeanine Olsen <strong>and</strong> Wytze Stam (University <strong>of</strong> Groningen, Netherl<strong>and</strong>s)*<br />
Ernodesmis verticillata Erno4, EvVGa88 Jeanine Olsen <strong>and</strong> Wytze Stam (University <strong>of</strong> Groningen, Netherl<strong>and</strong>s)*<br />
Phyllodictyon orientale Struv1, West 1631 John West (University <strong>of</strong> Melbourne, Australia)<br />
Valonia utricularis Vutric2, VU1546 Jeanine Olsen <strong>and</strong> Wytze Stam (University <strong>of</strong> Groningen, Netherl<strong>and</strong>s)*<br />
Chlamydomonas reinhardtii CC1690 Chlamydomonas Center (Duke University, USA)<br />
Scenedesmus obliquus 1450 UTEX culture collection <strong>of</strong> <strong>algae</strong> (University <strong>of</strong> Texas at Austin, USA)<br />
Chlorella kessleri 211-11g Sammlung von Algenkulturen (University <strong>of</strong> Göttingen, Germany)<br />
Tetraselmis striata 41.85 Sammlung von Algenkulturen (University <strong>of</strong> Göttingen, Germany)<br />
Ostreococcus tauri OTH95 Hervé Moreau (Observatoire Océanologique de Banyuls)<br />
Nephroselmis olivacea 40.89 Sammlung von Algenkulturen (University <strong>of</strong> Göttingen, Germany)<br />
Chlorokybus atmophyticus 48.80 Sammlung von Algenkulturen (University <strong>of</strong> Göttingen, Germany)<br />
Entransia fimbriata LB 2793 UTEX culture collection <strong>of</strong> <strong>algae</strong> (University <strong>of</strong> Texas at Austin, USA)<br />
Spirogyra sp. 169.80 Sammlung von Algenkulturen (University <strong>of</strong> Göttingen, Germany)<br />
*now maintained in the <strong>Phycology</strong> Research Group, Ghent University
Additional file 6<br />
Table S2. GenBank accession numbers or DOE Joint Genome Institute (JGI) transcript identifiers for nucleotide sequences <strong>of</strong> atpB, rbcL, SSU rDNA, EF-1α <strong>and</strong> EFL. Newly<br />
generated sequences are in boldface. GenBank accession numbers for protein sequences <strong>of</strong> eRF3 (C<strong>and</strong>ida maltosa BAB12681, Homo sapiens NP_002085, Nicotiana<br />
tabacum AAA79032, Saccharomyces cerevisiae EDN60510), HBS1 (Arabidopsis thaliana NP_196625, Homo sapiens NP_006611, Saccharomyces cerevisiae NP_01301) <strong>and</strong><br />
archaebacterial EF-1α (Sulfolobus sulfataricus CAA50033, Termoplasma acidophilum P19486) are given here between brackets.<br />
atpB rbcL SSU rDNA EF-1α EFL<br />
Chlorophyta<br />
Ulvophyceae<br />
Ulotrichales<br />
Halochlorococcum moorei AY198122<br />
Ulothrix zonata Z47999<br />
Ulvales<br />
Acrochaete repens FJ715715 FJ715684 FJ715704<br />
Bolbocoleon piliferum FJ715716 AY205330 FJ715705<br />
Pseudendoclonium akinetum NC 008114 NC 008114 DQ011230<br />
Ulva fenestrata AF499668 EF551331/ FJ715706<br />
Ulva intestinalis AY422552 AJ000040 EF551324/ FJ715707<br />
Ignatius-clade<br />
Ignatius tetrasporus AB110439 FJ715687<br />
Oltmannsiellopsidales<br />
Oltmanssiellopsis viridis NC 008099 NC 008099 D86495<br />
Bryopsidales<br />
Blastophysa rhizopus FJ715688<br />
Bryopsis spp FJ480417 (B. plumosa) FJ715718 FJ715685 (B. plumosa) FJ715689<br />
Caulerpa spp FJ480415 (C. prolifera) AF479703 (C. sertularioides)<br />
Codium spp FJ715686 (C. platylobium) FJ715690<br />
Derbesia sp. FJ715691<br />
Halimeda spp FJ480416 (H. discoidea) FJ715719 (H. incrassate) AY786526 (H. gracilis)<br />
Ostreobium quekettii FJ715720 FJ715692<br />
Dasycladales<br />
Acetabularia spp FJ480413 (A. dentata) FJ715714 (A. acetabulum) Z33461 (A. acetabulum) EF551321/ FJ715693 (A. acetabulum)<br />
Bornetella spp FJ480414 (B. nitida) FJ715717 (B. sphearica) Z33464 (B. nitida) FJ715694 (B. sphearica)<br />
Siphonocladales<br />
Boergesenia forbesii AM498746<br />
Boodlea composita AF510157 FJ715695<br />
Cladophora albida Z35317<br />
Cladophora coelothrix Z35315 FJ715696<br />
Dictyosphaeria cavernosa AM498756 FJ715697
atpB rbcL SSU rDNA EF-1α EFL<br />
Ernodesmis verticillata AM498757 FJ715698<br />
Phyllodictyon spp AF510163 (P. pulcherrimum) FJ715699<br />
Siphonocladus tropicus AM498761<br />
Struvea plumosa AF510161<br />
Valonia utricularis Z35323 FJ715700<br />
Trentepohliales<br />
Trentepohlia aurea FJ715722 AB110783<br />
Chlorophyceae<br />
Chlamydomonas incerta DQ122889<br />
Chlamydomonas reinhardtii NC 005353 NC 005353 M32703 DS496185/ FJ715708<br />
Chlorococcum echinozygotum EF113500 EF113430 U57698 EF551323<br />
Cylindrocapsa geminella EF119849 EF113434 AF387159<br />
Oedogonium cardiacum EF113523 EF113458 U83133<br />
Paulschulzia pseudovolvox AB014040 D86837 U83120<br />
Pleodorina spp AB214424 (P. starrii) D86834( P.indica) AB095178 (P. sp.)<br />
Scenedesmus obliquus NC008101 NC008101 X56103 SOL00000077/ FJ715709<br />
Sphaeroplea robusta EF113536 EF113472 U73472<br />
Stigeoclonium helveticum NC 008372 NC 008372 U83131<br />
Tetraspora sp. EF113540 EF113477 U83121<br />
Uronema belkae EF113544 EF113481 AF182821<br />
Trebouxiophyceae<br />
Chlorella spp NC 001865 (C. vulgaris) NC 001865 (C. vulgaris) X13688 (C. vulgaris) FJ715710 (C. kessleri)<br />
Closteriopsis acicularis EF113502 EF113433 Y17470<br />
Helicosporidium sp. AY729488<br />
Oocystis spp EF113524 (O. apiculata) EF113549 (O. apiculata) AF228686 (O. solitaria)<br />
Prototheca wickerhamii AJ245645 PWL00000297<br />
Trebouxia magna EF113541 AJ969630 Z21552<br />
Prasinophyceae<br />
Chlorodendrales<br />
Tetraselmis spp DQ173248 (T. suecica) DQ173247 (T. suecica) X70802 (T. striata) EF551330 (T. tetrathele)<br />
FJ715711 (T. striata)<br />
Mamiellales<br />
Micromonas pusilla AY955031 AJ010408 EF551325<br />
Ostreococcus lucimarinus XM 001420948<br />
Ostreococcus tauri NC 008289 NC 008289 AY329635 CR954213/ FJ715713<br />
Pseudoscourfieldiales<br />
Nephroselmis olivacea NC 00927 NC 00927 X74754 FJ715712<br />
Streptophyta<br />
Mesostigmatales<br />
Mesostigma viride NC 002186 NC 002186 AJ250109 DQ394295
atpB rbcL SSU rDNA EF-1α EFL<br />
Chlorokybales<br />
Chlorokybus atmophyticus DQ422812 DQ422812 M95612 FJ715701<br />
Klebsormidiales<br />
Entransia fimbriata AY823688 E88 slordig LB2793 FJ715702<br />
Klebsormidium flaccidum AF408801 E87 rbcL2 X75520<br />
Zygnematales<br />
Gonatozygon spp AF408796 (G. monotaenium) U71438 (G. monotaenium) X91346 (G. aculeatum)<br />
Spirogyra spp AF408797 S. maxima FJ715721 (S. sp.) EF551328/ FJ715703<br />
Staurastrum punctulatum NC 008116 NC 008116 AF115442<br />
Zygnema spp NC 008117 (Z. circumcarin) NC 008117 (Z. circumcarin) AJ853450 (Z. pseudogedeanum)<br />
Coleochaetales<br />
Chaetosphaeridium globosum NC 004115 NC 004115 AF113506<br />
Coleochaete scutata AY082303 AY082313 X68825<br />
Charales<br />
Chara spp AF408782 (C. connivens) L13476 (C. connivens) U18493 (C. connivens) EF551322 (C. australis)<br />
Nitella flexilis AB110837 AB076056 U05261<br />
Embryophyta (l<strong>and</strong> plants)<br />
Anthoceratophyta (Hornworts)<br />
Anthoceros spp NC 004543 (A. formosa) NC 004543 (A. formosa) X80984 (A. agrestis)<br />
Marchantiophyta (Liverworts)<br />
Marchantia polymorpha NC 001319 NC 001319 AB021684<br />
Bryophyta (Mosses)<br />
Physcomitrella patens AP005672 AB066207 XM 001753007<br />
Spermatophyta (Seed plants)<br />
Actinidia spp AJ235382 (A. chinensis) L01882 (A. chinensis) U42495 (A. sp.) AY946009 (A. deliciosa)<br />
Arabidopsis thaliana NC 000932 NC 000932 AC006837 AK230352<br />
Cichorium intybus L13652 AY378166<br />
Oryza sativa AC092750 AJ746297 X00755 AF030517<br />
Triticum aestivum NC 002762 NC 002762 AY049040 M90077<br />
Vicia faba AJ222579<br />
other eukaryotes<br />
Archaeplastida<br />
Glaucocystophyta<br />
Cyanophora paradoxa NC 001675 NC 001675 AY823716 AF092951<br />
Rhodophyta<br />
Bangiophyceae<br />
Porphyra yezoensis AP006715 D79976 U08844<br />
Porphyridium aerugineum AJ421145<br />
Cyanidiophyceae<br />
Cyanidioschyzon merolae AB002583 AB158485 AB095182
atpB rbcL SSU rDNA EF-1α EFL<br />
Cyanidium caldarium X66698 AB091232<br />
Florideophyceae<br />
Chondrus crispus CCU02984 Z14140 CO652990 - CO652099- CO652788<br />
Gracilaria spp AY673996 (G. tenuistipitata) AY673996 (G. tenuistipitata) L26210 (G. verrucosa) DV963090 - DV963156 - DV964877 (G.<br />
changii)<br />
Chromalveolates<br />
Apicomplexans<br />
Plasmodium falciparum X60488<br />
Ciliates<br />
Tetrahymena pyriformis D11083<br />
Tetrahymena thermophila XM 001032213<br />
Cryptophytes<br />
Goniomonas amphinema AB332031<br />
Guillardia theta AM183813<br />
Rhodomonas salina DQ659244<br />
diatoms<br />
Ditylum brightwellii AB368772<br />
Phaeodactylum tricornutum 18475 (JGI, v2.0)<br />
Skeletonema costatum AB368773<br />
Thalassionema nitzschioides AB368774<br />
Thalassiosira pseudonana 3858 (JGI, v3.0) 41829 (JGI, v3.0)<br />
Din<strong>of</strong>lagellates<br />
Heterocapsa triquetra AY729485<br />
Karlodinium micrum EF134135<br />
Oxyrrhis marina DQ659243<br />
Haptophytes<br />
Emiliania huxleyi CV068986<br />
Isochrysis galbana AY729486<br />
Pavlova lutheri AY729487<br />
Heterokonts<br />
Oomycetes<br />
Phytophthora infestans AJ249839<br />
Opisthokonts<br />
Fungi<br />
Allomyces macrogynus EC637105<br />
Blastocladiella emersonii EF064246<br />
Mucor racemosus MRATEF1A<br />
Saccharomyces martiniae AF402021<br />
Metazoa (Animals)<br />
Homo sapiens NM 001958
atpB rbcL SSU rDNA EF-1α EFL<br />
choan<strong>of</strong>lagellates<br />
Monosiga brevicollis XM_001745603<br />
Sphaer<strong>of</strong>orma arctica DQ403164<br />
Excavates<br />
Diplomonads<br />
Giardia intestinalis D14342<br />
Giardia lamblia XM 76292<br />
Euglenids<br />
Euglena gracilis X16890<br />
Parabasalids<br />
Trichomonas tenax D78479<br />
Trichomonas vaginalis XM 001325448<br />
Kinoplastids<br />
Leishmania braziliensis XM 001563727<br />
Amoebozoa<br />
Entamoeba histolytica ENHEF1ALPH<br />
Rhizaria<br />
Cercozoa<br />
Bigelowiella natans AY729489<br />
Foraminifera<br />
Planoglabratrella opecularis AB334123<br />
Centrohelids<br />
Raphidiophrys contractilis AB332032
68 CHAPTER 3<br />
Additional file 7<br />
Nexus file <strong>of</strong> EF-1α, EFL, GBlocks stripped EFL <strong>and</strong> SSU-rbcL-atpB alignments<br />
Additional file 8<br />
SSU rDNA alignment <strong>and</strong> partitioning<br />
The SSU rDNA sequences were aligned on the basis <strong>of</strong> their rRNA secondary structure information<br />
using the following procedure. The SSU rDNA sequences <strong>of</strong> several <strong>green</strong> plant representatives<br />
incorporated in the European Ribosomal RNA Database (Wuyts et al. 2004,<br />
http://www.psb.ugent.be/rRNA/) were used as an initial model for building the alignment. The<br />
alignment editor DCSE v2.6 (De Rijk <strong>and</strong> De Wachter 1993) was used to annotate <strong>and</strong> check the<br />
secondary structure, <strong>and</strong> manually align the sequences. For the newly generated sequences, the<br />
alignment <strong>of</strong> the highly variable helices 43 <strong>and</strong> 49 (see De Rijk et al. 1999 for secondary structure<br />
nomenclature <strong>of</strong> the SSU gene) was refined <strong>and</strong> aided by folding the RNA sequences using mfold<br />
v.3.2 with default temperature <strong>and</strong> RNA parameters (Zuker 2003, http://mfold.bioinfo.rpi.edu/).<br />
Finally, we used the Xstem s<strong>of</strong>tware (Telford et al. 2005) to extract the RNA secondary structure<br />
information from DCSE to a nexus format with stem/loop partitions.<br />
Model selection procedure<br />
Selection <strong>of</strong> a suitable partitioning strategy <strong>and</strong> suitable models for the partitions followed a threestep<br />
procedure <strong>and</strong> uses the Akaike Information Criterion (AIC) as a selection criterion. The guide<br />
tree used during the entire procedure was obtained by MP analysis <strong>of</strong> the concatenated data using<br />
PAUP* 4.0b10 (Sw<strong>of</strong>ford 2002). All subsequent likelihood optimizations <strong>and</strong> AIC calculations were<br />
carried out with Treefinder (Jobb et al. 2004). The first step consisted <strong>of</strong> optimizing the likelihood for<br />
nine potential partitioning strategies, assuming a HKY+G8 model for each partition. The three<br />
partitioning strategies with the lowest AIC scores (i.e., those providing the best fit to the data) were<br />
retained for further evaluation. The second step involved model selection for individual partitions.<br />
The likelihood <strong>of</strong> each partition present in the three retained partitioning strategies was optimized<br />
for three variants <strong>of</strong> the general time reversible model (F81, HKY <strong>and</strong> GTR), with <strong>and</strong> without<br />
inclusion <strong>of</strong> a discrete gamma distribution (eight categories) to model among-site rate heterogeneity.<br />
Because not all genes were sampled for all taxa, the guide tree was pruned to the taxa present in the<br />
partition in question before each optimization. The partition-specific models obtaining the lowest AIC<br />
score were passed on to the third step, which consisted <strong>of</strong> re-evaluation <strong>of</strong> the three partitioning<br />
strategies retained from the first step using the models selected for these partitions in the second<br />
step. The partitioning strategy + model combination that received the lowest AIC score in the third<br />
step was used in the phylogenetic analyses documented in the main text.
4<br />
Complex phylogenetic distribution <strong>of</strong> a non-canonical genetic code<br />
in <strong>green</strong> <strong>algae</strong><br />
Ellen Cocquyt 1 , Gillian H. Gile 2 , Frederik Leliaert 1 , Heroen Verbruggen 1 , Patrick Keeling 2 <strong>and</strong> Olivier De<br />
Clerck 1<br />
1 <strong>Phycology</strong> Research Group <strong>and</strong> Center for Molecular Phylogenetics <strong>and</strong> Evolution, Ghent University,<br />
Krijgslaan 281 S8, 9000 Ghent, Belgium<br />
2 Canadian Institute for Advanced Research, Department <strong>of</strong> Botany, University <strong>of</strong> British Columbia,<br />
Vancouver, V6 T 1Z4 Canada<br />
Abstract<br />
A non-canonical code, in which TAG <strong>and</strong> TAA have been reassigned from stop codons to glutamine,<br />
has previously been reported for the <strong>green</strong> algal orders Dasycladales. This study demonstrates that<br />
the Dasycladales share an identical alternative genetic code with the related clade Trentepohliales<br />
<strong>and</strong> the genus Blastophysa, but not with its sister clade the Bryopsidales. A single transition to the<br />
non-canonical code followed by a reversal to the canonical code in the Bryopsidales is highly<br />
improbable due to the pr<strong>of</strong>ound genetic changes that coincide with codon reassignment. Multiple<br />
independent gains <strong>of</strong> the non-canonical code are not very plausible because a single type <strong>of</strong> noncanonical<br />
code evolved in some closely related ulvophyte lineages. Instead we favor a stepwise<br />
acquisition model, congruent with the ambiguous intermediate theory, whereby the alternative<br />
codes observed in these <strong>green</strong> algal orders share a single origin. The transition from a canonical to a<br />
non-canonical code has been completed only in the Trentepohliales, Dasycladales, Cladophorales <strong>and</strong><br />
Blastophysa. This transition process, however, has not been completed in the Bryopsidales <strong>and</strong><br />
hence no codon reassignment has taken place.<br />
Keywords<br />
non-canonical genetic code, glutamine, Chlorophyta, Ulvophyceae, stop codon, genome <strong>evolution</strong>
70 CHAPTER 4<br />
Introduction<br />
The genetic code, which translates nucleotide triplets (codons) into amino acids, is one <strong>of</strong> the most<br />
highly conserved features in living organisms. The genetic code is universal in nearly all genetic<br />
systems, including viruses, bacteria, archaebacteria, eukaryotic nuclei <strong>and</strong> organelles. However, a<br />
small number <strong>of</strong> eubacterial, eukaryotic nuclear, plastid, <strong>and</strong> mitochondrial genomes have evolved<br />
slight variations on this st<strong>and</strong>ard or canonical genetic code (Jukes <strong>and</strong> Osawa 1993, Knight et al.<br />
2001). Various models have been proposed to explain the <strong>evolution</strong>ary changes <strong>of</strong> the genetic code,<br />
including codon capture <strong>and</strong> ambiguous intermediate models (reviewed in Knight et al. 2001, Santos<br />
et al. 2004). Only five lineages <strong>of</strong> eukaryotes are known to have evolved non-canonical nuclear<br />
genetic codes, including ciliates, hexamitid diplomonads, fungi in the genus C<strong>and</strong>ida <strong>and</strong> many<br />
Ascomycetes, polymastigid oxymonads <strong>and</strong> dasycladalean <strong>green</strong> <strong>algae</strong> (reviewed in Knight et al.<br />
2001, Keeling <strong>and</strong> Le<strong>and</strong>er 2003, de Koning et al. 2008).<br />
By far the most common change to the genetic code in nuclear genomes is the reassignment <strong>of</strong> stop<br />
codons TAG <strong>and</strong> TAA to glutamine. This has happened independently in at least four eukaryotic<br />
lineages, including hexamitid diplomonads (Keeling <strong>and</strong> Doolittle 1996, Kolisko et al. 2008), some<br />
ciliates (Horowitz <strong>and</strong> Gorovsky 1985, Hanyu et al. 1986), polymastigid oxymonads (Keeling <strong>and</strong><br />
Le<strong>and</strong>er 2003, de Koning et al. 2008) <strong>and</strong> dasycladalean <strong>green</strong> <strong>algae</strong> (Schneider et al. 1989, Schneider<br />
<strong>and</strong> de Groot 1991). Interestingly, this particular non-canonical code has never evolved in<br />
prokaryotes or organelles. This bias towards reassignment <strong>of</strong> the stop codons TAG <strong>and</strong> TAA to<br />
encode glutamine in eukaryotes has been attributed to differences in the translation termination<br />
apparatus, tRNAs <strong>and</strong> tRNA synthetases, <strong>and</strong> mutation frequencies (Knight et al. 2001, Keeling <strong>and</strong><br />
Le<strong>and</strong>er 2003). Knowledge about the frequency <strong>and</strong> distribution <strong>of</strong> non-canonical codes across the<br />
branches <strong>of</strong> the tree <strong>of</strong> life will enable a better underst<strong>and</strong>ing <strong>of</strong> the <strong>evolution</strong> <strong>of</strong> genetic codes<br />
(Keeling <strong>and</strong> Le<strong>and</strong>er 2003).<br />
The aim <strong>of</strong> the present study is to extend our knowledge <strong>of</strong> the phylogenetic distribution <strong>of</strong> the noncanonical<br />
genetic code in <strong>green</strong> <strong>algae</strong>, with emphasis on the ulvophycean relatives <strong>of</strong> the<br />
Dasycladales. Our approach consists <strong>of</strong> screening <strong>green</strong> algal nuclear genes for the presence <strong>of</strong> noncanonical<br />
glutamine codons <strong>and</strong> interpreting the <strong>evolution</strong> <strong>of</strong> the genetic code <strong>and</strong> glutamine codon<br />
usage in a phylogenetic framework.<br />
Methods<br />
Polymerase Chain Reaction <strong>and</strong> sequencing<br />
Total RNA was extracted from 43 taxa representing the major lineages <strong>of</strong> the Viridiplantae as<br />
described previously (Cocquyt et al. submitted). Portions <strong>of</strong> seven nuclear genes (actin, GPI, GapA,<br />
OEE1, 40S ribosomal protein S9 <strong>and</strong> 60S ribosomal proteins L3 <strong>and</strong> L17) were amplified, cloned when<br />
necessary <strong>and</strong> sequenced as described in Cocquyt et al. (submitted). A histone gene was amplified<br />
using the same PCR conditions with an annealing temperature <strong>of</strong> 55°C. The primers were based on a<br />
Cladophora coelothrix cDNA sequence aligned with GenBank sequences from <strong>green</strong> <strong>algae</strong> <strong>and</strong> l<strong>and</strong><br />
plants (His-F: 5’-ATG GCI CGT ACI AAG CAR AC-3’ <strong>and</strong> His-R: 5’-GGC ATG ATG GTS ACS CGC TT-3’). In
NON-CANONICAL GENENTIC CODE 71<br />
addition, total RNA was extracted from Ignatius tetrasporus <strong>and</strong> the bryopsidalean species Caulerpa<br />
cf. racemosa as described previously (Gile et al. 2009). Portions <strong>of</strong> actin, -tubulin, <strong>and</strong> HSP90 genes<br />
including the stop codon were amplified from these taxa by 3’ RACE using the First Choice RLM-RACE<br />
kit (Ambion) using nested degenerate primers (actin-F: 5’-TAC GAA GGA TAC GCA CTN CCN-3’ C <strong>and</strong><br />
actin-R: 5’- GAG ATC GTG CGN GAY ATH AAR GA-3’; β-tubulin-F: 5’-GAT AAC GAG GCT CTN TAY GAY<br />
ATH TG-3’ <strong>and</strong> β-tubulin-R: 5’-CCT TTC CGA CGG CTN CAY TTY TT-3’; HSP90-F: 5’-ATG GTC GAT CCN<br />
ATH GAY GAR TA-3’ <strong>and</strong> 5’-GCT AAG ATG GAG MGN ATH ATG AA-3’).<br />
Genetic codes<br />
The presence <strong>of</strong> a non-canonical code in <strong>green</strong> algal taxa was detected by screening alignments <strong>of</strong><br />
nuclear genes for apparent stop codons at positions coding for glutamine in other <strong>green</strong> plant taxa<br />
<strong>and</strong> by the presence <strong>of</strong> only TGA as a functional stop codon at the predicted 3’ end <strong>of</strong> genes. The<br />
presence <strong>of</strong> the st<strong>and</strong>ard code is confirmed by the presence <strong>of</strong> only canonical glutamine codons <strong>and</strong><br />
the use <strong>of</strong> all three stop codons at the predicted end <strong>of</strong> genes.<br />
Molecular phylogenetics<br />
We constructed a reference phylogeny <strong>of</strong> the Viridiplantae based on the analysis <strong>of</strong> multiple genes as<br />
described in Cocquyt et al. (submitted) to study the phylogenetic occurrence <strong>of</strong> the st<strong>and</strong>ard <strong>and</strong><br />
non-canonical genetic code. The phylogenetic analysis was carried out on an alignment consisting <strong>of</strong><br />
the nuclear genes mentioned above, together with SSU nrDNA <strong>and</strong> the plastid genes rbcL <strong>and</strong> atpB.<br />
Histone genes were excluded from the analysis because they are known to be duplicated across<br />
genomes (Nei <strong>and</strong> Rooney 2005, Wahlberg <strong>and</strong> Wheat 2008). Phylogenetic analyses were carried out<br />
with model-based techniques (ML <strong>and</strong> BI), paying careful attention to the selection <strong>of</strong> suitable<br />
partitioning strategies <strong>and</strong> models <strong>of</strong> sequence <strong>evolution</strong>. The model selection procedure proposed 8<br />
partitions: SSU nrDNA was partitioned into loops <strong>and</strong> stems (2 partitions) <strong>and</strong> nuclear <strong>and</strong> plastid<br />
genes were partitioned into codon positions (2 3 partitions). GTR+ 8 was the preferred model for<br />
all partitions. Noise-reduction techniques were applied to counteract the erosion <strong>of</strong> ancient<br />
phylogenetic signal caused by fast-evolving sites. The phylogenetic tree presented here is based on<br />
the 75% slowest-evolving sites (Cocquyt et al. submitted).<br />
Evolution <strong>of</strong> glutamine codon usage<br />
The <strong>evolution</strong> <strong>of</strong> glutamine codon usage was estimated using ancestral state estimation techniques.<br />
The frequency <strong>of</strong> the two canonical <strong>and</strong> two non-canonical glutamine codons was calculated for each<br />
species in the phylogenetic tree. Codon frequencies were mapped along the reference tree using the<br />
ace function <strong>of</strong> the APE package (Paradis et al. 2004). This function estimates ancestral character<br />
states by maximum likelihood optimization (Schluter et al. 1997). The branch lengths were based on<br />
ML estimates because we consider them to be a more relevant approximation <strong>of</strong> the amount <strong>of</strong><br />
codon usage <strong>evolution</strong> that can be expected to take place than absolute time (cf. Cocquyt et al.
72 CHAPTER 4<br />
2009). The output from APE was mapped onto the reference tree with TreeGradients v1.03<br />
(Verbruggen 2009) to plot ancestral states <strong>of</strong> continuous characters on a phylogenetic tree as colors<br />
along a color gradient.<br />
Topological hypothesis testing<br />
Approximately unbiased tests (AU test, Shimodaira 2002) were used to test an alternative<br />
relationship between ulvophycean orders as suggested by the distribution <strong>of</strong> the canonical genetic<br />
code (see results). Site-specific likelihoods were calculated by maximum likelihood optimization in<br />
Treefinder using the same model specifications as for phylogenetic inference (Cocquyt et al.<br />
submitted). AU tests were performed with CONSEL V0.1i (Shimodaira <strong>and</strong> Hasegawa 2001).<br />
Results<br />
The dasycladaceans Acetabularia <strong>and</strong> Batophora have been shown previously to use the noncanonical<br />
code (Schneider et al. 1989, Schneider <strong>and</strong> de Groot 1991). Looking more broadly, we find<br />
that the non-canonical glutamine codons appear in coding sequences <strong>of</strong> additional members <strong>of</strong> the<br />
Dasycladales (genus Bornetella), as well as Cladophorales (genera Boergesenia, Boodlea, Cladophora,<br />
Dictyosphaeria, Phyllodictyon, Siphonocladus, Valonia), Trentepohliales (genus Trentepohlia) <strong>and</strong> the<br />
genus Blastophysa, which is currently not assigned to an order. Most non-canonical codons were<br />
found at highly conserved positions that encoded glutamine codons in the rest <strong>of</strong> the <strong>green</strong> plant<br />
lineage. Only TGA is used as stop codon in ribosomal protein 40S S9 <strong>and</strong> OEE1 <strong>of</strong> Cladophora.<br />
Moreover, other sequences from both Cladophora <strong>and</strong> Acetabularia deposited in GenBank only have<br />
TGA as stop codon: GapA gene (DQ270261) <strong>of</strong> Cladophora, <strong>and</strong> EF-1α (EF551321) <strong>and</strong> PsbS genes<br />
(BK006014) <strong>of</strong> Acetabularia. The presence <strong>of</strong> the st<strong>and</strong>ard code is confirmed for the genus Ignatius<br />
<strong>and</strong> the order Bryopsidales (genera Caulerpa, Bryopsis) by the presence <strong>of</strong> only canonical glutamine<br />
codons <strong>and</strong> the use <strong>of</strong> all three stop codons at the ends <strong>of</strong> various genes. The Ignatius actin gene has<br />
TAG as stop codon, while the β tubulin <strong>and</strong> HPS90 genes have TAA as stop codons. β tubulin <strong>and</strong><br />
HPS90 genes <strong>of</strong> Caulerpa have TAA as stop codons. Additional Bryopsis sequences deposited in<br />
GenBank confirmed the presence <strong>of</strong> all three stop codons in the Bryopsidales: TAA in ribonuclease<br />
Bm2 gene (AB164318), TAG in lectin precursor <strong>and</strong> oxygen evolving protein <strong>of</strong> photosystem II genes<br />
(EU410470 <strong>and</strong> AB293980), <strong>and</strong> TGA in the bryohealin precursor gene (EU769118).<br />
The occurrence <strong>of</strong> the st<strong>and</strong>ard <strong>and</strong> non-canonical code are plotted onto the reference phylogeny in<br />
Fig. 1. The Streptophyta, prasinophytes, Trebouxiophyceae <strong>and</strong> Chlorophyceae possess the st<strong>and</strong>ard<br />
genetic code. Within the class Ulvophyceae, the st<strong>and</strong>ard code is found in the orders Ulvales,<br />
Ulotrichales, Bryopsidales <strong>and</strong> the genus Ignatius whereas the orders Dasycladales, Siphonocladales,<br />
Trentepohliales <strong>and</strong> the genus Blastophysa have a non-canonical code. However, the taxa with a<br />
non-canonical code do not form a monophyletic group (Fig. 1).
Figure 1. The occurrence <strong>of</strong> a non-canonical genetic code in <strong>green</strong> <strong>algae</strong> is indicated with gray squares. Taxa<br />
with a non-canonical genetic code are not monophyletic. Three alternative scenarios can explain its<br />
distribution on the tree:<br />
(1) a single origin <strong>of</strong> the non-canonical code along the branch leading to the orders Trentepohliales,<br />
Dasycladales, Bryopsidales, Cladophorales <strong>and</strong> the genus Blastophysa <strong>and</strong> a reversal to the universal<br />
code in the Bryopsidales (indicated with black arrow <strong>and</strong> cross)<br />
(2) three independent gains <strong>of</strong> the non-canonical code in the Trentepohliales, the Dasycladales <strong>and</strong> the<br />
Cladophorales + Blastophysa (indicated with gray arrows)<br />
(3) a single initiation <strong>of</strong> the formation <strong>of</strong> the non-canonical code along the branch leading to the orders<br />
Trentepohliales, Dasycladales, Bryopsidales, Cladophorales <strong>and</strong> the genus Blastophysa that has been<br />
completed in all lineages except the Bryopsidales (black arrow combined with gray arrows)<br />
The reference phylogeny <strong>of</strong> the <strong>green</strong> plant lineage was obtained by maximum likelihood inference <strong>of</strong> the 25%<br />
site stripped dataset containing 7 nuclear genes, SSU nrDNA <strong>and</strong> plastid genes rbcL <strong>and</strong> atpB (Cocquyt et al.<br />
submitted). Numbers at nodes indicate ML bootstrap values (top) <strong>and</strong> posterior probabilities (bottom); values<br />
below respectively 50 <strong>and</strong> 0.9 are not shown.
74 CHAPTER 4<br />
If both the phylogeny <strong>and</strong> the distribution <strong>of</strong> the genetic codes shown in Fig. 1 are correct, then more<br />
than one gain <strong>and</strong>/or loss event <strong>of</strong> the non-canonical code must be postulated. To examine the<br />
validity <strong>of</strong> the phylogeny, we performed topology tests to evaluate whether the data rejected a<br />
topology in which all taxa with the non-canonical code formed a monophyletic group. Specifically, we<br />
found that the topology where Bryopsidales is sister to all Ulvophyceae with a non-canonical code is<br />
rejected with high significance ( lnL = 27.9; p < 0.0001).<br />
The estimated <strong>evolution</strong> <strong>of</strong> glutamine codon usage frequencies is shown in Fig. 2. The canonical<br />
codon CAG is most commonly used, followed by the canonical codon CAA. Among the non-canonical<br />
codons, TAG is used more commonly then TAA. This bias is likely a product <strong>of</strong> the overall bias <strong>of</strong><br />
these species <strong>and</strong>/or genes for GC residues, which favors a G in the third position. This observation is<br />
also congruent with canonical glutamine codons CAG <strong>and</strong> CAA which mutate to non-canonical<br />
glutamine codons TAG <strong>and</strong> TAA by a single transition (C → T) at the first codon position (Keeling <strong>and</strong><br />
Le<strong>and</strong>er 2003).<br />
Discussion<br />
Our results reveal the distribution <strong>of</strong> a non-canonical genetic code in the Ulvophyceae, where<br />
glutamine is encoded by both canonical CAG <strong>and</strong> CAA codons as well as non-canonical TAG <strong>and</strong> TAA<br />
codons. Unexpectedly, we find the taxa with this non-canonical code do not form a monophyletic<br />
group according to the seemingly robust phylogeny <strong>of</strong> the organisms in which it is found (Fig. 1). If<br />
the inferred phylogeny is indeed correct, three alternative scenarios can explain the distribution <strong>of</strong><br />
the code on that tree: (1) a single origin <strong>of</strong> the non-canonical code along the branch leading to the<br />
orders Trentepohliales, Dasycladales, Bryopsidales, Cladophorales <strong>and</strong> the genus Blastophysa <strong>and</strong> a<br />
reversal to the universal code in the Bryopsidales (Fig. 1: indicated with black arrow <strong>and</strong> cross); (2)<br />
three independent gains <strong>of</strong> the non-canonical code in the Trentepohliales, the Dasycladales <strong>and</strong> the<br />
Cladophorales + Blastophysa (Fig. 1: indicated with gray arrows), <strong>and</strong> (3) a single initiation <strong>of</strong> a<br />
stepwise formation <strong>of</strong> the non-canonical code along the branch leading to the orders<br />
Trentepohliales, Dasycladales, Bryopsidales, Cladophorales <strong>and</strong> the genus Blastophysa, but where<br />
the process has gone to completion in all lineages except the Bryopsidales (Fig. 1: black arrow<br />
combined with gray arrows). Alternatively, because changes in the genetic code are so rare, the<br />
possibility that the reference phylogeny is wrong should not be passed over too easily. More<br />
specifically, if one assumes that the current position <strong>of</strong> the Bryopsidales is wrong <strong>and</strong> that in reality<br />
this group is sister to all the taxa with a non-canonical code, only a single transition from the genetic<br />
code would have to be invoked. In what follows, we will discuss each <strong>of</strong> these possibilities in more<br />
detail <strong>and</strong> report on some cytological correlates <strong>of</strong> the non-canonical genetic code.
NON-CANONICAL GENENTIC CODE 75<br />
Figure 2. The estimated ancestral frequencies <strong>of</strong> glutamine codon usage. Canonical codon CAG is most<br />
commonly used, followed by CAA, the second canonical codon. Among the non-canonical codons, TAG is used<br />
more commonly then TAA. The estimate ancestral frequencies <strong>of</strong> non-canonical codon usage along the nodes<br />
<strong>of</strong> interest are indicated with an arrow.
76 CHAPTER 4<br />
Phylogenetic uncertainty<br />
Our phylogenetic tree is based on the most comprehensive dataset currently available for the<br />
Chlorophyta. It is inferred from a concatenated dataset including seven nuclear genes, SSU nrDNA<br />
<strong>and</strong> two plastid genes using model-based techniques with carefully chosen partitioning strategies<br />
<strong>and</strong> models <strong>of</strong> sequence <strong>evolution</strong> <strong>and</strong> application <strong>of</strong> a site removal approach to optimize signal for<br />
the relevant level <strong>of</strong> divergence (Cocquyt et al. submitted). Our tree shows a sister relationship<br />
between Dasycladales <strong>and</strong> Bryopsidales with moderately high statistical support (BV 87 <strong>and</strong> PP 1.00).<br />
This relationship is concordant with a recently published 74-taxon phylogeny <strong>of</strong> the <strong>green</strong> lineage<br />
based on SSU nrDNA <strong>and</strong> two plastid genes (Cocquyt et al. 2009). Both phylogenies show major<br />
improvements in taxon <strong>and</strong> gene sampling within the Ulvophyceae compared to previously published<br />
phylogenies, which were either based on a single marker, did not include the Bryopsidales, or could<br />
not resolve the relationships among the Bryopsidales, Dasycladales <strong>and</strong> Cladophorales (Zechman et<br />
al. 1990, Lopez-Bautista <strong>and</strong> Chapman 2003, Watanabe <strong>and</strong> Nakayama 2007). Based on the dataset<br />
used to infer our reference tree, the alternative topology in which the Bryopsidales are sister to all<br />
taxa with a non-canonical code is significantly less likely than the ML tree as shown by AU tests. As a<br />
consequence, unless the phylogenetic signal contained in the <strong>molecular</strong> data is fundamentally wrong,<br />
the ulvophycean taxa with the non-canonical code form a paraphyletic group <strong>and</strong> one <strong>of</strong> the more<br />
complex <strong>evolution</strong>ary scenarios for the gain <strong>of</strong> the non-canonical code has to be invoked.<br />
Gain–reversal hypothesis<br />
A reversal from the non-canonical to the st<strong>and</strong>ard genetic code is unlikely for several reasons. First,<br />
following a transition to the non-canonical code, TAG <strong>and</strong> TAA codons would be present in many<br />
coding sequences. In order to revert to the st<strong>and</strong>ard or canonical code, these codons would all have<br />
to revert to canonical codons or they would terminate translation, with obvious detrimental effects.<br />
Our ancestral state estimates indicate a non-negligible usage frequency <strong>of</strong> both non-canonical<br />
codons along the ancestral nodes <strong>of</strong> interest (Fig. 2 C,D, indicated with arrows). These results must<br />
be considered with caution because <strong>of</strong> the intrinsic limitations <strong>of</strong> ancestral state estimation (Martins<br />
1999) <strong>and</strong> the fact that the non-independence <strong>of</strong> the <strong>evolution</strong> <strong>of</strong> the genetic code <strong>and</strong> glutamine<br />
codon usage cannot be captured by the Brownian motion model. Nevertheless, it seems likely that<br />
glutamine-encoding TAA <strong>and</strong> TAG codons in a genome using the non-canonical code would be more<br />
common than TAA <strong>and</strong> TAG were in the ancestral genome where the st<strong>and</strong>ard code was still in use,<br />
because the frequency <strong>of</strong> stop codons is at most once per gene whereas even disfavored glutamine<br />
codons can appear several times in a single gene. The major argument against a reversal from the<br />
non-canonical to the canonical code is that the original change would have been accompanied by<br />
changes in the translation apparatus, e.g. alterations in tRNAs, aminoacyl-tRNA-synthethases,<br />
eukaryotic release factor (eRF1) <strong>and</strong> also potentially a nonsense-mediated mRNA decay (NMD)<br />
mechanism, all <strong>of</strong> which would have to reverse in the Bryopsidales in order to support this scenario<br />
(Knight et al. 2001, Keeling <strong>and</strong> Le<strong>and</strong>er 2003). Taken together, the reversal <strong>of</strong> a non-canonical code<br />
to the st<strong>and</strong>ard code appears highly unlikely.
Multiple independent gains<br />
NON-CANONICAL GENENTIC CODE 77<br />
Several independent acquisitions <strong>of</strong> non-canonical codes have been reported for ciliates<br />
(Tourancheau et al. 1995, Knight et al. 2001, Lozupone et al. 2001). Indeed, stop codon<br />
reassignments are surprisingly frequent in this group <strong>of</strong> organisms: the same non-canonical code<br />
than the one present in the Ulvophyceae has evolved several times, another non-canonical code in<br />
which TGA codes for tryptophan evolved twice, <strong>and</strong> a third non-canonical code that translates TGA to<br />
cysteine evolved once. In the present study, the distribution <strong>of</strong> the non-canonical code in the<br />
phylogenetic tree would require three gains: in the Trentepohliales, the Dasycladales <strong>and</strong> the<br />
Cladophorales + Blastophysa. Contrary to the situation in ciliates, however, Ulvophyceae only<br />
evolved a single type <strong>of</strong> non-canonical code <strong>and</strong> they did so in closely related lineages. The<br />
combination <strong>of</strong> these two arguments weakens the plausibility <strong>of</strong> multiple independent gains<br />
although the possibility cannot be excluded altogether.<br />
Stepwise acquisition model<br />
Several studies have revealed that stop codon reassignment is a gradual process requiring changes to<br />
tRNA <strong>and</strong> eRF1 genes (reviewed in Knight et al. 2001, Santos et al. 2004, Sengupta <strong>and</strong> Higgs 2005).<br />
In several eukaryotes, the two glutamine tRNAs, recognizing CAG <strong>and</strong> CAA, are also able to read TAG<br />
<strong>and</strong> TAA codons by a G U wobble base pairing at the third anticodon position (Beier <strong>and</strong> Grimm<br />
2001). In normal circumstances (canonical code), eRF1 out-competes the glutamine tRNAs when it<br />
comes to binding TAG <strong>and</strong> TAA. Mutations in glutamine tRNA copies that allow them to bind TAG <strong>and</strong><br />
TAA may increase the capacity to translate TAG <strong>and</strong> TAA to glutamine. This leads to an intermediate<br />
step in which both eRF1 <strong>and</strong> the mutated tRNAs can easily bind to TAG <strong>and</strong> TAA. The ciliate<br />
Tetrahymena thermophila has three major glutamine tRNAs, one that recognizes the normal<br />
glutamine codons CAG <strong>and</strong> CAA, <strong>and</strong> two supplementary tRNAs that recognize the non-canonical<br />
codons TAG <strong>and</strong> TAA. These two supplementary tRNAs were shown to have evolved from the normal<br />
glutamine tRNA (Hanyu et al. 1986). A similar situation likely exists in diplomonads (Keeling <strong>and</strong><br />
Doolittle 1996). In order to alter the genetic code, mutations are required not only in glutamine<br />
tRNAs but also in eukaryotic release factor 1 (eRF1) so it no longer recognises TAG <strong>and</strong> TAA codons.<br />
In ciliates it has been shown that eRF1 sequences are highly divergent in domain 1 between species<br />
with a canonical <strong>and</strong> non-canonical code, which could indicate that eRF1 can no longer recognize<br />
TAG <strong>and</strong> TAA codons in the species with a non-canonical code (Lozupone et al. 2001, Inagaki et al.<br />
2002). An additional mechanism that constrains the genetic code <strong>and</strong> therefore represents yet<br />
another potential step in the process <strong>of</strong> codon assignment is nonsense-mediated mRNA decay (NMD)<br />
(Baker <strong>and</strong> Parker 2004, Maquat 2004). NMD reduces errors in gene expression by eliminating<br />
mRNAs that encode for an incomplete polypeptide due to the presence <strong>of</strong> stop codons. In the case <strong>of</strong><br />
a non-canonical code where stop codons TAG <strong>and</strong> TAA encode glutamine, as observed here, this<br />
NMD mechanism would have to be altered also in order to prevent degradation <strong>of</strong> mRNAs containing<br />
TAG <strong>and</strong> TAA codons.<br />
A stepwise acquisition model can reconcile the opposed <strong>and</strong> problematic hypotheses <strong>of</strong> multiple<br />
gains versus a single gain with subsequent loss. For example, the ambiguous intermediate theory<br />
(Schultz <strong>and</strong> Yarus 1994, Santos et al. 2004) would explain the distribution <strong>of</strong> the non-canonical code
78 CHAPTER 4<br />
in Ulvophyceae as follows: mutations in the anticodons <strong>of</strong> canonical glutamine tRNAs occurred once<br />
along the branch leading to the orders Trentepohliales, Dasycladales, Bryopsidales, Cladophorales<br />
<strong>and</strong> the genus Blastophysa (Fig. 1, black arrow). The presence <strong>of</strong> these mutated tRNAs allowed TAG<br />
<strong>and</strong> TAA codons to be translated to glutamine instead <strong>of</strong> terminating translation. At this step, the<br />
mutated tRNAs compete with eRF1 for the TAA <strong>and</strong> TAG codons. To complete the transition to the<br />
non-canonical code, a subsequent mutation <strong>of</strong> eRF1 that prevents binding <strong>of</strong> eRF1 with TAG <strong>and</strong> TAA<br />
is required. If one assumes that this step occurred three times independently in the Trentepohliales,<br />
Dasycladales <strong>and</strong> Cladophorales + Blastophysa (Fig. 1, gray arrows), whereas the mutated tRNAs<br />
decreased in importance or went extinct through selection or drift along the branch leading to the<br />
Bryopsidales, the distribution <strong>of</strong> the non-canonical code in the Ulvophyceae would be explained.<br />
However, a detailed comparison <strong>of</strong> eukaryotic release factors (eRF1) <strong>and</strong> glutamine tRNAs in the<br />
respective clades <strong>of</strong> the Ulvophyceae is needed to test this <strong>evolution</strong>ary scenario.<br />
Cytological correlates <strong>of</strong> non-canonical code<br />
In the ciliates, the multiple appearances <strong>of</strong> alternative codes have been attributed to their nuclear<br />
characteristics. Ciliates have two nuclei: a small, diploid micronucleus which is not expressed <strong>and</strong> is<br />
the germ line for DNA exchanges during the sexual process, <strong>and</strong> a large, polyploid macronucleus<br />
which is actively transcribed <strong>and</strong> ensures vegetative cell growth, but is not passed on to progeny<br />
after sexual conjugation <strong>and</strong> is replaced by a newly formed macronucleus after a number <strong>of</strong> rounds<br />
<strong>of</strong> mitotic division. There is therefore a time lag between the occurrence <strong>of</strong> mutations in the<br />
micronucleus <strong>and</strong> the expression <strong>of</strong> these mutations in the macronucleus, <strong>and</strong> this has been<br />
postulated to be a contributing factor to why ciliates have evolved alternative genetic codes more<br />
frequently (Cohen <strong>and</strong> Adoutte 1995). In this context it is worth mentioning that hexamitid<br />
diplomonads, for which a single origin <strong>of</strong> a non-canonical code together with the uninucleate<br />
enteromonads has been shown, have two similar nuclei per cell (Keeling <strong>and</strong> Le<strong>and</strong>er 2003, Kolisko<br />
et al. 2008) <strong>and</strong> that several ulvophycean groups are characterized by multinucleate cells namely the<br />
Dasycladales, Bryopsidales, Cladophorales <strong>and</strong> Blastophysa. The Cladophorales <strong>and</strong> Blastophysa are<br />
branched filamentous seaweeds consisting <strong>of</strong> multinucleate cells with a few to thous<strong>and</strong>s <strong>of</strong> nuclei<br />
arranged in non-motile cytoplasmic domains (siphonocladous organization). Members <strong>of</strong> the<br />
Bryopsidales <strong>and</strong> Dasycladales have a siphonous organization: they consist <strong>of</strong> a single, giant tubular<br />
cell with numerous nuclei <strong>and</strong> complex patterns <strong>of</strong> cytoplasmic flow. Acetabularia (Dasycladales)<br />
forms an exception in the sense that the number <strong>of</strong> nuclei has been reduced to one in this genus: its<br />
members possess a single, giant nucleus situated in the rhizoid. It thus appears that the ancestors <strong>of</strong><br />
these taxa in which changes <strong>of</strong> the genetic code have occurred were very likely all multinucleate.<br />
Despite the fact that some eukaryotes with a non-canonical code do not feature multinucleate cells<br />
<strong>and</strong> that there are plenty <strong>of</strong> examples <strong>of</strong> groups with multinucleate cells that have not evolved<br />
alternative codes, this observation suggests that a multinucleate cytology can facilitate codon<br />
reassignments. To our knowledge, no explanatory mechanisms have been described.
Acknowledgements<br />
NON-CANONICAL GENENTIC CODE 79<br />
We thank Caroline Vlaeminck for assisting with the <strong>molecular</strong> work <strong>and</strong> Wim Gillis for IT support.<br />
Funding was provided by the Special Research Fund (Ghent University, DOZA-01107605), a grant<br />
from the Natural Sciences <strong>and</strong> Engineering Research Council <strong>of</strong> Canada (227301), an NSERC<br />
postgraduate doctoral scholarship to GHG <strong>and</strong> Research Foundation Fl<strong>and</strong>ers postdoctoral<br />
fellowships to HV, FL <strong>and</strong> ODC. PJK is a Fellow <strong>of</strong> the Canadian Institute for Advanced Research <strong>and</strong> a<br />
Senior Investigator <strong>of</strong> the Michael Smith Foundation for Health Research. Phylogenetic analyses were<br />
largely carried out on the KERMIT computing cluster (Ghent University).
5<br />
Codon usage bias <strong>and</strong> GC content in <strong>green</strong> <strong>algae</strong><br />
Ellen Cocquyt, Heroen Verbruggen <strong>and</strong> Olivier De Clerck<br />
1 <strong>Phycology</strong> Research Group <strong>and</strong> Center for Molecular Phylogenetics <strong>and</strong> Evolution, Ghent University,<br />
Krijgslaan 281 S8, 9000 Ghent, Belgium<br />
Abstract<br />
Large differences in synonymous codon usage bias <strong>and</strong> GC content have been observed within <strong>and</strong><br />
among genomes <strong>and</strong> a plethora <strong>of</strong> hypotheses have been put forward to explain them. In this study,<br />
we characterize patterns <strong>of</strong> codon usage bias <strong>and</strong> GC content in eight nuclear housekeeping genes<br />
from 43 <strong>green</strong> <strong>algae</strong> <strong>and</strong> l<strong>and</strong> plants. We analyze the <strong>evolution</strong> <strong>of</strong> these biases in a phylogenetic<br />
framework. We observe stronger codon usage bias in the ancestral streptophytes Mesostigma <strong>and</strong><br />
Chlorokybus than in the remainder <strong>of</strong> the Streptophyta. Within the Chlorophyta, the prasinophytes,<br />
Trebouxiophyceae <strong>and</strong> Chlorophyceae have markedly stronger codon usage bias than the<br />
Ulvophyceae. One exception is Ignatius, which is a member <strong>of</strong> the Ulvophyceae yet has a markedly<br />
stronger codon usage bias than other members <strong>of</strong> this class. GC content patterns show congruent<br />
trends, species with strong codon usage bias having a high GC content. We interpret these results<br />
along with the biology <strong>of</strong> the organisms in the framework <strong>of</strong> two models: the mutation-selection-drift<br />
model <strong>and</strong> the co-<strong>evolution</strong>ary model <strong>of</strong> genome composition <strong>and</strong> resource allocation. It is<br />
remarkable that unicellular organisms <strong>and</strong> colony-forming species have much more pronounced GC<br />
<strong>and</strong> codon usage biases as compared to multicellular <strong>and</strong> macroscopic species. This may follow from<br />
unicells having large population sizes, which leads to more codon usage bias due to stronger<br />
selection as compared to species with smaller population sizes where drift can more rapidly fix<br />
mutation. We also interpret the correlation <strong>of</strong> the observed biases with growth rates, generation<br />
time <strong>and</strong> rates <strong>of</strong> <strong>molecular</strong> <strong>evolution</strong> <strong>of</strong> the organisms under study.<br />
Keywords<br />
codon usage bias, GC content, unicellular, multicellular, effective population size, <strong>green</strong> plants
82 CHAPTER 5<br />
Introduction<br />
The genetic code, which allows translating codons (nucleotide triplets) to amino acids, is redundant<br />
because all amino acids except methionine <strong>and</strong> tryptophan are encoded by two to six synonymous<br />
codons. Even though the fact that synonymous codons translate to the same amino acid would lead<br />
to the expectation that synonymous codons are used in equal proportions, DNA sequence data from<br />
a wide range <strong>of</strong> organisms have shown that this is not the case: some synonymous codons are clearly<br />
preferred over others, <strong>and</strong> different organisms <strong>of</strong>ten have different preferences. This phenomenon is<br />
called codon usage bias <strong>and</strong> has been associated with a wide range <strong>of</strong> biological factors (Salim <strong>and</strong><br />
Cavalcanti 2008). Within a single organism, codon usage bias is more pronounced in highly expressed<br />
<strong>and</strong> long genes, <strong>and</strong> near the 3’end <strong>of</strong> genes. Codon usage bias is stronger when the population <strong>of</strong><br />
tRNAs is less diverse <strong>and</strong> correlates with GC content. Differences in codon usage bias between<br />
organisms appear to correlate with their population size; species with large effective population sizes<br />
having more biased codon usage than species with smaller population sizes (Cutter et al. 2006,<br />
Ingvarsson 2008, Subramanian 2008).<br />
Conceptual models <strong>of</strong> various levels <strong>of</strong> complexity have been proposed to explain the presence <strong>and</strong><br />
degree <strong>of</strong> codon usage bias in <strong>and</strong> between organisms. The mutation-selection-drift balance model<br />
assumes that codon usage ensues from the delicate balance between mutation, selection <strong>and</strong><br />
genetic drift in populations (Bulmer 1991, Hershberg <strong>and</strong> Petrov 2008). Whereas natural selection<br />
can be expected to favor the organism's preferred (major) codons over minor codons, mutational<br />
pressure <strong>and</strong> genetic drift allow minor codons to persist in the population (Fig 1. A external factors<br />
influencing mutation bias <strong>and</strong> selection, reviewed in Hershberg <strong>and</strong> Petrov 2008). A more complex<br />
model, which we will refer to as the co-<strong>evolution</strong>ary model, assumes that genome biases (e.g. GC <strong>and</strong><br />
codon usage bias) result from the co-<strong>evolution</strong> between genome composition <strong>and</strong> resource<br />
concentration, both <strong>of</strong> which act on genome bias via mutation bias <strong>and</strong> selection (Fig 1. B internal<br />
mechanism influencing mutation bias <strong>and</strong> selection, Vetsigian <strong>and</strong> Goldenfeld 2009). More<br />
specifically, for a certain genome composition the nucleotide <strong>and</strong> tRNA concentrations are altered to<br />
increase speed <strong>and</strong> accuracy, which in turn leads to mutation <strong>and</strong> selection pressures favoring the<br />
preferred nucleotides <strong>and</strong> codons. The combination <strong>of</strong> all these factors leads to differences in<br />
genome biases between <strong>and</strong> within species. To date, most studies have concentrated on genome<br />
bias within a single species <strong>and</strong> relatively few studies examined genome biases between organisms.<br />
As far as we know, only one study examined codon usage bias between more distantly related<br />
nematode species which inhabit different ecological niches being either free-living or parasitic<br />
(Cutter et al. 2006).<br />
The <strong>green</strong> <strong>algae</strong> form a promising model system to study the <strong>evolution</strong> <strong>of</strong> codon usage bias <strong>and</strong> GC<br />
content over longer time-scales for several reasons. First, some ulvophycean <strong>algae</strong> were shown to<br />
have a non-canonical genetic code in which the stop codons TAG <strong>and</strong> TAA have been reassigned to<br />
glutamine (Cocquyt et al. in prep.). This non-canonical code involves changes in glutamine codon<br />
usage, the translation termination apparatus, tRNAs <strong>and</strong> tRNA synthetases, <strong>and</strong> mutations<br />
converting canonical glutamine codons (CAG <strong>and</strong> CAA) to non-canonical glutamine codons (TAG <strong>and</strong><br />
TAA) by a single transition at the first codon position (C � T). Second, <strong>green</strong> <strong>algae</strong> <strong>and</strong> l<strong>and</strong> plants<br />
occupy a wide variety <strong>of</strong> ecological niches, including marine, freshwater <strong>and</strong> terrestrial habitats.<br />
Finally, the <strong>green</strong> <strong>algae</strong> are characterized by markedly different rates <strong>of</strong> <strong>molecular</strong> <strong>evolution</strong> as
CODON USAGE BIAS AN GC CONTENT 83<br />
indicated by root to tip path length differences in phylogenetic trees, indicating differences in<br />
<strong>molecular</strong> <strong>evolution</strong> between different groups <strong>of</strong> <strong>green</strong> <strong>algae</strong>. Finally, <strong>green</strong> <strong>algae</strong> exhibit remarkable<br />
morphological <strong>and</strong> cytological diversity ranging from unicells <strong>and</strong> colonies, over multicellular<br />
filaments <strong>and</strong> foliose blades, to highly complex multicellular <strong>and</strong> multinucleate life forms. Two types<br />
<strong>of</strong> multinucleate organisms are present: (1) a siphonocladous organization with cells that contain a<br />
few to thous<strong>and</strong>s <strong>of</strong> nuclei arranged in non-motile cytoplasmic domains (e.g. order Cladophorales<br />
<strong>and</strong> genus Blastophysa), <strong>and</strong> (2) a siphonous organization with a single, giant tubular cell that<br />
contains numerous nuclei <strong>and</strong> complex patterns <strong>of</strong> cytoplasmic flow (e.g. orders Bryopsidales <strong>and</strong><br />
most Dasycladales). These morphological <strong>and</strong> cytological differences may correlate with differences<br />
in population size <strong>and</strong> as such have an impact on genome biases.<br />
Figure 1. Origin <strong>of</strong> genome biases such as GC or AT bias <strong>and</strong> codon usage bias.<br />
A. Genome composition is influenced by a delicate balance between mutation bias <strong>and</strong> selection for fast <strong>and</strong><br />
accurate transcription <strong>and</strong> translation. Selection <strong>and</strong> mutation are in turn influenced by several external <strong>and</strong><br />
internal factors.<br />
(1) species with large population sizes have more codon usage bias due to stronger selection compared to<br />
species with smaller population sizes where drift can more rapidly fix mutations.<br />
(2) In rapidly multiplying organisms, the time spent in translation is a limiting factor in cell division, increased<br />
selection leads to an optimal translation.<br />
(3) Selection for optimal speed <strong>and</strong> accuracy <strong>of</strong> replication <strong>and</strong> translation involves a co-<strong>evolution</strong> between<br />
genome composition <strong>and</strong> resource concentration, which in turn influence the direction <strong>of</strong> mutation bias.<br />
B. Selection <strong>and</strong> mutation are influenced by the co-<strong>evolution</strong> between genome composition <strong>and</strong> resource<br />
concentration, effective population size <strong>and</strong> growth rate, each causing a specific genome bias.
84 CHAPTER 5<br />
The goal <strong>of</strong> this study is to characterize patterns <strong>of</strong> codon usage bias <strong>and</strong> GC content in <strong>green</strong> algal<br />
nuclear genes <strong>and</strong> analyze their <strong>evolution</strong> in an explicit phylogenetic framework. Our approach<br />
consists <strong>of</strong> calculating codon usage bias <strong>and</strong> GC content in 43 representatives <strong>of</strong> <strong>green</strong> <strong>algae</strong> <strong>and</strong> l<strong>and</strong><br />
plants based on eight nuclear housekeeping genes. The <strong>evolution</strong>ary patterns <strong>of</strong> codon usage bias<br />
<strong>and</strong> GC content are subsequently approximated with ancestral state estimation techniques <strong>and</strong><br />
mapped along the reference tree.<br />
Methods<br />
DNA amplification <strong>and</strong> sequencing<br />
Seven nuclear genes (actin, GPI, GapA, OEE1, 40S ribosomal protein S9 <strong>and</strong> 60S ribosomal proteins L3<br />
<strong>and</strong> L17) were amplified <strong>and</strong> sequenced for 43 taxa representing the major lineages <strong>of</strong> the<br />
Viridiplantae as described in Cocquyt et al. (submitted). A histone gene was amplified using the same<br />
PCR conditions with an annealing temperature <strong>of</strong> 55°C. The primers were based on a Cladophora<br />
coelothrix cDNA sequence aligned with GenBank sequences from <strong>green</strong> <strong>algae</strong> <strong>and</strong> l<strong>and</strong> plants (His-F:<br />
5’-ATG GCI CGT ACI AAG CAR AC-3’ <strong>and</strong> His-R: 5’-GGC ATG ATG GTS ACS CGC TT-3’).<br />
Molecular phylogenetics<br />
We constructed a reference phylogeny <strong>of</strong> the Viridiplantae as described in Cocquyt et al. (submitted)<br />
to study patterns <strong>of</strong> codon usage bias <strong>and</strong> GC content. The phylogenetic analysis was carried out on<br />
an alignment consisting <strong>of</strong> the nuclear genes mentioned above, SSU nrDNA <strong>and</strong> the plastid genes<br />
rbcL <strong>and</strong> atpB. Histone genes were excluded from the analysis because they are known to be<br />
duplicated across genomes (Nei <strong>and</strong> Rooney 2005, Wahlberg <strong>and</strong> Wheat 2008). The analysis was<br />
based on the 75% slowest-evolving sites to improve signal for the reconstruction <strong>of</strong> ancient<br />
relationships (Cocquyt et al. submitted).<br />
Synonymous codon usage bias <strong>and</strong> GC content<br />
Synonymous codon usage order (SCUO) was used to measure synonymous codon usage bias in each<br />
species <strong>and</strong> was calculated with CodonO based on concatenated sequences <strong>of</strong> the eight nuclear<br />
genes mentioned above (Wan et al. 2006, Angellotti et al. 2007). SCUO represents a value between 0<br />
to 1, larger values indicating stronger codon usage bias. GC content was calculated with TreeFinder<br />
(Jobb et al. 2004) based on the same eight nuclear genes. The <strong>evolution</strong> <strong>of</strong> SCUO <strong>and</strong> GC content was<br />
approximated using ancestral state estimation techniques <strong>and</strong> mapped along the reference tree.<br />
Ancestral state estimation was carried out with the ace function <strong>of</strong> the APE package (Paradis et al.<br />
2004), using maximum likelihood optimization for continuous characters (Schluter et al. 1997). The<br />
output from APE was mapped onto the reference tree with TreeGradients v1.03 (Verbruggen 2009).<br />
This program plots the estimated ancestral character states on a phylogenetic tree as colors along a<br />
color gradient.
Results <strong>and</strong> discussion<br />
CODON USAGE BIAS AN GC CONTENT 85<br />
The estimated <strong>evolution</strong> <strong>of</strong> synonymous codon usage bias (SCUO) <strong>and</strong> GC content is shown in Fig. 2.<br />
Mesostigma, closely followed by the genera Chlorokybus <strong>and</strong> Entransia, have stronger codon usage<br />
bias than the remainder <strong>of</strong> the Streptophyta. Within the Chlorophyta, the prasinophytes,<br />
Trebouxiophyceae, Chlorophyceae have markedly stronger codon usage bias than the Ulvophyceae.<br />
One exception is Ignatius, which is a member <strong>of</strong> the Ulvophyceae yet has a markedly stronger codon<br />
usage bias than other members <strong>of</strong> this class. GC content patterns show congruent trends: within the<br />
Streptophyta, GC bias is highest for Mesostigma <strong>and</strong> Chlorokybus. Within the Chlorophyta, GC bias is<br />
much more pronounced in the prasinophytes, Trebouxiophyceae <strong>and</strong> Chlorophyceae as compared to<br />
the Ulvophyceae. Within the Ulvophyceae, the orders Trentepohliales, Dasycladales <strong>and</strong> Bryopsidales<br />
have the weakest GC bias.<br />
It follows from Fig. 2 that there have been only a few transitions in GC <strong>and</strong> codon usage bias during<br />
the <strong>evolution</strong> <strong>of</strong> the <strong>green</strong> <strong>algae</strong>, more specifically two independent reductions <strong>of</strong> the biases in the<br />
Streptophyta <strong>and</strong> Ulvophyceae. This apparent conservatism <strong>of</strong> genome biases over long <strong>evolution</strong>ary<br />
periods st<strong>and</strong>s in strong contrast with the notion that variation <strong>of</strong> codon usage bias <strong>and</strong> GC content<br />
has been shown between closely related species <strong>and</strong> even within individual genomes (e.g. Duret <strong>and</strong><br />
Mouchiroud 1999, Derelle et al. 2006, Ingvarsson 2008). In the light <strong>of</strong> these indications for fast<br />
<strong>evolution</strong> <strong>of</strong> genome biases, it seems unlikely that their conservatism over long periods <strong>of</strong> time in the<br />
<strong>green</strong> <strong>algae</strong> is due to slow <strong>evolution</strong> but rather that it is a consequence <strong>of</strong> the association <strong>of</strong> genome<br />
biases with biological traits that have evolved slowly. In the following paragraphs, we will highlight<br />
several correlations between the observed patterns <strong>of</strong> genome bias <strong>and</strong> organismal traits that are<br />
associated with them <strong>and</strong> potentially responsible for them.<br />
Body <strong>and</strong> population size<br />
As illustrated in Fig. 2, the genes under study have more pronounced GC <strong>and</strong> codon usage bias in<br />
unicellular organisms <strong>and</strong> colony-forming species as compared to multicellular <strong>and</strong>/or multinucleate<br />
species. As such, the trends towards multicellularity <strong>and</strong> macroscopic algal bodies in both the<br />
Streptophyta <strong>and</strong> Chlorophyta are associated with decreasing amounts <strong>of</strong> GC <strong>and</strong> codon usage bias.<br />
It has been documented that codon usage bias is stronger for species with large populations due to<br />
stronger selection compared to species with smaller population sizes where drift can more rapidly fix<br />
mutations (Cutter et al. 2006, Ingvarsson 2008). Because the selective advantages associated with<br />
the usage <strong>of</strong> alternative codons are subtle, selection can only <strong>of</strong>fset the stochastic effects <strong>of</strong> genetic<br />
drift in species with large effective population sizes (Akashi 1995, Cutter et al. 2006, dos Reis <strong>and</strong><br />
Wernisch 2009). Because body size <strong>and</strong> population size appear to be inversely related for aquatic<br />
organisms (Finlay 2002, Fenchel <strong>and</strong> Finlay 2004), it seems likely that the strong codon usage bias<br />
observed in unicellular <strong>and</strong> colonial organisms may be a result <strong>of</strong> their larger effective population<br />
sizes.
86 CHAPTER 5
Growth rate <strong>and</strong> generation time<br />
CODON USAGE BIAS AN GC CONTENT 87<br />
In rapidly multiplying organisms, the time spent in translation is among the time-limiting factors in<br />
cell division (Higgs <strong>and</strong> Ran 2008). The speed <strong>of</strong> translation can be improved through the use <strong>of</strong><br />
preferred or optimal codons accompanied with a higher concentration <strong>of</strong> the corresponding tRNAs<br />
most likely mediated by tRNA gene duplications (Higgs <strong>and</strong> Ran 2008). In other words, stronger<br />
codon usage bias leads to more efficient translation <strong>and</strong> as such allows for higher growth rates.<br />
Under optimal environmental conditions, unicellular organisms have very high growth rates <strong>and</strong><br />
short generation time. Since in small, unicellular organisms every division leads to a doubling <strong>of</strong> the<br />
number <strong>of</strong> individuals, large population sizes are quickly reached. On the other h<strong>and</strong>, multicellular<br />
organisms <strong>and</strong> macroscopic unicellular <strong>algae</strong> (e.g. siphonous ulvophytes) make a larger investment in<br />
structural components <strong>and</strong> have lower population sizes. For example, under optimal conditions the<br />
unicellular flagellate Chlamydomonas divides every 6.7 h (Badour 1981), whereas the siphonous<br />
ulvophyte Acetabularia needs 115 days to complete its life cycle (Berger <strong>and</strong> Liddle 2003). These<br />
characteristic growth rates <strong>and</strong> generation times can be compared to r/K strategies in ecology. rselected<br />
species are opportunists characterized by high fecundity, small body sizes, early onset <strong>of</strong><br />
maturity, short generation times <strong>and</strong> the ability to disperse <strong>of</strong>fspring widely. K-selected species live<br />
in more stable environments <strong>and</strong> are characterized by large body sizes, long life expectation, <strong>and</strong> the<br />
production <strong>of</strong> fewer <strong>of</strong>fspring. Generally speaking, unicellular <strong>algae</strong> fit the r-selection theory,<br />
whereas macroscopic <strong>algae</strong> can be indicated as K-selected species. The strong codon usage bias<br />
observed in small unicellular <strong>algae</strong> can likely be explained by ecological traits such as fast growth<br />
rates, short generation time, small body size <strong>and</strong> large population size all being characteristic for rselected<br />
species.<br />
Rate <strong>of</strong> <strong>molecular</strong> <strong>evolution</strong><br />
Some Ulvophyceae, i.e. Trentepohliales, Dasycladales, Bryopsidales, Cladophorales <strong>and</strong> Blastophysa,<br />
have markedly elevated rates <strong>of</strong> <strong>molecular</strong> <strong>evolution</strong> as indicated by long root to tip path lengths in<br />
phylogenetic trees (branch lengths). In other words, these taxa have accumulated mutations at a<br />
faster pace than the rest <strong>of</strong> the <strong>green</strong> <strong>algae</strong>, potentially suggesting higher levels <strong>of</strong> genetic drift in<br />
those <strong>algae</strong>. The amount <strong>of</strong> codon usage bias depends on the delicate balance between selection for<br />
optimal translation <strong>and</strong> mutations fixed by genetic drift. Selection for speed <strong>and</strong> accuracy <strong>of</strong><br />
translation is expected to favor optimal codons over minor codons, leading to codon usage bias. On<br />
the other h<strong>and</strong>, when selection for optimal translation is less stringent, mutation events that are<br />
fixed through genetic drift will result in a uniform codon usage. The observed uniform codon usage in<br />
some Ulvophyceae is likely due to elevated rates <strong>of</strong> <strong>molecular</strong> <strong>evolution</strong> leading to the fixation <strong>of</strong><br />
many mutations <strong>and</strong> pronounced genetic drift. Studies on various other groups <strong>of</strong> organisms (both<br />
eukaryotes <strong>and</strong> prokaryotes) have also revealed a negative correlation between codon usage bias<br />
<strong>and</strong> rate <strong>of</strong> synonymous nucleotide substitution (Powell <strong>and</strong> Moriyama 1997, Kawahara <strong>and</strong> Imanishi<br />
2007).
88 CHAPTER 5<br />
Codon usage bias <strong>and</strong> GC content<br />
In our data, GC content <strong>and</strong> codon usage bias show congruent trends, species with strong codon<br />
usage bias having a high GC content (Fig. 2). Similar correlations have been recovered by other<br />
workers (Knight et al. 2001, Chen et al. 2004). The causal direction <strong>of</strong> this correlation has mostly been<br />
interpreted from GC content to codon usage bias. More specifically, it has been suggested that base<br />
composition drives codon usage through mutational bias in favor <strong>of</strong> the common nucleotides (Knight<br />
et al. 2001). Knight et al. (2001) conclude that 71-87% <strong>of</strong> the observed differences in codon usage<br />
within <strong>and</strong> between genomes can be explained by GC content influencing codon usage, the<br />
remaining 29-23% being a consequence <strong>of</strong> selective pressures for optimal translation.<br />
The co-<strong>evolution</strong>ary model <strong>of</strong>fers a more mechanistic perspective on the correlation between GC<br />
content <strong>and</strong> codon usage bias. More specifically, this model predicts that base composition <strong>and</strong><br />
codon usage are linked through internal feedback loops. If one assumes that translation efficiency<br />
improves with increased usage <strong>of</strong> G <strong>and</strong> C at synonymous codon positions, a GC-rich genome will<br />
result if selection for translation efficiency is sufficiently strong. Although many authors have<br />
reported a positive relationship between GC content <strong>and</strong> codon usage bias, we are not aware <strong>of</strong><br />
studies showing empirical evidence for intrinsically more efficient translation <strong>of</strong> codons that have G<br />
<strong>and</strong> C at synonymous positions. It is possible that the use <strong>of</strong> G <strong>and</strong> C improves codon–anticodon<br />
recognition because <strong>of</strong> the extra hydrogen bond that is formed between them, with positive effects<br />
on the speed <strong>and</strong> efficiency <strong>of</strong> translation. However, this is in contradiction with result from the<br />
recently published genomes <strong>of</strong> two strains <strong>of</strong> the marine prasinophyte Micromonas (Worden et al.<br />
2009). This study revealed that the average GC content is about 65 %, <strong>and</strong> that both strains<br />
contained a region with a GC content 14 % lower than average (comprising about 7% <strong>of</strong> the total<br />
genome). These low GC regions have a higher transcriptional activity <strong>and</strong> a different codon usage<br />
compared to the rest <strong>of</strong> the genome.<br />
Conclusion <strong>and</strong> perspectives<br />
The mutation-selection-drift model (Bulmer 1991, Hershberg <strong>and</strong> Petrov 2008) <strong>and</strong> the co<strong>evolution</strong>ary<br />
model <strong>of</strong> genome composition <strong>and</strong> resource allocation (Vetsigian <strong>and</strong> Goldenfeld 2009)<br />
form theoretical frameworks that allow predicting how a variety <strong>of</strong> biological factors can be expected<br />
to influence genome biases (Fig. 1). In the <strong>green</strong> plants studied here, we have been able to show that<br />
several biological factors that have previously been associated with genome bias are effectively<br />
associated with genome bias. All <strong>of</strong> these factors may have some explanatory power in the observed<br />
<strong>evolution</strong>ary patterns <strong>of</strong> codon usage bias <strong>and</strong> GC content but at present it is difficult to estimate<br />
their relative contributions. Incorporation <strong>of</strong> these <strong>and</strong> other biological factors (e.g. population size,<br />
growth rate, life style) in more detailed models would allow for a more precise estimation about<br />
their contribution.<br />
The strong correlation observed between ecological characteristics <strong>and</strong> genome biases invites<br />
studying the mechanisms responsible for this apparent association with sets <strong>of</strong> more closely related
CODON USAGE BIAS AN GC CONTENT 89<br />
taxa that allow addressing the questions within the timeframe they act. The <strong>green</strong> plant lineage<br />
<strong>of</strong>fers some useful cases as the members <strong>of</strong> this lineage occupy many distinct <strong>and</strong> widely divergent<br />
ecological niches, including freshwater, terrestrial <strong>and</strong> marine ecosystems, <strong>and</strong> exhibit a remarkable<br />
morphological <strong>and</strong> cytological diversity, ranging from unicells to complex macroscopic <strong>and</strong><br />
multicellular organisms. Studying closely related organism exhibiting less biological variation but that<br />
differ in terms <strong>of</strong> r/K selection would allow testing the impact <strong>of</strong> these ecological affinities on<br />
genome biases.<br />
Comparison <strong>of</strong> genome biases among different species is usually performed on EST data (e.g. Cutter<br />
et al. 2006, Ingvarsson 2008). Such data are not available for the broad sample <strong>of</strong> taxa we have used<br />
here. Our calculations are based on eight housekeeping genes, implying that the codon usage biases<br />
we are observing may be higher than average due to the relatively high expression level one can<br />
expect <strong>of</strong> these genes. However, because we use the same eight genes for comparisons across the<br />
phylogeny, we expect that the observed patterns <strong>of</strong> genome bias will generally be preserved when<br />
EST data are compared. Obviously, studying larger datasets would allow for more definitive<br />
conclusions but this awaits the generation <strong>of</strong> EST or whole-genome data for a broader range <strong>of</strong> <strong>green</strong><br />
<strong>algae</strong>, particularly siphonocladous <strong>and</strong> siphonous Ulvophyceae.<br />
Acknowledgments<br />
We thank P. Rouzé, K. V<strong>and</strong>epoele <strong>and</strong> P. Vanormelingen for valuable discussions relating to this<br />
work, X. F. Wan for providing a st<strong>and</strong>alone version <strong>of</strong> CodonO, Caroline Vlaeminck for assisting with<br />
the <strong>molecular</strong> work <strong>and</strong> W. Gillis for IT support. Funding was provided by the Special Research Fund<br />
(Ghent University, DOZA-01107605) <strong>and</strong> the Research Foundation Fl<strong>and</strong>ers (postdoctoral fellowships<br />
to HV, FL <strong>and</strong> ODC). Phylogenetic analyses were largely carried out on the KERMIT computing cluster<br />
(Ghent University).
6<br />
A multi-locus time-calibrated phylogeny <strong>of</strong> the siphonous <strong>green</strong><br />
<strong>algae</strong> 1<br />
Abstract<br />
The siphonous <strong>green</strong> <strong>algae</strong> are an assemblage <strong>of</strong> seaweeds that consist <strong>of</strong> a single giant cell. They<br />
comprise two sister orders, the Bryopsidales <strong>and</strong> Dasycladales. We infer the phylogenetic<br />
relationships among the siphonous <strong>green</strong> <strong>algae</strong> based on a five-locus data matrix <strong>and</strong> analyze<br />
temporal aspects <strong>of</strong> their diversification using relaxed <strong>molecular</strong> clock methods calibrated with the<br />
fossil record. The multi-locus approach resolves much <strong>of</strong> the previous phylogenetic uncertainty, but<br />
the radiation <strong>of</strong> families belonging to the core Halimedineae remains unresolved. In the Bryopsidales,<br />
three main clades were inferred, two <strong>of</strong> which correspond to previously described suborders<br />
(Bryopsidineae <strong>and</strong> Halimedineae) <strong>and</strong> a third lineage that contains only the limestone-boring genus<br />
Ostreobium. Relaxed <strong>molecular</strong> clock models indicate a Neoproterozoic origin <strong>of</strong> the siphonous <strong>green</strong><br />
<strong>algae</strong> <strong>and</strong> a Paleozoic diversification <strong>of</strong> the orders into their families. The inferred node ages are used<br />
to resolve conflicting hypotheses about species ages in the tropical marine alga Halimeda.<br />
Keywords<br />
<strong>molecular</strong> phylogenetics; relaxed <strong>molecular</strong> clock; fossil <strong>algae</strong>; Bryopsidales; Dasycladales;<br />
Ulvophyceae; Chlorophyta<br />
1 Published as: Verbruggen, H., M. Ashworth, S. T. LoDuca, C. Vlaeminck, E. Cocquyt, T. Sauvage, F. W.<br />
Zechman, D. S. Littler, M. M. Littler, F. Leliaert, <strong>and</strong> O. De Clerck. 2009. A multi-locus time-calibrated<br />
phylogeny <strong>of</strong> the siphonous <strong>green</strong> <strong>algae</strong>. Molecular Phylogenetics <strong>and</strong> Evolution 50:642-653.
92 CHAPTER 6<br />
Introduction<br />
The siphonous <strong>green</strong> <strong>algae</strong> form a morphologically diverse group <strong>of</strong> marine macro<strong>algae</strong>. They are<br />
readily distinguished from other <strong>green</strong> <strong>algae</strong> by their ability to form large, differentiated thalli<br />
comprised <strong>of</strong> a single, giant tubular cell. This tubular cell branches <strong>and</strong> fuses in various patterns to<br />
form a broad range <strong>of</strong> forms (Fig. 1). Individual branches <strong>of</strong> the tubular cell are called siphons. The<br />
siphonous <strong>green</strong> <strong>algae</strong> include two sister orders (Bryopsidales <strong>and</strong> Dasycladales) <strong>and</strong> belong to the<br />
chlorophytan class Ulvophyceae. The Cladophorales, an order closely related to the Bryopsidales <strong>and</strong><br />
Dasycladales (Zechman et al. 1990), is sometimes included in the siphonous <strong>algae</strong> but its members<br />
are not truly siphonous because they are generally multicellular. The siphonous <strong>green</strong> <strong>algae</strong> are<br />
unique among their chlorophytan relatives in having a relatively rich fossil record because many <strong>of</strong><br />
them biomineralize.<br />
Fig. 1. Morphology <strong>and</strong> anatomy <strong>of</strong> the siphonous <strong>green</strong> <strong>algae</strong> comprising the orders Bryopsidales (A–F) <strong>and</strong><br />
Dasycladales (G–J). A. Derbesia, B. Bryopsis, C. Codium, D. Udotea, E. Halimeda, F. Caulerpa, G. Batophora, H.<br />
Neomeris, I. Cymopolia, J. Acetabularia.<br />
The Bryopsidales range in morphology from simple, branched thalli (Fig. 1A,B) to more complex<br />
organizations with interwoven siphons, differentiated thalli <strong>and</strong> various morpho-ecological<br />
specializations (Fig. 1C-F). They have multiple nuclei scattered throughout the siphons. These <strong>algae</strong><br />
form an important component <strong>of</strong> the marine flora, particularly in tropical marine environments,<br />
where they are among the major primary producers on coral reefs, in lagoons <strong>and</strong> seagrass beds.<br />
They comprise roughly 500 recognized species (Guiry <strong>and</strong> Guiry 2008). The calcified representatives<br />
are major contributors <strong>of</strong> limestone to coral reef systems <strong>and</strong> are well-represented in the fossil<br />
record (Hillis-Colinvaux 1986; Mu 1990). The Bryopsidales are also common in warm-temperate
A MULTI-LOCUS TIME-CALIBRATED PHYLOGENY OF THE SIPHONOUS GREEN ALGAE 93<br />
marine habitats where they form a significant component <strong>of</strong> the flora (e.g., Codium). Several<br />
bryopsidalean taxa are vigorous invasive species (e.g., Codium fragile, Caulerpa taxifolia <strong>and</strong><br />
Caulerpa racemosa var. cylindracea) that are known to have pr<strong>of</strong>oundly affected the ecology <strong>and</strong><br />
native biota in areas <strong>of</strong> introduction. Molecular phylogenetic studies have shown two principal<br />
bryopsidalean lineages, both comprising simple as well as complex forms (Lam <strong>and</strong> Zechman, 2006;<br />
Verbruggen et al., 2009; Woolcott et al., 2000).<br />
Extant Dasycladales are characterized by a central axis surrounded by whorls <strong>of</strong> lateral branches (Fig.<br />
1G-J). Members <strong>of</strong> this group contain a single giant nucleus situated in the rhizoid during the<br />
vegetative phase <strong>of</strong> their life cycle. Albeit relatively inconspicuous, they are common <strong>algae</strong> <strong>of</strong> shallow<br />
tropical <strong>and</strong> subtropical marine habitats. Both calcified <strong>and</strong> non-calcified representatives have left a<br />
rich fossil record dating back to the Cambrian Period (540–488 my) (Berger <strong>and</strong> Kaever 1992; LoDuca,<br />
Kluessendorf, <strong>and</strong> Mikulic 2003). Fossil remains suggest that non-calcified dasyclads were most<br />
diverse during the Ordovician <strong>and</strong> Silurian periods <strong>and</strong> declined in favor <strong>of</strong> calcified representatives<br />
after the Early Devonian (± 400 my), perhaps as a result <strong>of</strong> selection for resistance to herbivory<br />
(LoDuca, Kluessendorf, <strong>and</strong> Mikulic 2003). In all, over 700 species are known from the fossil record,<br />
<strong>and</strong> fossil dasyclads are important tools for both biostratigraphic <strong>and</strong> paleoenvironmental studies<br />
(Berger <strong>and</strong> Kaever 1992; Bucur 1999). The present dasycladalean diversity consists <strong>of</strong> 37 species<br />
belonging to 10 genera <strong>and</strong> the two families Dasycladaceae <strong>and</strong> Polyphysaceae (Berger 2006).<br />
Molecular phylogenetic studies have shown that the Polyphysaceae arose from the Dasycladaceae,<br />
leaving the latter paraphyletic (Berger et al., 2003; Olsen et al., 1994; Zechman, 2003).<br />
Currently available phylogenetic studies <strong>of</strong> the siphonous <strong>green</strong> <strong>algae</strong> suffer from a few<br />
shortcomings. First, the studies have been based on single loci, yielding partially resolved trees with<br />
some unresolved taxa. Second, several important groups within the Bryopsidales have not been<br />
included. Finally, the temporal aspects <strong>of</strong> siphonous <strong>green</strong> algal diversification have not been<br />
explored in sufficient detail. Several recent studies point to the necessity <strong>of</strong> a time-calibrated<br />
phylogenetic framework. For example, the large discrepancy between species ages resulting from<br />
interpretations <strong>of</strong> <strong>molecular</strong> data <strong>and</strong> the fossil record creates confusion (Dragastan, Littler, <strong>and</strong><br />
Littler 2002; Kooistra, Coppejans, <strong>and</strong> Payri 2002). Furthermore, biogeographic interpretations are<br />
difficult without reference to a temporal framework (Verbruggen et al., 2005; Verbruggen et al.,<br />
2007). So far, the fossil record has been used on one occasion to calibrate a dasycladalean <strong>molecular</strong><br />
phylogeny in geological time (Olsen et al. 1994). In the years that have passed since the publication<br />
<strong>of</strong> this study, however, several important discoveries have been made in dasyclad paleontology (e.g.<br />
Kenrick <strong>and</strong> Li, 1998; LoDuca et al., 2003) <strong>and</strong> more advanced calibration methods have been<br />
developed (reviewed by e.g., Verbruggen <strong>and</strong> Theriot 2008).<br />
The present study sets out to achieve two goals. First, it aims to resolve the phylogeny <strong>of</strong> the<br />
siphonous <strong>green</strong> <strong>algae</strong> more fully <strong>and</strong> include previously omitted taxonomic groups. Second, it<br />
aspires to provide a temporal framework <strong>of</strong> siphonous <strong>green</strong> algal diversification by calibrating the<br />
phylogeny in geological time using information from the fossil record. Our approach consists <strong>of</strong><br />
model-based phylogenetic analyses <strong>of</strong> a five-locus alignment spanning both <strong>of</strong> the orders <strong>and</strong> uses a<br />
composite (partitioned) model <strong>of</strong> sequence <strong>evolution</strong>. Calibration <strong>of</strong> the phylogeny in geological time<br />
is achieved with Bayesian implementations <strong>of</strong> relaxed <strong>molecular</strong> clock models, using a selection <strong>of</strong><br />
fossil reference points.
94 CHAPTER 6<br />
Materials <strong>and</strong> methods<br />
Data generation<br />
In preparation for this study, the rbcL gene <strong>of</strong> a wide spectrum <strong>of</strong> taxa was sequenced as described<br />
below <strong>and</strong> additional rbcL sequences were downloaded from GenBank. From a neighbor joining<br />
guide tree produced from these sequences, 56 taxa representing all major clades were selected. For<br />
these taxa, we attempted to amplify four additional loci (plastid encoding atpB, tufA <strong>and</strong> 16S rDNA,<br />
<strong>and</strong> nuclear 18S rDNA) or downloaded this information from GenBank.<br />
DNA extraction followed a CTAB protocol modified from Doyle <strong>and</strong> Doyle (1987). DNA amplification<br />
followed previously published protocols (Famà et al., 2002; Hanyuda et al., 2000; Karol et al., 2001;<br />
Kooistra, 2002; Lam <strong>and</strong> Zechman, 2006; Olson et al., 2005; Wolf, 1997), with additional primers for<br />
amplification <strong>of</strong> partial sequences <strong>of</strong> the rbcL gene <strong>and</strong> the 16S rDNA. A complete overview <strong>of</strong> the<br />
primers used is given in Fig. 2. Newly generated sequences were submitted to GenBank. A complete<br />
list <strong>of</strong> Genbank accession numbers is provided in Table 1. Our specimens are vouchered in the Ghent<br />
University Herbarium or the US National Herbarium (see GenBank records for voucher information).<br />
The ulvophycean <strong>algae</strong> Trentepohlia aurea, Oltmannsiellopsis viridis, Ulva intestinalis, Ulothrix zonata<br />
<strong>and</strong> Pseudendoclonium akinetum were used as outgroup taxa (Lopez-Bautista <strong>and</strong> Chapman 2003).<br />
Despite the fact that the order Cladophorales is the closest relative <strong>of</strong> Bryopsidales <strong>and</strong> Dasycladales<br />
(Zechman et al. 1990), we did not use it as an outgroup because it has proven impossible to amplify<br />
chloroplast DNA in its members using st<strong>and</strong>ard primer combinations.<br />
Sequence alignment<br />
After removal <strong>of</strong> introns in the rbcL gene (Hanyuda, Arai, <strong>and</strong> Ueda 2000), all sequences were <strong>of</strong><br />
equal length <strong>and</strong> their alignment was unambiguous. The atpB sequences were <strong>of</strong> equal length <strong>and</strong><br />
their alignment was straightforward. The tufA gene was aligned by eye on the basis <strong>of</strong> the<br />
corresponding amino-acid sequences <strong>and</strong> ambiguous regions were removed. After introns had been<br />
removed, the 16S rDNA sequences were aligned using Muscle v. 3.6 using st<strong>and</strong>ard parameters<br />
(Edgar 2004). Ambiguous alignment regions were localized by eye <strong>and</strong> removed. Alignment <strong>of</strong> 18S<br />
rDNA sequences followed an analogous procedure. The insert near the 3' terminus <strong>of</strong> the 18S gene <strong>of</strong><br />
certain Bryopsidales (Dur<strong>and</strong> et al., 2002; Hillis et al., 1998; Kooistra et al., 1999) was removed<br />
because it was not present in all taxa <strong>and</strong> virtually impossible to align among genera. After removal<br />
<strong>of</strong> this region, sequences were aligned with Muscle v. 3.6 <strong>and</strong> stripped <strong>of</strong> their ambiguous regions.<br />
The concatenated alignment used for analysis is available through TreeBase <strong>and</strong> www.phycoweb.net.<br />
Partitioning <strong>and</strong> model selection<br />
Selection <strong>of</strong> a suitable partitioning strategy <strong>and</strong> suitable models for the various partitions used the<br />
Bayesian Information Criterion (BIC) as a selection criterion (e.g., Sullivan <strong>and</strong> Joyce 2005). The guide<br />
tree used during the entire procedure was obtained by maximum likelihood (ML) analysis <strong>of</strong> the<br />
concatenated data with a JC69 model with rate variation among sites following a discrete gamma
A MULTI-LOCUS TIME-CALIBRATED PHYLOGENY OF THE SIPHONOUS GREEN ALGAE 95<br />
distribution with 8 categories (JC69+Γ8) inferred with PhyML (Guindon <strong>and</strong> Gascuel 2003). All<br />
subsequent likelihood optimizations <strong>and</strong> BIC calculations were carried out with TreeFinder (Jobb, von<br />
Haeseler, <strong>and</strong> Strimmer 2004). Six alternative partitioning strategies were considered (see results).<br />
Per partitioning strategy, six substitution models were optimized with unlinked parameters between<br />
partitions <strong>and</strong> a partition rate multiplier (see results). The partitioning strategy + model combination<br />
receiving the lowest BIC score was used in the phylogenetic analyses documented below.<br />
Fig. 2. Primers used for amplification <strong>and</strong>/or sequencing <strong>of</strong> the five loci used in this study.
96 CHAPTER 6<br />
Phylogenetic analyses<br />
Phylogenetic analyses consisted <strong>of</strong> Bayesian inference (BI) <strong>and</strong> maximum likelihood tree searches<br />
using the unrooted partitioned model selected using the BIC procedure (section 2.3). For Bayesian<br />
inference, three independent runs, each consisting <strong>of</strong> four incrementally heated, Metropolis-coupled<br />
chains were run for ten million generations using MrBayes v. 3.1.2 (Ronquist <strong>and</strong> Huelsenbeck 2003).<br />
The default heating factor, priors, proposal mechanisms <strong>and</strong> other settings were used. Rate<br />
heterogeneity among partitions was modeled by using a variable rate prior. Parameter values <strong>and</strong><br />
trees were saved every thous<strong>and</strong> generations. Convergence <strong>and</strong> stationarity <strong>of</strong> the runs was assessed<br />
using Tracer v. 1.4 (Rambaut <strong>and</strong> Drummond 2007). An appropriate burn-in value was determined<br />
with the automated method proposed by Beiko et al. (2006). Their method was applied to each run<br />
individually, with a sliding window <strong>of</strong> 100 samples. The post-burnin trees from different runs were<br />
concatenated <strong>and</strong> summarized using MrBayes' sumt comm<strong>and</strong>.<br />
Maximum likelihood tree searches were carried out with TreeFinder, which allows likelihood tree<br />
searches under partitioned models (Jobb, von Haeseler, <strong>and</strong> Strimmer 2004). Tree space coverage in<br />
the TreeFinder program is low compared to other ML programs. Therefore, an analysis pipeline was<br />
created to increase tree space coverage by running analyses from many start trees. First, a set <strong>of</strong><br />
start trees was created by r<strong>and</strong>omly modifying the guide tree used for model selection by 100 <strong>and</strong><br />
200 nearest neighbor interchange (NNI) steps (50 replicates each). Analyses were run from these 100<br />
start trees. The 3 trees yielding the highest likelihood were used as the starting point for another set<br />
<strong>of</strong> NNI modifications <strong>of</strong> 20 <strong>and</strong> 50 steps (50 replicates each). A second set <strong>of</strong> ML searches was run<br />
from each <strong>of</strong> the resulting 300 start trees. The ML tree resulting from this set <strong>of</strong> analyses was<br />
retained as the overall ML solution. The same partitions <strong>and</strong> models as in the BI analysis were used,<br />
with the second-level tree search <strong>and</strong> proportional partition rates. Branch support was calculated<br />
using the bootstrap resampling method (1000 pseudo-replicates). Bootstrap analyses used the same<br />
settings but started from the ML tree.<br />
Relaxed <strong>molecular</strong> clock<br />
Likelihood ratio tests significantly rejected a strict (uniform) <strong>molecular</strong> clock for the alignment. Node<br />
age estimates were therefore obtained by fitting a relaxed clock model to our <strong>molecular</strong> data. The<br />
assumption <strong>of</strong> the <strong>molecular</strong> clock was relaxed by allowing rates <strong>of</strong> <strong>molecular</strong> <strong>evolution</strong> to vary along<br />
the tree according to a Brownian motion model (Kishino et al., 2001; Thorne et al., 1998). First, an<br />
F84 model with rate variation across sites following a discrete gamma distribution with 20 rate<br />
categories was optimized in PAML v.4 (Yang 2007), using the topology obtained with Bayesian<br />
inference from which all but two outgroup taxa were removed (Trentepohlia <strong>and</strong> Oltmannsiellopsis).<br />
Second, a variance-covariance matrix was built with estbNew from the T3 package (Thorne et al.<br />
1998; http://abacus.gene.ucl.ac.uk/s<strong>of</strong>tware.html). Finally, node age estimates were obtained by<br />
running three independent MCMC chains with the PhyloBayes program (Lartillot, Blanquart, <strong>and</strong><br />
Lepage 2007) on the variance-covariance matrix, using the lognormal auto-correlated clock model.<br />
Sensitivity analyses were carried out to evaluate the impact <strong>of</strong> some potentially erroneous fossil<br />
assignments with chains <strong>of</strong> 50,000 generations that were sampled every 100th generation. The final<br />
analysis consisted <strong>of</strong> three independent runs <strong>of</strong> 1,000,000 generations, sampled every 100th
A MULTI-LOCUS TIME-CALIBRATED PHYLOGENY OF THE SIPHONOUS GREEN ALGAE 97<br />
generation. Convergence <strong>and</strong> stationarity <strong>of</strong> the chains was evaluated by plotting trace files in Tracer<br />
v. 1.4 (Rambaut <strong>and</strong> Drummond 2007). The fossils used as calibration points are documented in the<br />
results section.<br />
Results<br />
Data exploration<br />
The data compiled for our analyses consisted <strong>of</strong> 155 sequences. The resulting five-locus data matrix<br />
was 51% filled. The rbcL gene was best represented (90% filled), followed by 18S rDNA (62%), tufA<br />
(49%), 16S rDNA (33%) <strong>and</strong> atpB (20%). After ambiguously aligned parts had been removed, the<br />
matrix measured 61 taxa by 5588 characters. The 18S rDNA provided most characters (1555 bp),<br />
followed by rbcL (1386 bp), 16S rDNA (1327 bp), tufA (804 bp) <strong>and</strong> atpB (516 bp).<br />
The BIC-based model selection procedure selected a model with four partitions <strong>and</strong> GTR+Γ8<br />
substitution models for each partition (Table 2). The four partitions were: (1) ribosomal loci: 18S <strong>and</strong><br />
16S, (2) first codon positions <strong>of</strong> rbcL, tufA <strong>and</strong> atpB combined, (3) second codon positions <strong>of</strong> the<br />
three genes, <strong>and</strong> (4) third codon positions <strong>of</strong> the three genes.<br />
<strong>Phylogeny</strong> <strong>of</strong> the siphonous <strong>algae</strong><br />
Different runs <strong>of</strong> the Bayesian phylogenetic analysis <strong>of</strong> the five-locus dataset under an unrooted<br />
partitioned model rapidly converged onto highly similar posterior distributions. The chains reached<br />
convergence after at most 384,000 generations. The analyses resulted in a well-resolved<br />
phylogenetic hypothesis <strong>of</strong> the siphonous <strong>green</strong> <strong>algae</strong> (Fig. 3A). The backbone <strong>of</strong> the dasycladalean<br />
clade was determined with high confidence except for the branching order between the Bornetella<br />
lineage, the Cymopolia-Neomeris clade <strong>and</strong> the Polyphysaceae. Relationships among Acetabularia<br />
species are not resolved with our dataset. In the Bryopsidales, three main clades were inferred, two<br />
<strong>of</strong> which correspond to previously described suborders (Bryopsidineae <strong>and</strong> Halimedineae). A third<br />
lineage contained only the limestone-boring genus Ostreobium. Relationships among the three<br />
families <strong>of</strong> the Bryopsidineae were inferred with high confidence (Fig. 3B) whereas within the<br />
Halimedineae, relationships among what we will refer to as the "core Halimedineae" (families<br />
Caulerpaceae, Rhipiliaceae, Halimedaceae, Pseudocodiaceae <strong>and</strong> Udoteaceae) remained poorly<br />
resolved (Fig. 3C).
98 CHAPTER 6<br />
Fig 3. Phylogenetic relationships among the siphonous <strong>green</strong> <strong>algae</strong> inferred from a five-locus DNA alignment<br />
using Bayesian analysis under a partitioned, unrooted model. A. Majority-rule consensus phylogram <strong>of</strong> postburnin<br />
trees. B. Relationships among families <strong>of</strong> the Bryopsidineae. C. Relationships among families <strong>of</strong> the core<br />
Halimedineae. Numbers at nodes indicate statistical support, posterior probabilities before the dash <strong>and</strong> ML<br />
bootstrap proportions after (both given as percentages). Encircled letters indicate calibration points (Table 3).<br />
The scale bar only applies to panel A.
Time-calibrated phylogeny<br />
A MULTI-LOCUS TIME-CALIBRATED PHYLOGENY OF THE SIPHONOUS GREEN ALGAE 99<br />
We compiled a list <strong>of</strong> fossils that are thought to represent early records <strong>of</strong> lineages observed in our<br />
phylogenetic tree (Table 3). Prior to carrying out the main calibration analysis, we ran several<br />
analyses to test the sensitivity <strong>of</strong> results to the choice <strong>of</strong> certain fossils as calibration points <strong>and</strong> <strong>of</strong><br />
the maximum age constraint imposed on the root <strong>of</strong> the siphonous <strong>algae</strong>. The exact combination <strong>of</strong><br />
constraints used in these trial runs can be found in the online appendix.<br />
Analyses with Dimorphosiphon (min. 460.9 my) constrained at node f resulted in considerably older<br />
node age estimates throughout the tree than analyses in which this constraint was not imposed.<br />
Dimorphosiphon has been regarded as an ancestral taxon <strong>of</strong> the Halimedineae (Dragastan, Littler,<br />
<strong>and</strong> Littler 2002) but its combination <strong>of</strong> characters did not allow unambiguous placement on any<br />
node <strong>of</strong> the tree. From the incompatibility <strong>of</strong> this calibration point with the others, we concluded<br />
that our admittedly speculative assignment <strong>of</strong> this taxon to node f was unjustified. With<br />
Dimorphosiphon excluded from analyses, various combinations <strong>of</strong> the remaining calibration points<br />
led to very similar results.<br />
The analysis was sensitive to the maximum age constraint imposed on the phylogeny. By default, we<br />
used a maximum age constraint <strong>of</strong> 635 my on the root <strong>of</strong> the siphonous <strong>algae</strong> (node a) because there<br />
is no clear evidence for either Bryopsidales or Dasycladales in Ediacaran Konservat-Lagerstätten, in<br />
which macro<strong>algae</strong> are abundant <strong>and</strong> well preserved (Xiao et al., 2002; Zhang et al., 1998). These<br />
deposits do, however, contain simple cylindrical <strong>and</strong> spherical forms (e.g., Sinospongia,<br />
Beltanelliformis) that may be ancestral to these extant lineages (Xiao et al. 2002). Changing the<br />
maximum age constraint to 800 my as a sensitivity experiment increased average node ages <strong>and</strong><br />
widened their 95% confidence intervals. Analogously, lowering the maximum age constraint to 500<br />
my decreased the average ages <strong>and</strong> narrowed the confidence intervals. The chronogram presented<br />
in Fig. 4 resulted from the analysis without Dimorphosiphon <strong>and</strong> with a maximum age constraint <strong>of</strong><br />
635 my; more specifically, the analysis was carried out with calibration points a1, a2, b1, c, d2, e1 <strong>and</strong><br />
h1 (Table 3). Repeating this analysis without age constraint on node b resulted in a chronogram that<br />
was very similar.<br />
As an alternative strategy to using a maximum age constraint on the root <strong>of</strong> the siphonous <strong>algae</strong><br />
(node a), we constrained the age <strong>of</strong> node b to be Early Devonian (416.0–397.5 my) based on the first<br />
occurrence <strong>of</strong> fossils with thalli comparable to those <strong>of</strong> Dasycladaceae, in terms <strong>of</strong> both general<br />
thallus form <strong>and</strong> reproductive structures, in strata <strong>of</strong> this age (Uncatoella: Kenrick <strong>and</strong> Li, 1998). This<br />
analysis, which is illustrated in the online appendix, should be regarded as a conservative alternative<br />
to the analysis presented in Fig. 4 <strong>and</strong> node ages in this chronogram should be interpreted as<br />
minimum values rather than realistic estimates. We will use the chronogram in Fig. 4 as the preferred<br />
reference time frame for the remainder <strong>of</strong> the paper because the maximum age constraint used for<br />
this analysis has an empirical basis (although it is based on absence <strong>of</strong> evidence rather than evidence<br />
<strong>of</strong> absence) <strong>and</strong> because we consider the intermediate-sized confidence intervals on the node ages<br />
<strong>of</strong> this tree to yield a fairly realistic image <strong>of</strong> the true uncertainty surrounding the node ages. In what<br />
follows, we report node age estimates as the mean node age followed by the 95% confidence<br />
interval in square brackets.
100 CHAPTER 6<br />
The origin <strong>of</strong> the orders Dasycladales <strong>and</strong> Bryopsidales was inferred to be in the Neoproterozoic (571<br />
my [628–510]). The earliest divergence between extant Dasycladaceae lineages occurred during the<br />
Ordovician or Silurian (458 my [517–407]) <strong>and</strong> the family diversified into its main extant lineages<br />
during the Devonian. The Polyphysaceae originated from the Dasycladaceae during the second half<br />
<strong>of</strong> the Paleozoic (367 my [435–306]). In the Bryopsidales, the suborders Bryopsidineae <strong>and</strong><br />
Halimedineae diverged from each other in the Early Paleozoic (456 my [511–405]) <strong>and</strong> diversified<br />
into their component families during the second half <strong>of</strong> the Paleozoic. The families belonging to the<br />
core Halimedineae appear to have diverged from one another during the Permian.<br />
Discussion<br />
Taxonomic implications<br />
The increased sampling <strong>of</strong> taxa <strong>and</strong> loci compared to previous studies has produced some results<br />
that deserve mention from a taxonomic viewpoint. First, the lineage leading to the limestone-boring<br />
genus Ostreobium seems to deserve recognition at the suborder level, hence the tentative clade<br />
name Ostreobidineae. The bryopsidalean family Udoteaceae disintegrates. Besides the transfer <strong>of</strong><br />
Avrainvillea <strong>and</strong> Cladocephalus to the Dichotomosiphonaceae, which was previously indicated by<br />
Curtis et al. (2008), a number <strong>of</strong> Rhipilia <strong>and</strong> Rhipiliopsis species form a lineage <strong>of</strong> their own <strong>and</strong> the<br />
remainder <strong>of</strong> the Udoteaceae receives little statistical phylogenetic support. We have applied the<br />
name Rhipiliaceae to the clade <strong>of</strong> Rhipilia <strong>and</strong> Rhipiliopsis species. This family name was proposed<br />
earlier but its phylogenetic relevance had not yet been demonstrated (Dragastan et al. 1997;<br />
Dragastan <strong>and</strong> Richter 1999). The same authors proposed the family Avrainvilleaceae to harbor the<br />
extant genera Avrainvillea <strong>and</strong> Cladocephalus <strong>and</strong> some fossil genera. However, the ultrastructural<br />
affinities between Dichotomosiphon, Avrainvillea <strong>and</strong> Cladocephalus (Curtis, Dawes, <strong>and</strong> Pierce 2008)<br />
<strong>and</strong> the limited DNA sequence divergence between Dichotomosiphon <strong>and</strong> Avrainvillea shown here<br />
suggest that transferring Avrainvillea <strong>and</strong> Cladocephalus to the Dichotomosiphonaceae would be<br />
more appropriate. Although the fossil taxa in the Avrainvilleaceae are more difficult to evaluate<br />
because no ultrastructural evidence is available to link them unequivocally to the<br />
Dichotomosiphonaceae, we nevertheless propose their transfer to this family for taxonomic<br />
convenience. We refrain from formally describing a suborder Ostreobidineae for Ostreobium because<br />
we feel that the description <strong>of</strong> such high-level taxa should be accompanied by detailed ultrastructural<br />
observations.<br />
Our results for the phylogeny <strong>of</strong> the Dasycladales are consistent with previous studies <strong>and</strong> do not add<br />
much insight into their pattern <strong>of</strong> diversification. One thing worth mentioning is that the close<br />
relationship between Batophora <strong>and</strong> Chlorocladus, which was suggested by previous <strong>molecular</strong><br />
phylogenetic studies (Olsen et al. 1994; Zechman 2003), is confirmed by our multi-locus dataset. As<br />
reported in the aforementioned papers, this finding contradicts the traditional tribe-level<br />
classification by Berger <strong>and</strong> Kaever (1992).
A MULTI-LOCUS TIME-CALIBRATED PHYLOGENY OF THE SIPHONOUS GREEN ALGAE 101<br />
Fig. 4. Chronogram <strong>of</strong> the siphonous <strong>green</strong> <strong>algae</strong>. Node ages were inferred using Bayesian inference assuming a<br />
relaxed <strong>molecular</strong> clock <strong>and</strong> a set <strong>of</strong> node age constraints derived from the fossil record. Values at nodes<br />
indicate average node ages <strong>and</strong> bars represent 95% confidence intervals. The calibration points used for this<br />
analysis are a1, a2, b1, c, d2, e1 <strong>and</strong> h1 (Table 3).
102 CHAPTER 6<br />
Dasycladalean diversification<br />
Of the five dasycladalean families, only Dasycladaceae <strong>and</strong> Polyphysaceae have recent<br />
representatives <strong>and</strong> Seletonellaceae, Triploporellaceae <strong>and</strong> Diploporellaceae are entirely extinct<br />
(Berger <strong>and</strong> Kaever 1992). The Seletonellaceae includes the oldest fossils assigned to Dasycladales,<br />
Yakutina aciculata from the Middle Cambrian (Kordé 1973; Riding 1994; Riding 2001) <strong>and</strong> Seletonella<br />
mira from the Upper Cambrian (Kordé 1950a; Riding 1994; Riding 2001). Cambroporella from the<br />
Lower Cambrian <strong>of</strong> Tuva, was initially described as a dasyclad (Kordé 1950b) but was reinterpreted as<br />
a probable bryozoan (Elias 1954). Unlike living dasyclads, Seletonellaceae contained gametes within<br />
the main axis (endospore reproduction) as opposed to within gametophores (sensu Dumais <strong>and</strong><br />
Harrison 2000), <strong>and</strong> developed laterals irregularly along the length <strong>of</strong> the main axis (aspondyl<br />
structure), rather than in whorls as is the case in living representatives (euspondyl structure).<br />
Nonetheless, two lines <strong>of</strong> evidence support a dasyclad affinity for the Seletonellaceae. First, in terms<br />
<strong>of</strong> reproduction, development <strong>of</strong> reproductive cysts within the main axis is known as a teratology<br />
among living dasyclads (Valet 1968) <strong>and</strong> all living dasyclads pass through an "endospore stage" as<br />
swarms <strong>of</strong> haploid secondary nuclei generated by meiosis <strong>of</strong> the large primary nucleus in the rhizoid<br />
migrate upward through the main axis towards the gametophores (Elliott 1989; Berger <strong>and</strong> Kaever<br />
1992). Second, an aspondyl structure is a predicted outcome <strong>of</strong> a detailed reaction-diffusion model<br />
<strong>of</strong> dasyclad whorl morphogenesis (Dumais <strong>and</strong> Harrison 2000).<br />
Our chronogram suggests a late Neoproterozoic origin for the Dasycladales, with the 95% confidence<br />
interval ranging into the Cambrian: 571 my [628–510] (Fig. 4). The upper boundary on this node age<br />
(628 my) should not be overinterpreted because it is largely determined by the upper age constraint<br />
on this node (635 my). The Middle Cambrian lower boundary on this node age (510 my), however,<br />
can be taken as a fairly safe minimum age estimate for the Dasycladales as well as the Bryopsidales.<br />
Unlike Yakutina <strong>and</strong> Seletonella, most early Paleozoic dasyclad taxa did not biomineralize (LoDuca,<br />
Kluessendorf, <strong>and</strong> Mikulic 2003). This fact, when taken together with the results <strong>of</strong> the present<br />
analysis, suggests that noncalcified dasyclads may yet be discovered within Konservat-Lagerstätten <strong>of</strong><br />
latest Neoproterozoic or Early Cambrian age.<br />
Taxa assigned to Dasycladales are both abundant <strong>and</strong> diverse in Ordovician strata, <strong>and</strong> include<br />
euspondyl (e.g., Chaetocladus) as well as aspondyl (e.g., Dasyporella) forms (Berger <strong>and</strong> Kaever,<br />
1992; LoDuca, 1997; LoDuca et al., 2003). The earliest euspondyl forms, like aspondyl taxa, were<br />
endospore. Later, however, at least one lineage <strong>of</strong> euspondyl forms emerged in which<br />
gametogenesis occurred within the laterals (cladospore reproduction). Collectively, endospore <strong>and</strong><br />
cladospore taxa with a euspondyl structure comprise the family Triploporellaceae (Berger <strong>and</strong> Kaever<br />
1992; LoDuca 1997). Triploporellaceae are though to have originated from the Seletonellaceae,<br />
indicating that the latter is a paraphyletic group.<br />
The family Dasycladaceae is characterized by euspondyl thalli with spherical gametophores along the<br />
sides or tips <strong>of</strong> laterals (choristospore reproduction). It is though to have originated from the<br />
Triploporellaceae, in which case the latter group, like Seletonellaceae, is paraphyletic. Studies<br />
indicate that the dasycladacean gametophore, rather than being a modified lateral, is instead a<br />
separate structure with its own morphogenetic identity (Dumais <strong>and</strong> Harrison 2000). The oldest<br />
taxon with gametophores <strong>and</strong> associated reproductive cysts comparable to those <strong>of</strong> living<br />
Dasycladaceae is Uncatoella verticillata from the Lower Devonian (416–397 my) <strong>of</strong> China (Kenrick
A MULTI-LOCUS TIME-CALIBRATED PHYLOGENY OF THE SIPHONOUS GREEN ALGAE 103<br />
<strong>and</strong> Li 1998). This taxon is somewhat problematic, however, in that the asymmetrical manner <strong>of</strong><br />
lateral branching <strong>and</strong> instances <strong>of</strong> pseudodichotomies <strong>of</strong> the main axis are otherwise unknown<br />
among dasyclads (Kenrick <strong>and</strong> Li 1998). Uncatoella is the only taxon known from Paleozoic strata<br />
with gametophores <strong>and</strong> associated reproductive cysts comparable to those <strong>of</strong> living Dasycladaceae.<br />
Our <strong>molecular</strong> results suggest that the earliest divergence between the extant Dasycladaceae<br />
lineages occurred during the Ordovician or Silurian (458 my [517-407]). Notably, this result emerges<br />
regardless <strong>of</strong> whether Uncatoella is used to constrain the minimum age <strong>of</strong> node b.<br />
Archaeobatophora, from the Upper Ordovician <strong>of</strong> Michigan (Nitecki 1976), is <strong>of</strong> interest in this<br />
regard, as it bears a striking resemblance to the vegetative thallus <strong>of</strong> the extant dasycladacean<br />
Batophora. However, gametophores are not present among the few known specimens (all on a single<br />
small slab), <strong>and</strong> thus the status <strong>of</strong> this form as an early dasycladacean remains uncertain. Our results<br />
suggest that the main extant lineages belonging to the Dasycladaceae originated during the<br />
Devonian. This is somewhat older than expected because, with the possible exception <strong>of</strong> the<br />
Batophoreae (Archaeobatophora), the oldest fossils assigned to extant tribes within the<br />
Dasycladaceae are from the Mesozoic (Berger <strong>and</strong> Kaever 1992). Similarly, the age estimate for the<br />
split between Cymopolia <strong>and</strong> Neomeris, two calcified genera known from numerous occurrences in<br />
the fossil record, is somewhat older than anticipated: 211 my [300–152] vs. a Barremian age for the<br />
earliest Neomeris fossil (130–125 my) (Sotak <strong>and</strong> Misik 1993). Two factors could explain these<br />
discrepancies. First, it is possible that many early Dasycladaceae did not biomineralize. This is<br />
certainly true for most early Triploporellaceae <strong>and</strong> Selenonellaceae (LoDuca, Kluessendorf, <strong>and</strong><br />
Mikulic 2003), <strong>and</strong> applies to Uncatoella <strong>and</strong> several living Dasycladaceae as well (e.g., Batophora).<br />
The lack <strong>of</strong> biomineralization would have severely limited the preservation potential <strong>of</strong> these taxa.<br />
Second, it may be that some Paleozoic <strong>and</strong> early Mesozoic calcified taxa previously inferred on the<br />
basis <strong>of</strong> lateral morphology to have been endospore or cladospore were in fact choristospore. A<br />
choristospore condition for such forms could be masked if calcification was restricted to the<br />
outermost part <strong>of</strong> the thallus, beyond the level <strong>of</strong> the gametophores, as is known for the living taxon<br />
Bornetella.<br />
The family Polyphysaceae is characterized by the development <strong>of</strong> clavate gametophores arranged in<br />
whorls (Berger <strong>and</strong> Kaever 1992; Berger et al. 2003). The distinctive gametophores <strong>of</strong> this group<br />
appear to have originated through modification <strong>of</strong> the spherical gametophores <strong>of</strong> Dasycladaceae<br />
(Dumais <strong>and</strong> Harrison 2000). Our results suggest that the Polyphysaceae originated <strong>and</strong> began their<br />
diversification in the second half <strong>of</strong> the Paleozoic. An Early Carboniferous origin <strong>of</strong> the family had<br />
been suggested based on the fossil taxon Masloviporella (Del<strong>of</strong>fre 1988; Berger <strong>and</strong> Kaever 1992).<br />
Eoclypeina <strong>and</strong> Clypeina are taxa classified as polyphysaceans from the Permian <strong>and</strong> Triassic,<br />
respectively (Berger <strong>and</strong> Kaever 1992). The extant polyphysacean Halicoryne has been reported from<br />
the Triassic (Misik, 1987; Tomasovych, 2004). However, because these reports are based solely on<br />
isolated reproductive elements, both the genus- <strong>and</strong> family-level assignment <strong>of</strong> this material must be<br />
regarded as tentative (Barattolo <strong>and</strong> Romano 2005).<br />
According to the <strong>molecular</strong> clock results, the polyphysacean taxon Acetabularia originated as early as<br />
the early Mesozoic. The oldest Acetabularia fossils, however, are from the Oligocene (Berger <strong>and</strong><br />
Kaever 1992). Here, too, this discrepancy may reflect poor representation <strong>of</strong> the group in the fossil<br />
record, as living members <strong>of</strong> the genus are only very weakly calcified. Material from Mesozoic-age
104 CHAPTER 6<br />
strata has been assigned to the closely related extant taxon Acicularia (Iannace, Radiocic, <strong>and</strong><br />
Zamparelli 1998). As is the case for reports <strong>of</strong> Halicoryne from the Triassic, however, such an<br />
assignment must be regarded as equivocal because the material at h<strong>and</strong> comprises only isolated<br />
reproductive elements (Barattolo <strong>and</strong> Romano 2005).<br />
Overall, the results <strong>of</strong> the relaxed <strong>molecular</strong> clock analysis line up rather well against major aspects<br />
<strong>of</strong> dasyclad <strong>evolution</strong> inferred from the dasyclad fossil record. Nonetheless, our results indicate that<br />
the fossil record <strong>of</strong> certain aspects <strong>of</strong> the <strong>evolution</strong>ary history <strong>of</strong> the Dasycladaceae may be more<br />
incomplete than previously suspected (see Kenrick <strong>and</strong> Li 1998). The node age estimates obtained in<br />
our relaxed <strong>molecular</strong> clock analysis are older than those recovered by Olsen et al. (1994). Causes for<br />
this discrepancy are difficult to pinpoint because differences between the studies are manifold: the<br />
<strong>molecular</strong> clock method, calibration technique, <strong>molecular</strong> dataset <strong>and</strong> selection <strong>of</strong> fossils all differ.<br />
Whereas the previous study relied exclusively on 18S rDNA sequences, our dataset includes several<br />
additional loci, which should yield more reliable results (Magallón <strong>and</strong> S<strong>and</strong>erson 2005).<br />
Furthermore, at the time the previous study was published, only uniform (strict) <strong>molecular</strong> clock<br />
methods were available. Based on our alignment, 18S rDNA violates the uniform <strong>molecular</strong> clock<br />
(LRT: –2 lnL = 399.403, p < 0.0001), a statement also true for the other loci in our dataset. As a<br />
consequence, node age estimates from our analysis with relaxed <strong>molecular</strong> clock models should<br />
match the true divergence times more closely. The calibration method differs in that fossils are used<br />
as minimum age estimates for stem groups in our analyses, whereas they were used as point<br />
estimates to determine the rate <strong>of</strong> 18S rDNA <strong>evolution</strong> in Olsen et al. (1994). Finally, we use a more<br />
extensive list <strong>of</strong> fossil calibration points, including some recently described fossils that represent<br />
older occurrences <strong>of</strong> some dasyclad clades. Several <strong>of</strong> the aspects mentioned above would predict<br />
our age estimates to be older than those <strong>of</strong> Olsen et al. (1994), which is in agreement with the<br />
empirical results.<br />
Bryopsidalean diversification<br />
The fossil record <strong>of</strong> the Bryopsidales is not as well characterized as that <strong>of</strong> the Dasycladales. Many<br />
fossil taxa that are generally considered to belong to the order have been described (reviewed by<br />
Bassoullet et al., 1983; Dragastan et al., 1997; Dragastan <strong>and</strong> Schlagintweit, 2005), but the taxonomic<br />
placement <strong>of</strong> these taxa is <strong>of</strong>ten ambiguous (Mu 1990). Dragastan <strong>and</strong> Schlagintweit (2005)<br />
presented an <strong>evolution</strong>ary scenario <strong>of</strong> bryopsidalean diversification based on their interpretation <strong>of</strong><br />
calcified fossil taxa. They proposed a temporal succession <strong>of</strong> three main lineages. The primitive<br />
Dimorphosiphonaceae, characterized by a single medullar siphon <strong>and</strong> a simple cortex, originated in<br />
the Neoproterozoic or early Paleozoic <strong>and</strong> persisted through the Devonian (± 360 my). The<br />
Protohalimedaceae, characterized by multiple medullar siphons <strong>and</strong> a cortex <strong>of</strong> variable complexity,<br />
diverged from the Dimorphosiphonaceae in the early Silurian (± 440 my) <strong>and</strong> thrived up to the PTboundary<br />
(± 250 my), when it suffered major losses, <strong>and</strong> continued into the Mesozoic to go extinct<br />
during the Cretaceous. The extant family Halimedaceae, which features multiple medullar siphons<br />
<strong>and</strong> a complex cortex, was thought to have diverged from the Protohalimedaceae in the second half<br />
<strong>of</strong> the Permian (270–250 my) <strong>and</strong> diversified through the Mesozoic <strong>and</strong> Cenozoic.
A MULTI-LOCUS TIME-CALIBRATED PHYLOGENY OF THE SIPHONOUS GREEN ALGAE 105<br />
In our opinion, relationships between fossil taxa <strong>and</strong> lineages in the phylogeny <strong>of</strong> extant taxa are not<br />
evident. This uncertainty is reflected in our study by the lower number <strong>of</strong> fossil calibration points<br />
used within the Bryopsidales. Our time-calibrated phylogeny indicates that after the initial<br />
diversification <strong>of</strong> the order into its suborders during the early Paleozoic, current families originated in<br />
the second half <strong>of</strong> the Paleozoic. It also suggests that calcification is a relatively recent phenomenon<br />
in the extant lineages <strong>of</strong> the Bryopsidales because the Halimedaceae <strong>and</strong> Udoteaceae, the only<br />
extant families with calcified, corticated representatives, originated during the Permian (± 300–250<br />
my) <strong>and</strong> diversified during the Mesozoic (Fig. 4). All other lineages <strong>of</strong> the Halimedineae, including<br />
some recently discovered lineages (Verbruggen et al. 2009), are not calcified. As a consequence, the<br />
presence <strong>of</strong> the calcified, corticated families Dimorphosiphonaceae <strong>and</strong> Protohalimedaceae in older<br />
deposits is difficult to interpret in the context <strong>of</strong> our phylogeny. Based on our results, the classical<br />
paleontological interpretation that the Dimorphosiphonaceae <strong>and</strong> Protohalimedaceae are direct<br />
ancestral forms <strong>of</strong> the serial-segmented Halimedaceae seems doubtful. First, our phylogenetic results<br />
show no indication <strong>of</strong> the presence <strong>of</strong> calcification in Bryopsidales prior to the Permian. Second, it<br />
follows from our phylogeny that the internal architecture <strong>of</strong> thalli was relatively simple up until the<br />
late Paleozoic. Thalli consisting <strong>of</strong> a medulla <strong>and</strong> a cortex appear to have evolved from simple,<br />
siphonous thalli several times independently during the Permian–Triassic period. They evolved once<br />
in the Bryopsidineae (Codium), a second time in the Dichotomosiphonaceae (Avrainvillea) <strong>and</strong> a third<br />
time in the core Halimedineae (Halimedaceae, Udoteaceae, Pseudocodiaceae).<br />
Some alternative hypotheses may be posited to explain this disparity <strong>of</strong> results, all <strong>of</strong> which should<br />
be regarded as speculative. Assuming that the Dimorphosiphonaceae <strong>and</strong> Protohalimedaceae are<br />
genuine Bryopsidales, these two families could very well represent an early-diverging bryopsidalean<br />
lineage that went extinct. Alternatively, they could represent a collection <strong>of</strong> taxa that branched <strong>of</strong>f at<br />
various places along the lineage leading from the origin <strong>of</strong> the Halimedineae to the Halimedaceae<br />
<strong>and</strong> Udoteaceae.<br />
Perspectives<br />
The genera Codium <strong>and</strong> Halimeda have been proposed as model systems for studying marine algal<br />
speciation, biogeography <strong>and</strong> macro<strong>evolution</strong> (Kooistra et al., 2002; Verbruggen et al., 2007). Both<br />
these genera are species-rich, ecologically diverse <strong>and</strong> geographically widespread, making them ideal<br />
case studies for a spectrum <strong>of</strong> <strong>evolution</strong>ary questions. Furthermore, these genera contrast in their<br />
climatic preferences, Halimeda being mostly tropical <strong>and</strong> Codium being more diverse in temperate<br />
seas. Further development <strong>of</strong> these case studies will greatly benefit from the temporal framework<br />
provided here. Both genera diverged from their respective sister lineages in the late Paleozoic<br />
(Halimeda: 273 my [327–223]; Codium: 307 my [370–245]). The most recent common ancestor <strong>of</strong> the<br />
extant species in both genera are highly comparable <strong>and</strong> can be situated in the Late Jurassic – Early<br />
Cretaceous (Halimeda: 147 my [198–103]; Codium: 153 my [217–97]). To get an initial idea <strong>of</strong> the<br />
time-frame <strong>of</strong> <strong>evolution</strong>ary diversification we have included representatives <strong>of</strong> each <strong>of</strong> the five<br />
sections <strong>of</strong> Halimeda (Verbruggen <strong>and</strong> Kooistra 2004) <strong>and</strong> each <strong>of</strong> the three major lineages <strong>of</strong> Codium<br />
(Verbruggen et al. 2007). It follows from our results that both genera spawned their major extant<br />
lineages during the Cretaceous. This close match between the timeframes <strong>of</strong> <strong>evolution</strong>ary<br />
diversification <strong>of</strong> both genera is convenient for comparative studies between them.
106 CHAPTER 6<br />
One advantage <strong>of</strong> using the calcified genus Halimeda as a model for marine <strong>evolution</strong> is that<br />
phylogenetic results can be contrasted with its extensive fossil record. An initial comparison <strong>of</strong> our<br />
results to interpretations <strong>of</strong> the fossil record marks a different timeframe <strong>of</strong> diversification: whereas<br />
the fossil record suggests diversification <strong>of</strong> the genus into its main lineages (taxonomic sections) in<br />
the Eocene (roughly 56–34 my) (Dragastan <strong>and</strong> Herbig 2007), our results indicate a considerably<br />
older, Cretaceous divergence (between approximately 147 <strong>and</strong> 97 my). The contradiction <strong>of</strong> these<br />
results cannot be explained at present, but three hypotheses are suggested. First, a deviation <strong>of</strong> the<br />
true <strong>molecular</strong> <strong>evolution</strong>ary process from the relaxed <strong>molecular</strong> clock model used here could cause<br />
the contradiction. Second, misinterpretation <strong>of</strong> the fossil record used to calibrate our tree may be at<br />
the basis. Third, a significant gap could be present in the fossil record. To distinguish between these<br />
alternative scenarios, additional paleontological as well as <strong>molecular</strong> phylogenetic research is<br />
needed. Paleontologists should document additional time-series in the fossil record, especially<br />
through the Cretaceous <strong>and</strong> Paleogene systems (145–23 my). Molecular systematists should evaluate<br />
the fit <strong>of</strong> different clock relaxation models to the <strong>molecular</strong> data (e.g., Lepage et al. 2007) <strong>and</strong> take<br />
different calibration approaches, either top-down (as was done here) or bottom-up (from calibration<br />
points within the genus).<br />
The literature on the genus Halimeda is marked by a contradiction <strong>of</strong> species ages inferred from<br />
paleontological <strong>and</strong> <strong>molecular</strong> phylogenetic data. In the paleontological literature, extant species are<br />
commonly reported from Miocene (> 5 my) <strong>and</strong> Paleogene deposits (> 23 my), <strong>and</strong> some are even<br />
thought to date back to the Triassic (> 200 my) (Dragastan, Littler, <strong>and</strong> Littler 2002; Dragastan <strong>and</strong><br />
Herbig 2007). In contrast, interpretation <strong>of</strong> vicariance patterns in <strong>molecular</strong> phylogenetic trees<br />
implied that extant species were younger than 3 my, <strong>and</strong> reports <strong>of</strong> extant species in the fossil record<br />
were interpreted as the result <strong>of</strong> iterative convergent <strong>evolution</strong> (Kooistra, Coppejans, <strong>and</strong> Payri<br />
2002). Because <strong>of</strong> this possibility, we have not used any calibration points within the genus; only its<br />
earliest appearance was used to calibrate the clock. Even though the present study was not designed<br />
to answer questions about species ages in Halimeda, we can glean some information from its results.<br />
These indicate that the five sections <strong>of</strong> Halimeda diverged from one another during the first half <strong>of</strong><br />
the Cretaceous (between approximately 147 <strong>and</strong> 97 my). Because each <strong>of</strong> the sections diversified<br />
relatively soon after they originated, we conclude that species ages must be considerably older than<br />
implied by Kooistra et al. (2002). This result also implies that the iterative morphological convergence<br />
hypothesis should be re-evaluated. It should be clear that we do not imply that the hypothesis is<br />
false, <strong>and</strong> records <strong>of</strong> extant species in Miocene <strong>and</strong> older sediments should certainly not be accepted<br />
without scrutiny. For example, Dragastan et al. (2002) synonymized several Mesozoic taxa, including<br />
some Triassic ones (> 200 my) with the extant taxon H. cylindracea because <strong>of</strong> similar segment<br />
shape. It follows directly from our results that no extant species can be <strong>of</strong> Triassic age <strong>and</strong> we are <strong>of</strong><br />
the opinion that using extant species as form taxa for fossils is undesirable. Comparative studies <strong>of</strong><br />
extant taxa in a <strong>molecular</strong> phylogenetic framework have presented unambiguous evidence that<br />
morphological convergence, especially <strong>of</strong> segment shape, has occurred during Halimeda <strong>evolution</strong><br />
(Kooistra et al., 2002; Verbruggen et al., 2005). Consequently, interpretation <strong>of</strong> fossils as extant<br />
species should follow only from statistically sound morphometric analyses, preferably using timeseries<br />
in various parts <strong>of</strong> the world.
Acknowledgments<br />
A MULTI-LOCUS TIME-CALIBRATED PHYLOGENY OF THE SIPHONOUS GREEN ALGAE 107<br />
We thank Fabio Rindi <strong>and</strong> Juan Lopez-Bautista for providing a Trentepohlia rbcL sequence. We are<br />
grateful to Barrett Brooks, Roxie Diaz, Cristine Galanza, John Huisman, Gerry Kraft, Tom <strong>and</strong> Courtney<br />
Leigh, Dinky Ol<strong>and</strong>esca, Tom Schils <strong>and</strong> John West for collecting specimens or providing assistance in<br />
the field. We thank Fabio Rindi <strong>and</strong> an anonymous referee for their constructive comments on a<br />
previous version <strong>of</strong> the manuscript. Funding was provided by FWO-Fl<strong>and</strong>ers (research grant<br />
G.0142.05, travel grants <strong>and</strong> post-doctoral fellowships to HV <strong>and</strong> FL), NSF (DEB-0128977 to FWZ), the<br />
Ghent University BOF (doctoral fellowship to EC <strong>and</strong> travel grant to FWZ), the Smithsonian Marine<br />
Station at Fort Pierce, Florida (SMS Contribution 760), the Flemish Government (bilateral research<br />
grant 01/46) <strong>and</strong> the King Leopold III Fund for Nature Exploration <strong>and</strong> Conservation.
108 CHAPTER 6<br />
Table 1. Taxon list with Genbank accessions <strong>and</strong> voucher numbers (in parentheses). Vouchers are deposited in the Ghent University Herbarium, the US<br />
National Herbarium or the Zechman lab herbarium (CSU Fresno).<br />
taxon rbcL tufA atpB 16S 18S<br />
Acetabularia acetabulum AY177738 FJ535854 (HV1287) Z33461<br />
Acetabularia calyculus FJ535855 (HV389)<br />
Acetabularia crenulata AY177737 FJ539159 Z33460<br />
Acetabularia dentata AY177739 FJ480413 Z33468<br />
Acetabularia peniculus AY177743 FJ539163 Z33472<br />
Acetabularia schenkii AY177744 Z33470<br />
Avrainvillea lacerata FJ432635 (HV599) FJ432651 (HV599) FJ535833 (HV599)<br />
Avrainvillea nigricans FJ432636 (HV891) FJ432652 (HV891) FJ535834 (HV891)<br />
Batophora occidentalis AY177747 FJ539160 Z33465<br />
Batophora oerstedii AY177748 Z33463<br />
Bornetella nitida AY177746 FJ480414 Z33464<br />
Bornetella sp. FJ535850 (LB1029)<br />
Bryopsidella neglecta AY004766<br />
Bryopsis hypnoides AY942169 AY221722<br />
Bryopsis plumosa FJ432637 (HV880) FJ432653 (HV880) FJ480417 FJ535835 (HV880) FJ432630 (HV880)<br />
Caulerpa flexilis AJ512485 DQ652532<br />
Caulerpa sertularioides AY942170 FJ432654 (HV989) AY389514 AF479703<br />
Caulerpa taxifolia AJ316279 AJ417939 FJ539164<br />
Caulerpa verticillata AJ417967<br />
Caulerpella ambigua FJ432638 (TS78) FJ432655 (TS24) FJ535836 (TS78)<br />
Chalmasia antillana FJ539161 AY165785<br />
Chlorocladus australasicus AY177750 Z33466<br />
Chlorodesmis fastigiata FJ432639 (HV102) FJ535837 (HV102) AF416396<br />
Codium lineage 1 AB038481 FJ432662 (H0882) FJ535838 (SD0509370)<br />
Codium lineage 2 M67453 U09427 U08345 FJ535848 (KZN2K4.1)<br />
Codium lineage 3 EF108086 (DHO2.178) FJ535856 (KZN2K4.10) FJ535839 (H0773) FJ535849 (KZN2K4.10)<br />
Cymopolia spp. FJ535851 (WP011) Z33467<br />
Derbesia marina AF212142<br />
Derbesia tenuissima FJ535852 (H0755) FJ535857 (H0755)
Dichotomosiphon tuberosus AB038487<br />
Flabellia petiolata FJ432640 (HV1202) FJ535847 (HV1202) AF416389<br />
Halicoryne wrightii AY177745 FJ535858 (HV565) AY165786<br />
Halimeda discoidea AB038488 AY826360 (SOC299) FJ480416 AF407254 (SOC299)<br />
Halimeda gracilis AM049965 (HV317) AF407257 (HEC11839)<br />
Halimeda incrassata AY942167 AM049958 (H0179) AF407233 (H0179)<br />
Halimeda micronesica AM049964 (WLS420-02) AF407243<br />
Halimeda opuntia AB038489 AM049967 (HV61) AF407267 (H0484)<br />
Neomeris dumetosa Z33469<br />
Oltmannsiellopsis viridis DQ291132 DQ291132 DQ291132 DQ291133 D86495<br />
Ostreobium sp. FJ535853 (H0753) FJ535859 (H0753) FJ535840 (H0753)<br />
Parvocaulis exigua AY177740 FJ539162<br />
Parvocaulis parvula AY177741 Z33471<br />
Pedobesia spp. AY004768 FJ535841 (HV1201)<br />
Penicillus capitatus FJ432641 (HV338) AF416404<br />
Penicillus dumetosus AY942175 AF416406<br />
Pseudendoclonium akinetum AY835431 AY835432 AY835433 AY835434 DQ011230<br />
Pseudocodium floridanum AM909692 (NSF.I23) AM909697 (NSF.I23) FJ432631 (NSF.I23)<br />
Pseudocodium natalense AM909693 (KZNb2241) AM049969 (KZNb2241) FJ535842 (KZNb2241) FJ432632 (KZNb2242)<br />
Rhipidosiphon javensis FJ432644 (DML40134) FJ535843 (DML40134)<br />
Rhipilia crassa FJ432645 (H0748) FJ432657 (HV738) FJ535844 (H0748)<br />
Rhipilia nigrescens FJ432646 (H0847) FJ432658 (HV788) FJ432633 (HV788)<br />
Rhipilia tomentosa AY942164<br />
Rhipiliopsis pr<strong>of</strong>unda FJ432647 (DML51973) FJ432659 (DML51973) FJ535845 (DML51973)<br />
Rhipocephalus phoenix FJ432648 (HV404) FJ535846 (HV404) AF416402<br />
Trentepohlia aurea FJ534608 DQ399590<br />
Tydemania expeditionis AY942161 FJ432661 (HV873) FJ432634 (HV873)<br />
Udotea flabellum AY942166 AF407270<br />
Udotea glaucescens FJ432650 (H0862)<br />
Udotea spinulosa AY942160<br />
Ulothrix zonata AF499683 Z47999<br />
Ulva intestinalis AB097617 AY454399 AJ000040
110 CHAPTER 6<br />
Table 2. Selection <strong>of</strong> partitioning strategy <strong>and</strong> model <strong>of</strong> sequence <strong>evolution</strong> using the Bayesian<br />
Information Criterion (BIC). The log-likelihood, number <strong>of</strong> parameters <strong>and</strong> BIC score are listed for<br />
various combination <strong>of</strong> partitioning strategies <strong>and</strong> models <strong>of</strong> sequence <strong>evolution</strong>. Each partition had<br />
its own copy <strong>of</strong> the model <strong>of</strong> sequence <strong>evolution</strong> with a separate set <strong>of</strong> model parameters. Lower BIC<br />
values indicate a better fit <strong>of</strong> the model to the data. The lowest BIC (in boldface) was observed for<br />
the partitioning strategy with four partitions (ribosomal DNA <strong>and</strong> separate codon positions for each<br />
gene), <strong>and</strong> GTR+ 8 models applied to each partition.<br />
model lnL # par BIC<br />
single partition<br />
F81 -56405.2 122 113863<br />
F81+ 8 -51296.8 123 103655<br />
HKY -56009.6 123 113080<br />
HKY+ 8 -50707.8 124 102486<br />
GTR -54913.6 127 110923<br />
GTR+ 8 -50224.1 128 101553<br />
2 partitions: ribosomal DNA, protein coding<br />
F81 -55852.3 126 112792<br />
F81+ 8 -50702.4 128 102509<br />
HKY -55249.8 128 111604<br />
HKY+ 8 -49969.8 130 101061<br />
GTR -54303.0 136 109779<br />
GTR+ 8 -49774.3 138 100739<br />
5 partitions: one for each locus (atpB, rbcL, tufA, 16S, 18S)<br />
F81 -55772.5 138 112736<br />
F81+ 8 -50769.0 143 102772<br />
HKY -55160.7 143 111555<br />
HKY+ 8 -49913.6 148 101104<br />
GTR -54145.5 163 109697<br />
GTR+ 8 -49483.9 168 100417<br />
4 partitions: ribosomal DNA, separate codon positions for protein coding<br />
F81 -52199.0 134 105554<br />
F81+ 8 -49807.4 138 100805<br />
HKY -50927.6 138 103046<br />
HKY+ 8 -48121.3 142 97468<br />
GTR -50455.9 154 102241<br />
GTR+ 8 -47763.5 158 96890<br />
5 partitions: 16S, 18S, separate codon positions for protein coding<br />
F81 -52190.9 138 105572<br />
F81+ 8 -49798.1 143 100830<br />
HKY -50918.0 143 103070<br />
HKY+ 8 -48109.4 148 97496<br />
GTR -50160.4 163 101727<br />
GTR+ 8 -47769.0 168 96988<br />
11 partitions: 16S, 18S, separate codon positions for each gene<br />
F81 -52087.6 162 105573<br />
F81+ 8 -49742.6 173 100978<br />
HKY -50825.1 173 103143<br />
HKY+ 8 -48071.9 184 97731<br />
GTR -50188.9 217 102250<br />
GTR+ 8 -47561.4 228 97090
Table 3. List <strong>of</strong> calibration points used to date the phylogenetic tree. The nodes to which the age constraints are applied (first column) are indicated on the<br />
phylogram in Fig. 3. If more than one age constraint was identified for a node, these are listed as different calibrations (e.g. calibrations a1, a2 <strong>and</strong> a3 all<br />
apply to node a). The 'age' column indicates the type <strong>of</strong> constraint (minimum vs. maximum) <strong>and</strong> the value <strong>of</strong> the constraint (in million years). Ages <strong>of</strong> epochs<br />
<strong>and</strong> stages follow the International Stratigraphic Chart (ICS 2008).<br />
node name calibration fossil period age (my) reference<br />
a siphonous <strong>algae</strong> crown a1 absence <strong>of</strong> siphonous fossils Ediacaran max 635 Zhang et al. (1998)<br />
a2 Yakutina aciculata Middle Cambrian min 499 Korde (1957)<br />
a3 Chaetocladus plumula Middle Ordovician min 460.9 Whitfield (1894)<br />
b Batophoreae stem b1 Uncatoella verticillata Lower Devonian min 397.5 Kenrick <strong>and</strong> Li (1998)<br />
b2 Archaeobatophora typa Upper Ordovician min 443.7 Nitecki (1976)<br />
max<br />
b3 Uncatoella verticillata Lower Devonian 416.0 Kenrick <strong>and</strong> Li (1998)<br />
c Bornetelleae stem c Zittelina hispanica Hauterivian min 130.0 Masse et al. (1993)<br />
d Neomereae crown d1 Neomeris cretacea Albian min 99.6 Granier <strong>and</strong> Del<strong>of</strong>fre (1993)<br />
d2 Neomeris cretacea Barremian min 125.0 Sotak & Misik (1993)<br />
d3 Pseudocymopolia jurassica Portl<strong>and</strong>ian min 142.0 Dragastan (1968)<br />
e Acetabularieae stem e1 Acicularia heberti Danian min 61.1 Morellet <strong>and</strong> Morellet (1922)<br />
e2 Acicularia boniae Middle Triassic min 228.7 Iannace et al. (1998)<br />
core Halimedineae<br />
Dimorphosiphon<br />
f stem f<br />
rectangulare Middle Ordovician min 460.9 Hoeg (1927)<br />
g Caulerpaceae stem g Caulerpa sp. Wolfcampian min 280.0 Gustavson <strong>and</strong> Delevoryas (1992)<br />
h Halimeda stem h1 Halimeda marondei Norian min 203.6 Flügel (1988)<br />
h2 Halimeda soltanensis Upper Permian min 251.0 Poncet (1989)
112 CHAPTER 6<br />
Appendix<br />
Alternative sets <strong>of</strong> calibration points used to constrain relaxed <strong>molecular</strong> clock analyses. Node ages<br />
were inferred for each <strong>of</strong> these conditions to evaluate the impact <strong>of</strong> some potentially erroneous<br />
fossil assignments.<br />
condition combination description<br />
01 a1 a2 b1 c d2 e1 f g<br />
h1<br />
moderately conservative<br />
02 a1 a3 b1 c d1 e1 f g<br />
h1<br />
ultraconservative youngest<br />
03 a1 a2 b2 c d3 e2 f g<br />
h2<br />
ultraliberal oldest<br />
04 a1 a2 b1 c d2 e1 f h1 moderately conservative, no Caulerpa<br />
05 a1 a2 b1 c d2 e1 g h1 moderately conservative, no Dimorphosiphon<br />
06 a1 a3 b1 c d1 e1 g h1 ultraconservative youngest, no Dimorphosiphon<br />
07 a1 a2 b2 c d3 e2 g h2 ultraliberal oldest, no Dimorphosiphon<br />
08 a1 a2 b1 c d2 e1 h1 moderately conservative, no Caulerpa, no Dimorphosiphon<br />
09 a2 b1 b3 c d2 e1 h1 very conservative young: strongly constrained age for crown<br />
Dasycladaceae based on Uncatoella<br />
10 a2 b1 b3 c d2 e1 h2 very conservative young: strongly constrained age for crown<br />
Dasycladaceae based on Uncatoella<br />
11 a1 a2 c d2 e1 h1 condition 08 without calibrations on node b<br />
As mentioned in the text, analyses were also repeated with different maximum age constraints on<br />
the root node to evaluate the sensitivity to this particular assumption. These analyses were variants<br />
<strong>of</strong> condition 08 in which the maximum age constraint a1 was replaced with 800 my <strong>and</strong> 500 my.<br />
The chronogram resulting from analysis 08 is shown in Fig. 4.<br />
The chronogram resulting from analysis 09 is shown in the online appendix (i.e. below).
A MULTI-LOCUS TIME-CALIBRATED PHYLOGENY OF THE SIPHONOUS GREEN ALGAE 113
7<br />
Systematics <strong>of</strong> the marine micr<strong>of</strong>ilamentous <strong>green</strong> <strong>algae</strong> Uronema<br />
curvatum <strong>and</strong> Urospora microscopica (Chlorophyta) 1<br />
Abstract<br />
The micr<strong>of</strong>ilamentous <strong>green</strong> alga Uronema curvatum is widely distributed along the western <strong>and</strong><br />
eastern coasts <strong>of</strong> the north Atlantic Ocean where it typically grows on crustose red <strong>algae</strong> <strong>and</strong> on<br />
haptera <strong>of</strong> kelps in subtidal habitats. The placement <strong>of</strong> this marine species in a genus <strong>of</strong> freshwater<br />
Chlorophyceae had been questioned. Molecular phylogenetic analysis <strong>of</strong> nuclear-encoded small <strong>and</strong><br />
large subunit rDNA sequences reveal that U. curvatum is closely related to the ulvophycean order<br />
Cladophorales with which it shares a number <strong>of</strong> morphological features, including a siphonocladous<br />
level <strong>of</strong> organization <strong>and</strong> zoidangial development. The divergent phylogenetic position <strong>of</strong> U.<br />
curvatum, sister to the rest <strong>of</strong> the Cladophorales, along with a combination <strong>of</strong> distinctive<br />
morphological features, such as the absence <strong>of</strong> pyrenoids, the diminutive size <strong>of</strong> the unbranched<br />
filaments <strong>and</strong> the discoid holdfast, warrants the recognition <strong>of</strong> a separate genus, Okellya, within a<br />
new family <strong>of</strong> Cladophorales, Okellyaceae. The epiphytic Urospora microscopica from Norway, which<br />
has been allied with U. curvatum, is revealed as a member <strong>of</strong> the cladophoralean genus<br />
Chaetomorpha <strong>and</strong> is herein transferred to that genus as C. norvegica nom. nov.<br />
Key words<br />
Chlorophyta, Cladophorales, <strong>green</strong> <strong>algae</strong>, marine, <strong>molecular</strong> phylogenetics, systematics, taxonomy,<br />
Ulvophyceae<br />
1 Accepted manuscript: Leliaert, F., J. Rueness, C. Boedeker, C. A. Maggs, E. Cocquyt, H. Verbruggen,<br />
<strong>and</strong> O. De Clerck. 2009. Systematics <strong>of</strong> the marine micr<strong>of</strong>ilamentous <strong>green</strong> <strong>algae</strong> Uronema curvatum<br />
<strong>and</strong> Urospora microscopica (Chlorophyta). European Journal <strong>of</strong> <strong>Phycology</strong> in press.
116 CHAPTER 7<br />
Introduction<br />
Green <strong>algae</strong> display a wide diversity <strong>of</strong> thallus organization, ranging from flagellate or coccoid unicells<br />
to colonial forms <strong>and</strong> various levels <strong>of</strong> multicellular organization. This morphological variation has<br />
been the basis for conventional <strong>green</strong> algal classification (Round 1984). For example flagellates were<br />
commonly grouped in the order Volvocales, coccoids in the Chlorococcales, <strong>and</strong> unbranched<br />
filaments in the Ulotrichales (Bold <strong>and</strong> Wynne 1985). Ultrastructural work, comparative biochemistry<br />
<strong>and</strong> life-history studies have demonstrated that a filamentous nature (<strong>and</strong> various other vegetative<br />
features) are independently derived in different lineages within the <strong>green</strong> <strong>algae</strong> (Mattox <strong>and</strong> Stewart<br />
1984). Molecular systematics have largely corroborated these findings, showing that convergent<br />
<strong>evolution</strong> is responsible for the presence <strong>of</strong> unbranched filaments in distantly related <strong>green</strong> algal<br />
lineages, such as the chlorophytan classes Ulvophyceae (Ulothrix, Urospora <strong>and</strong> Chaetomorpha) <strong>and</strong><br />
Chlorophyceae (Microspora, Oedogonium, Uronema), <strong>and</strong> the streptophytan classes<br />
Klebsormidiophyceae (Klebsormidium) <strong>and</strong> Zygnematophyceae (Spirogyra <strong>and</strong> other genera) (Lewis<br />
<strong>and</strong> McCourt 2004, Pröschold <strong>and</strong> Leliaert 2007). Most notably, the genus Ulothrix, which is <strong>of</strong>ten<br />
regarded as the morphological archetype <strong>of</strong> the unbranched uniseriate filamentous morphology, has<br />
been shown to be polyphyletic, with its various members belonging to different <strong>green</strong> algal classes<br />
(O'Kelly 2007).<br />
Although the phylogenetic position <strong>of</strong> numerous unbranched filamentous species has now been<br />
resolved based on ultrastructural <strong>and</strong> <strong>molecular</strong> evidence (e.g. Booton et al. 1998, Leliaert et al.<br />
2003, O'Kelly et al. 2004), several taxa have remained largely unstudied. Amongst them are the<br />
marine micr<strong>of</strong>ilamentous species Uronema curvatum Printz <strong>and</strong> Urospora microscopica Levring.<br />
The genus Uronema Lagerheim (1887) is characterized by unbranched filaments <strong>of</strong> uninucleate cells<br />
with a single chloroplast <strong>and</strong> 1-4 pyrenoids (Chaudhary 1979). The filaments are attached by a basal<br />
discoid gelatinous holdfast, <strong>and</strong> apical cells are typically acuminate. Thalli reproduce asexually by a<br />
single zoospore (sometimes two) formed per cell. The genus is currently placed in the chlorophycean<br />
order Chaetophorales, based on ultrastructural evidence <strong>and</strong> 18S rDNA sequence data (Booton et al.<br />
1998). Uronema includes about 17 species (Guiry <strong>and</strong> Guiry 2009), all but two restricted to<br />
freshwater or damp terrestrial habitats. The only marine species are the North Atlantic U. curvatum<br />
<strong>and</strong> the south-west Pacific U. marinum Womersley, both inconspicuous <strong>algae</strong> that have probably<br />
passed unnoticed in many investigations. Uronema curvatum was originally described from<br />
Trondheim Fjord, Norway (Printz 1926), <strong>and</strong> has since been reported from scattered localities along<br />
the eastern <strong>and</strong> western coasts <strong>of</strong> the north Atlantic Ocean (Feldmann 1954, Rueness 1977, South<br />
<strong>and</strong> Tittley 1986, Rueness 1992, Kornmann <strong>and</strong> Sahling 1994, Maggs <strong>and</strong> O' Kelly 2007). The species<br />
grows in subtidal habitats on non-calcified crustose red <strong>algae</strong> (such as Peyssonnelia <strong>and</strong> Cruoria),<br />
crustose Cyanobacteria on pebbles, <strong>and</strong> on haptera <strong>of</strong> kelps. Uronema curvatum differs from the<br />
freshwater representatives <strong>of</strong> the genus in zoosporganial <strong>and</strong> apical cell morphology, <strong>and</strong> its generic<br />
placement has been debated by Rueness (1992) <strong>and</strong> Kornmann <strong>and</strong> Sahling (1994) who suggested a<br />
relationship with Cladophorales or Ulotrichales (Acrosiphoniales).
SYSTEMATICS OF MARINE MICROFILAMENTOUS GREEN ALGAE 117<br />
Figures 1-11. Uronema curvatum (= Okellya curvata, comb. nov.). Figs 1, 2. Field-collected sample, growing as<br />
an epiphyte on a red crust, on the haptera <strong>of</strong> Laminaria hyperborea (diameter <strong>of</strong> filaments 7-8 µm). Figs 3-11.<br />
Cultures. Fig. 3. Terminal sporangium with spores. Fig 4, 5. Vegetative filaments showing chloroplasts before<br />
<strong>and</strong> after staining with iodine solution (no pyrenoids are visible). Fig. 6. Irregular surface <strong>of</strong> chloroplast. Figs 7-<br />
10. Terminal sporangia with spores, some <strong>of</strong> which germinate in situ. Arrows indicate exit pore. Fig. 11. DAPIstained<br />
vegetative cells with two to four nuclei.<br />
Urospora Areschoug (1866) is a genus <strong>of</strong> cold water marine <strong>green</strong> <strong>algae</strong> characterized by an<br />
unbranched filamentous gametophyte composed <strong>of</strong> multinucleate cells with a parietal reticulate<br />
chloroplast, <strong>and</strong> a unicellular, club-shaped, uninucleate sporophyte (Codiolum phase). The uniseriate<br />
gametophytes are attached to the substrate by multicellular rhizoids arising from the basal cells.<br />
Urospora has a complex nomenclatural history <strong>and</strong> the taxonomic position <strong>of</strong> the genus has long<br />
been uncertain (Lokhorst <strong>and</strong> Trask 1981). The genus has been placed in the Cladophorales or<br />
Siphonocladales based on the multinucleate cells (Wille 1890, Rosenvinge 1893, Setchell <strong>and</strong> Gardner<br />
1920, Printz 1932) but is now recognized as a close relative <strong>of</strong> Acrosiphonia <strong>and</strong> Spongomorpha in the
118 CHAPTER 7<br />
ulvophycean order Ulotrichales based on morphological, ultrastructural <strong>and</strong> life-history features, <strong>and</strong><br />
<strong>molecular</strong> data (Jorde 1933, Kornmann 1963, Floyd <strong>and</strong> O' Kelly 1984, van Oppen et al. 1995, Jónsson<br />
1999, Lindstrom <strong>and</strong> Hanic 2005). The genus includes about 12 species worldwide (Guiry <strong>and</strong> Guiry<br />
2009), four <strong>of</strong> which are common along western European shores (Lokhorst <strong>and</strong> Trask 1981). The<br />
epiphytic Urospora microscopica from Norway has been distinguished from other species in the<br />
genus by its minute filaments (Levring 1937). Since its description, the species has remained largely<br />
unnoticed <strong>and</strong> its systematic position uncertain (Rueness 1992, Lein et al. 1999).<br />
In the present study we aim to assess the phylogenetic position <strong>of</strong> the enigmatic micr<strong>of</strong>ilamentous<br />
species Uronema curvatum <strong>and</strong> Urospora microscopica by <strong>molecular</strong> phylogenetic analysis <strong>of</strong><br />
nuclear-encoded small <strong>and</strong> large subunit rDNA sequences.<br />
Material <strong>and</strong> methods<br />
Specimens <strong>of</strong> Uronema curvatum, growing as epiphytes on Peyssonnelia dubyi P.L. Crouan & H.M.<br />
Crouan, were collected from Vega (county <strong>of</strong> Nordl<strong>and</strong>, Norway) on 26 October 1990 (Rueness 1992).<br />
Specimens <strong>of</strong> Urospora microscopica, growing epiphytic on Cystoclonium purpureum at a depth <strong>of</strong> 3-<br />
5 m, were collected from Busepollen in Austevoll (county <strong>of</strong> Hordal<strong>and</strong>, Norway) in September 1994.<br />
Unialgal cultures <strong>of</strong> both species were obtained as described in Rueness (1992) <strong>and</strong> have been<br />
deposited in the Culture Collection <strong>of</strong> Algae <strong>and</strong> Protozoa (CCAP) as CCAP 455/1 (Uronema<br />
curvatum) <strong>and</strong> CCAP 504/1 (Urospora microscopica). Specimens were examined with a Nikon Eclipse<br />
TE 300 (Nikon Co., Tokyo, Japan) <strong>and</strong> Olympus BX51 (Olympus Co., Tokyo, Japan) bright field light<br />
microscopes. Photographs were taken with a Nikon DS-5M or Olympus E410 digital camera mounted<br />
on the microscope. Pyrenoids were stained with Lugol's iodine. DAPI nuclear staining was performed<br />
as described by Rueness (1992).<br />
Molecular phylogenetic analyses were based on nuclear-encoded small subunit (SSU) <strong>and</strong> partial<br />
large subunit (LSU) rDNA sequences. DNA extraction, PCR amplification <strong>and</strong> sequencing were<br />
performed as described in Leliaert et al. (2007). Taxa for which new sequences were generated are<br />
listed in Table S1 <strong>of</strong> the online supplementary material. Sequences have been deposited to<br />
EMBL/GenBank under accession numbers FN257507- FN257512.<br />
Two alignments were created for phylogenetic analyses. The first one was assembled to assess the<br />
phylogenetic position <strong>of</strong> Uronema curvatum <strong>and</strong> Urospora microscopica within the Chlorophyta. This<br />
alignment consisted <strong>of</strong> 30 SSU rDNA sequences, including other Uronema <strong>and</strong> Urospora<br />
representatives <strong>and</strong> exemplar taxa from a broad representation <strong>of</strong> chlorophytan classes for which<br />
SSU rDNA sequences have been deposited in GenBank. Two prasinophycean <strong>algae</strong> were used as<br />
outgroup taxa. Although no sequence data are available for the type species <strong>of</strong> Uronema (U.<br />
confervicola Lagerheim) <strong>and</strong> Urospora (U. mirabilis Areschoug), there is indirect evidence that<br />
Uronema belkae <strong>and</strong> Urospora neglecta (included in our phylogenetic analyses) are related to the<br />
types <strong>of</strong> the respective genera. Schlösser (1987) showed that the autolysin <strong>of</strong> U. confervicola reacts<br />
in bioassays on strains <strong>of</strong> U. belkae, suggesting that the two species are closely allied (Pröschold <strong>and</strong><br />
Leliaert 2007). Urospora mirabilis is currently regarded as a synonym <strong>of</strong> Urospora penicilliformis
SYSTEMATICS OF MARINE MICROFILAMENTOUS GREEN ALGAE 119<br />
(Roth) J.E. Areschoug, which has been found to be related to Urospora neglecta based on 18S rRNA<br />
gene sequence data (Lindstrom <strong>and</strong> Hanic 2005).<br />
Based on the results <strong>of</strong> the phylogenetic analysis inferred from the SSU rDNA alignment, a second<br />
dataset <strong>of</strong> partial LSU rDNA sequences was assembled <strong>and</strong> analysed to examine the phylogenetic<br />
position <strong>of</strong> the two species within the Cladophorales with more confidence. In the Cladophorales,<br />
partial LSU rDNA sequences (first ca. 500 bp) are known to be more phylogenetically informative<br />
than SSU rDNA sequences (Leliaert et al. 2003). The LSU rDNA alignment consisted <strong>of</strong> 20<br />
cladophoralean sequences with Caulerpa <strong>and</strong> Chlorodesmis (Bryopsidales), Acrosiphonia<br />
(Ulotrichales) <strong>and</strong> Ulva (Ulvales) as outgroup taxa. Sequences were aligned using MUSCLE (Edgar<br />
2004), <strong>and</strong> visually inspected.<br />
Evolutionary models for the two alignments were determined by the Akaike Information Criterion in<br />
PAUP/Modeltest 3.6 (Posada <strong>and</strong> Cr<strong>and</strong>all 1998, Sw<strong>of</strong>ford 2002). Both datasets were analysed with<br />
maximum likelihood (ML) <strong>and</strong> Bayesian inference (BI), using PhyML v2.4.4 (Guindon <strong>and</strong> Gascuel<br />
2003) <strong>and</strong> MrBayes v3.1.2 (Ronquist <strong>and</strong> Huelsenbeck 2003) respectively. The SSU rDNA dataset was<br />
analysed under a general time-reversible model with a proportion <strong>of</strong> invariable sites <strong>and</strong> gamma<br />
distribution split into 4 categories (GTR+I+G4). The LSU rDNA alignment was analysed under a<br />
general time-reversible model with gamma distribution split into 4 categories <strong>and</strong> no separate rate<br />
class for invariable sites (GTR+G4). BI analyses consisted <strong>of</strong> two parallel runs <strong>of</strong> four incrementally<br />
heated chains each, <strong>and</strong> 4 million generations with sampling every 1000 generations. A burnin<br />
sample <strong>of</strong> 2000 trees was removed before constructing the majority rule consensus tree. For the ML<br />
trees, the reliability <strong>of</strong> internal branches was evaluated with non-parametric bootstrapping (1000<br />
replicates).<br />
Results<br />
Morphology<br />
Thalli <strong>of</strong> Uronema curvatum form minute epiphytic turfs <strong>of</strong> curved, uniseriate, unbranched filaments,<br />
composed <strong>of</strong> 3-10 cells, 100-180 µm long (in culture, filaments may grow up to 100 cells <strong>and</strong> 700 µm<br />
long), with an increasing diameter towards the apex (Figs 1, 2). Thallus is dull, yellowish <strong>green</strong> in<br />
colour. Filaments are attached to the substrate by a basal discoid holdfast. Vegetative cells are<br />
subcylindrical, 3.5-6 µm in diameter at the base, increasing to 7-10 µm at the apex, 1.5-6 times as<br />
long as broad, up to 21 µm long. The chloroplast is parietal <strong>and</strong> lobed <strong>and</strong> occupies most <strong>of</strong> the cell<br />
wall (Figs 4-6); transmission electron microscopy showed that more than one chloroplast might be<br />
present per cell (Rueness 1992); pyrenoids are absent (Fig. 5). Cells are multinucleate, containing (1-)<br />
2-4 (-8) nuclei (Fig. 11). Thalli become reproductive before the filaments reach about 10 cells (in<br />
culture, unattached filaments may become longer). Prior to differentiation into sporangia, cells<br />
contain 8-16 (-32) nuclei (Rueness 1992). Zoids develop by transformation <strong>of</strong> apical <strong>and</strong> subapical<br />
cells into slightly swollen zoosporangia (Figs 3, 7); (8-) 16-32 zoids are formed per cell, which emerge<br />
through a domed pore in the upper part <strong>of</strong> the cell, on the outer face relative to the curvature <strong>of</strong><br />
filaments (Figs 7, 8) (Rueness 1992). In culture, spores may germinate within the parent cell (Figs 9,
120 CHAPTER 7<br />
10). Filaments that were isolated into unialgal culture in 1990 have since been reproducing asexually<br />
by spores.<br />
Figures 12-21. Urospora microscopica (= Chaetomorpha norvegica, nom. nov.), culture. Fig. 12. Filament with<br />
basal cell with attachment disc. Fig. 13. Apical portion <strong>of</strong> filament with sporangia <strong>and</strong> lateral exit pores. Fig. 14.<br />
Parietal, lobed chloroplast. Fig. 15. Cell showing pyrenoids following staining with iodide solution. Figs 16, 17.<br />
The same filaments after DAPI-staining as seen under light field <strong>and</strong> fluorescence microscopy, showing<br />
multinucleate cells with four nuclei in axial arrangement (note one spore attached outside the filament <strong>and</strong> a<br />
few spores left in sporangium). Fig. 18. Lobed attachment disc with germinating spores. Fig. 19. Sporangia with<br />
exit pore (top filament) <strong>and</strong> start <strong>of</strong> exit pore formation (bottom filament, arrow) (fixed material, without cell<br />
contents). Figs 20, 21. Sporangia with spores, red eye spot visible (arrows).
SYSTEMATICS OF MARINE MICROFILAMENTOUS GREEN ALGAE 121<br />
Thalli <strong>of</strong> Urospora microscopica (Figs 12-21) form straight or curved, uniseriate, unbranched<br />
filaments up to 1750 µm long, composed <strong>of</strong> cylindrical cells, 10-20 µm in diameter (Fig. 12). Thallus is<br />
bright, grass <strong>green</strong> in colour. Filaments are attached to the substrate by a basal hyaline lobed<br />
holdfast (Figs 12, 18). Cells contain a parietal, lobed chloroplast with several pyrenoids (ca. 5) (Figs<br />
14, 15). Cells are multinucleate, containing 4 nuclei in axial arrangement (Figs 16, 17). Zoids develop<br />
by transformation <strong>of</strong> apical <strong>and</strong> subapical cells into zoosporangia; 10-35 zoids are formed per cell,<br />
which emerge through a domed pore in the middle part <strong>of</strong> the cell (sometimes or subapical or subbasal)<br />
(Figs 19-21). Filaments that were isolated into unialgal culture in 1994 have since been<br />
reproducing asexually by spores.<br />
Molecular phylogeny<br />
Specifications <strong>of</strong> the SSU <strong>and</strong> LSU rDNA sequence alignments <strong>and</strong> <strong>evolution</strong>ary models applied are<br />
given in Table S2 (online supplementary material).<br />
Phylogenetic analysis <strong>of</strong> the SSU rDNA dataset resulted in a chlorophytan tree with a poorly resolved<br />
backbone, in which the monophyly <strong>of</strong> the Ulvophyceae, Chlorophyceae <strong>and</strong> Trebouxiophyceae, <strong>and</strong><br />
the relationships among these classes were weakly supported (Fig. 22). Even so, the phylogenetic<br />
positions <strong>of</strong> U. curvatum <strong>and</strong> U. microscopica could be determined with high support. Uronema<br />
curvatum is unrelated to the freshwater Uronema belkae (or any other member <strong>of</strong> the<br />
chlorophycean order Chaetophorales), but instead sister to the Cladophorales. Urospora<br />
microscopica is not allied with the Urospora neglecta or any other member <strong>of</strong> Ulvales but is placed<br />
within the Cladophorales clade.<br />
Phylogenetic analysis <strong>of</strong> the Cladophorales LSU rDNA alignment resulted in three well-supported<br />
clades, termed Cladophora, Siphonocladus <strong>and</strong> Aegagropila clades (Fig. 23). Concordant with the SSU<br />
rDNA tree, U. curvatum is sister to the Cladophorales with high support. U. microscopica falls within<br />
the Cladophora clade. It is most closely related to Chaetomorpha, although its exact phylogenetic<br />
position could not be determined with satisfactory statistical support.<br />
Discussion<br />
The placement <strong>of</strong> the marine species Uronema curvatum in a genus <strong>of</strong> freshwater Chlorophyceae had<br />
been questioned. Rueness (1992) examined the species in culture, <strong>and</strong> suggested a relationship with<br />
the cladophoralean genera Chaetomorpha <strong>and</strong> Rhizoclonium, or with the ulotrichalean Urospora<br />
based on the multinucleate cells. Kornmann <strong>and</strong> Sahling (1994) formally transferred the species to<br />
Urospora based on zoospore morphology, but this transfer was not widely adopted (Bartsch <strong>and</strong><br />
Kuhlenkamp 2000, Nielsen <strong>and</strong> Gunnarsson 2001, Maggs <strong>and</strong> O' Kelly 2007). The present study shows<br />
that U. curvatum is closely allied to the ulvophycean order Cladophorales.<br />
U. curvatum shares a number <strong>of</strong> ecological <strong>and</strong> morphological features with the <strong>green</strong> macroalgal<br />
order Cladophorales. Like most members <strong>of</strong> this order, U. curvatum occurs in benthic marine coastal<br />
habitats. The assumption that the Cladophorales are an originally marine clade, which successfully
122 CHAPTER 7<br />
invaded freshwater habitats at least two times independently (Hanyuda et al. 2002), is reinforced by<br />
the phylogenetic position <strong>of</strong> U. curvatum, sister to the rest <strong>of</strong> the Cladophorales.<br />
Morphologically, U. curvatum shares the typical siphonocladous level <strong>of</strong> organization <strong>of</strong> the<br />
Cladophorales, i.e. multicellular thalli composed <strong>of</strong> multinucleate cells. The number <strong>of</strong> nuclei in<br />
cladophoralean species is highly variable <strong>and</strong> generally proportional to cell size. Most cladophoralean<br />
taxa have relatively large cells (ranging from several µm to several mm across) with hundreds or even<br />
thous<strong>and</strong>s <strong>of</strong> nuclei, arranged in cytoplasmic domains (Kapraun <strong>and</strong> Nguyen 1994). The cells <strong>of</strong> U.<br />
curvatum typically contain 2-4 nuclei (Rueness 1992, Maggs <strong>and</strong> O' Kelly 2007), comparable to<br />
numbers found in Rhizoclonium riparium (Roth) Harvey, which has cell dimensions<strong>of</strong> the same order<br />
<strong>of</strong> magnitude as U. curvatum (mostly 5-20 µm in diameter) (Leliaert <strong>and</strong> Boedeker 2007).<br />
Figure 22. ML tree <strong>of</strong> the core chlorophytes (Ulvophyceae, Trebouxiophyceae, Chlorophyceae), rooted with<br />
two prasinophytes, inferred from SSU rDNA sequences. The phylogenetic position <strong>of</strong> Uronema curvatum (=<br />
Okellya curvata, comb. nov.) <strong>and</strong> Urospora microscopica (= Chaetomorpha norvegica, nom. nov.), along with<br />
other members <strong>of</strong> the two genera are shown. ML bootstrap values (> 50) <strong>and</strong> BI posterior probabilities (> .90)<br />
are indicated at branches. The branches leading to Acetabularia <strong>and</strong> Caulerpa are scaled 50% (*) <strong>and</strong> 25% (**).
SYSTEMATICS OF MARINE MICROFILAMENTOUS GREEN ALGAE 123<br />
Thallus organization in the Cladophorales ranges from branched or unbranched uniseriate filaments<br />
to more complex architectural types (one notable exception being the coccoid Spongiochrysis in the<br />
Aegagropila clade, Rindi et al. 2006). Unbranched filamentous thalli, assigned to Chaetomorpha or<br />
Rhizoclonium, have evolved from branched forms several times independently within the<br />
Cladophorales (Hanyuda et al. 2002, Leliaert et al. 2003). U. curvatum thus represents another<br />
unbranched filamentous lineage <strong>of</strong> Cladophorales. U. curvatum attaches to the substrate by a basal<br />
discoid holdfast <strong>and</strong> hence differs from most Cladophorales, which are attached to the substrate by<br />
branched or unbranched rhizoids that develop from basal or intercalary cells. The diminutive<br />
Cladophora pygmaea Reinke also attaches by a similar basal discoid holdfast. Based on this feature it<br />
was placed in a separate section <strong>of</strong> the genus by van den Hoek (1963), but a <strong>molecular</strong> phylogenetic<br />
study refuted the separate placement <strong>of</strong> C. pygmaea <strong>and</strong> showed that mode <strong>of</strong> attachment is not an<br />
<strong>evolution</strong>arily conserved character <strong>and</strong> has little taxonomic value above the species level (Leliaert et<br />
al. 2009).<br />
U. curvatum shares the typical zoidangial development <strong>and</strong> exit aperture <strong>of</strong> the Cladophorales: after<br />
vegetative growth ceases, the apical cells slightly swell <strong>and</strong> the cytoplasm is divided into zoids that<br />
are dispensed through a domed pore at the upper end <strong>of</strong> the cell. Some cladophoralean taxa display<br />
variation in zoidangial morphology. For example, in Wittrockiella (Aegagropila clade) the spores are<br />
released through extremely elongated exit tubes, resembling colourless hairs (Leliaert <strong>and</strong> Boedeker<br />
2007), <strong>and</strong> many taxa <strong>of</strong> the Siphonocladus clade have large cells that form numerous lateral exit<br />
pores (Hori 1994).<br />
The chloroplast <strong>of</strong> U. curvatum is parietal <strong>and</strong> lobed <strong>and</strong> lines most <strong>of</strong> the cell wall. In contrast, the<br />
cells <strong>of</strong> most other Cladophorales contain numerous chloroplasts interconnecting by delicate str<strong>and</strong>s<br />
to form a continuous layer or a parietal network. In some taxa, such as Rhizoclonium riparium, cells<br />
contain a single or few parietal, lobed chloroplasts, similar to U. curvatum (Leliaert <strong>and</strong> Boedeker<br />
2007). Uronema curvatum differs from other Cladophorales by the lack <strong>of</strong> pyrenoids, although TEM<br />
observations by Rueness (1992) suggest the presence <strong>of</strong> starch grains inside the chloroplasts. In<br />
other Cladophorales most <strong>of</strong> the chloroplasts in a cell contain a single pyrenoid. The majority <strong>of</strong><br />
species have bilenticular pyrenoids, i.e. each pyrenoid consists <strong>of</strong> two hemispheres, separated by a<br />
single thylakoid <strong>and</strong> each hemisphere is capped by a bowl-shaped starch grain. This pyrenoid<br />
structure was initially thought to be uniform within the order (Jónsson 1962, van den Hoek et al.<br />
1995), but several exceptions to this pattern have been reported, mainly in species <strong>of</strong> the<br />
Aegagropila clade (Matsuyama et al. 1998, Miyaji 1999, Hanyuda et al. 2002).<br />
Another marine species <strong>of</strong> Uronema, U. marinum, has been described as an epiphyte on <strong>green</strong> <strong>and</strong><br />
(non-crustose) red seaweeds in shallow subtidal habitats from southern <strong>and</strong> western Australia, the<br />
Great Barrier Reef, Lord Howe Isl<strong>and</strong>, Micronesia <strong>and</strong> Hawaii (Womersley 1984, Abbott <strong>and</strong> Huisman<br />
2004, Kraft 2007). This species resembles U. curvatum in size, cell dimensions <strong>and</strong> mode <strong>of</strong><br />
attachment, but differs in having one or two pyrenoids per cell. The taxonomic position <strong>of</strong> Uronema<br />
marinum is left undecided at this stage, <strong>and</strong> the name is retained pending <strong>molecular</strong> investigations.<br />
The micro-filamentous species, Urospora microscopica, was described from Osund, Norway, growing<br />
epiphytically on Nitophyllum <strong>and</strong> Cystoclonium (Levring 1937). Since its original description, the<br />
species has remained largely unnoticed (Lein et al. 1999). Rueness (1992), who re-examined the type<br />
material, found that U. microscopica differed from U. curvatum in cell dimensions, the straight
124 CHAPTER 7<br />
filaments, <strong>and</strong> the position <strong>of</strong> the sporangial pore, which is lateral or sub-basal in U. microscopica<br />
versus subapical in U. curvatum. In the present study we examined recent collections <strong>and</strong> cultures <strong>of</strong><br />
U. microscopica, which made it possible to investigate this species in more detail <strong>and</strong> assess its<br />
phylogenetic position based on <strong>molecular</strong> data. The phylogenetic analysis clearly shows that U.<br />
microscopica is a member <strong>of</strong> the Cladophora clade. The species seems to be most closely related to<br />
Chaetomorpha, although the presence <strong>of</strong> four nuclei <strong>and</strong> sporangia with a single lateral pore would<br />
suggest a relationship with Rhizoclonium riparium (Leliaert <strong>and</strong> Boedeker 2007).<br />
Figure 23. ML tree <strong>of</strong> the Cladophorales inferred from partial LSU rDNA sequences, showing the phylogenetic<br />
position <strong>of</strong> Uronema curvatum (= Okellya curvata, comb. nov.) <strong>and</strong> Urospora microscopica (= Chaetomorpha<br />
norvegica, nom. nov.). ML bootstrap values (> 50) <strong>and</strong> BI posterior probabilities (> .90) are indicated at<br />
branches.<br />
Chaetomorpha is a marine genus <strong>of</strong> attached or unattached unbranched macro-filaments. More than<br />
200 species <strong>and</strong> infraspecific taxa have been described worldwide (Index Nominum Algarum), <strong>of</strong><br />
which only about 50 are currently accepted (Guiry <strong>and</strong> Guiry 2009). Morphological features used to<br />
delimit species within the genus are growth form, cell dimensions <strong>and</strong> shape <strong>of</strong> the basal attachment<br />
cell. However, the extensive variability <strong>of</strong> these morphological characters depending on<br />
environmental conditions accounts for a great deal <strong>of</strong> taxonomic confusion, <strong>and</strong> the genus is clearly<br />
in need <strong>of</strong> revision (Leliaert <strong>and</strong> Boedeker 2007).<br />
Urospora microscopica differs from other members <strong>of</strong> the genus Chaetomorpha in the diminutive<br />
growth form, small cell size (10-20 µm in diameter) <strong>and</strong> low number <strong>of</strong> nuclei per cell. Most
SYSTEMATICS OF MARINE MICROFILAMENTOUS GREEN ALGAE 125<br />
Chaetomorpha species are much more robust, forming macroscopic thalli with cells ranging from ca.<br />
60 µm in diameter in C. ligustica (Kützing) Kützing to one or several mm across (e.g. C. melagonium<br />
(Weber & Mohr) Kützing, C. coliformis (Montagne) Kützing). Only a few other minute Chaetomorpha<br />
species have been described. Chaetomorpha sphacelariae Foslie (1881) is a diminutive epiphyte on<br />
Sphacelaria from Norway, which has remained unnoticed since its original description.<br />
Chaetomorpha minima Collins & Hervey (1917) has been morphologically associated with C.<br />
sphacelariae. This species from the north-west Atlantic Ocean <strong>and</strong> Caribbean Sea also grows<br />
epiphytically on <strong>algae</strong>, seagrasses <strong>and</strong> salt-marsh plants, <strong>and</strong> forms inconspicuous filaments,<br />
composed <strong>of</strong> long cells which are 10-27 µm across (Schneider <strong>and</strong> Searles 1991, Dawes <strong>and</strong><br />
Mathieson 2008, Littler et al. 2008). Another minute species, C. recurva Scagel (1966), is found along<br />
the Pacific coast <strong>of</strong> North America <strong>and</strong> forms minute thalli with filaments 6-10 µm across. Given that<br />
morphological features, especially cell dimensions, are now known to be poor indicators <strong>of</strong><br />
phylogenetic relationships in the Cladophorales (<strong>and</strong> <strong>green</strong> <strong>algae</strong> in general) (Leliaert et al. 2007),<br />
these species will need to be further examined using <strong>molecular</strong> tools to assess their phylogenetic<br />
affinity.<br />
Taxonomic conclusions<br />
The divergent phylogenetic position <strong>of</strong> U. curvatum, sister to the rest <strong>of</strong> the Cladophorales, along<br />
with a combination <strong>of</strong> distinctive morphological features such as the absence <strong>of</strong> pyrenoids, the<br />
diminutive size <strong>of</strong> the unbranched filaments <strong>and</strong> a discoid holdfast, warrants the recognition <strong>of</strong> a<br />
separate genus within a new family <strong>of</strong> Cladophorales:<br />
Okellyaceae Leliaert et Rueness, familia nov.<br />
Algae benthicae marinae, filamentibus simplicibus erectis curvatis, disco basali ad substratum affixae.<br />
Cellularum divisio intercalaris. Filamenta 3-8 cellulibus, usque 200 µm longa (in cultura usque 100<br />
cellulibus, 1 mm longa), diametro dilatato apicem versus. Cellulae apicales cylindricae obtusae,<br />
cellulae intercalares cylindricae, 3-20 µm latae, (1-) 2-4 (-8) nucleatae. Chloroplastus parietalis,<br />
pyrenoide absenti autem granis amyloideis. Zoosporangia apicalia et subapicalia, zoosporibus<br />
pluribus (8-32), e sporangioporo singulari emergentibus. Thalli epiphytici super algas crustosas in<br />
zona sublitorali.<br />
Marine benthic <strong>algae</strong> forming minute tufts <strong>of</strong> slightly curved, erect unbranched uniseriate filaments,<br />
attached by a basal discoid holdfast. Growth by intercalary cell divisions. Filaments composed <strong>of</strong> 3-8<br />
cells, up to 200 µm long (in culture sometimes up to 100 cells <strong>and</strong> 1 mm or more), diameter<br />
increasing towards the apex. Apical cell cylindrical with obtuse tip, intercalary cells cylindrical, 3-20<br />
µm in diameter, containing (1-) 2-4 (-8) nuclei. Chloroplast parietal, lacking pyrenoids but including<br />
starch grains. Multiple zoospores (8-32) developing by transformation <strong>of</strong> apical <strong>and</strong> subapical cells<br />
into zoosporangia, emerging through a single pore in the upper part <strong>of</strong> the cell. Thalli epiphytic on<br />
various crustose <strong>algae</strong> in the subtidal zone.<br />
Type genus: Okellya Leliaert et Rueness, gen. nov.<br />
Cum characteribus familia. Characters as for family.
126 CHAPTER 7<br />
Type species: Okellya curvata (Printz) Leliaert et Rueness, comb. nov.<br />
Basionym: Uronema curvatum Printz, Algenveg. Trondhjemsfj.: 233, pl. VII: figs 105-114 (1926).<br />
Etymology: named in honour <strong>of</strong> Charles J. O’Kelly for his pioneering <strong>and</strong> influential work on <strong>green</strong><br />
algal systematics.<br />
Urospora microscopica is most closely related to Chaetomorpha (type: Chaetomorpha linum) in the<br />
Cladophorales <strong>and</strong> is therefore transferred to that genus. Since the combination Chaetomorpha<br />
microscopica has already been made by Meyer (1927) for a freshwater filamentous cladophoralean<br />
species (later transferred to Cladochaete <strong>and</strong> Chaetocladiella), a new species epithet must be chosen.<br />
Chaetomorpha norvegica Leliaert et Rueness, nom. nov.<br />
Basionym: Urospora microscopica Levring, Lunds Univ. Årsskr. 2, 33(8): 30, fig. 2e-k (1937).<br />
Acknowledgements<br />
We are grateful to Caroline Vlaeminck for generating the sequence data. We thank Paul Goetghebeur<br />
for help with the Latin diagnosis. Funding was provided by FWO-Fl<strong>and</strong>ers (research grant G.0142.05,<br />
<strong>and</strong> post-doctoral fellowships to HV <strong>and</strong> FL) <strong>and</strong> the Ghent University BOF (doctoral fellowship to EC).
Supplementary material<br />
SYSTEMATICS OF MARINE MICROFILAMENTOUS GREEN ALGAE 127<br />
Table S1. Specimens for which new sequences were generated with collection data (location, collector, date <strong>of</strong><br />
collection <strong>and</strong> voucher information) <strong>and</strong> EMBL accession numbers.<br />
Species Collection <strong>and</strong> voucher information SSU rDNA partial LSU<br />
rDNA<br />
Uronema curvatum Printz Norway: county <strong>of</strong> Nordl<strong>and</strong>: Vega, subtidal, epiphytic on<br />
Peyssonnelia dubyi (Jan Rueness, 26 Oct 1990) 1<br />
Urospora microscopica Levring Norway: county <strong>of</strong> Hordal<strong>and</strong>: Busepollen in Austevoll,<br />
subtidal 3-5 m deep, epiphytic on Cystoclonium purpureum<br />
(Jan Rueness, Sep 1994) 1<br />
Chaetomorpha melagonium (F.<br />
Weber & Mohr) Kützing<br />
Wittrockiella lyallii (Harvey)<br />
Hoek, Ducker & Womersley<br />
Norway: Spitsbergen: Kongsfjord, subtidal, epilithic (Kai<br />
Bisch<strong>of</strong>, 14 July 2005, L: L0793540 / A88)<br />
New Zeal<strong>and</strong>: Fiordl<strong>and</strong>: Rum River estuary, high intertidal,<br />
on fallen tree (Svenja Heesch, 30 Sept 2005, WELT: UPN626<br />
/ H67) 2<br />
FN257508 FN257507<br />
FN257510 FN257509<br />
FN257511<br />
FN257512<br />
1<br />
Cultures maintained by JR <strong>and</strong> FL, <strong>and</strong> deposited in Culture Collection <strong>of</strong> Algae <strong>and</strong> Protozoa (CCAP):<br />
http://www.ccap.ac.uk/<br />
2<br />
UPN st<strong>and</strong>s for “Ulva project number”: http://www.maf.govt.nz/mafnet/publications/biosecurity-technical-<br />
papers/ulva/<br />
Table S2. Specification <strong>of</strong> the SSU <strong>and</strong> LSU rDNA sequence alignments <strong>and</strong> summary <strong>of</strong> models <strong>and</strong> model<br />
parameters obtained.<br />
SSU rDNA (Chlorophyta) LSU rDNA (Cladophorales +<br />
ulvophycean outgroups)<br />
Ingroup 28: Ulvophyceae, Chlorophyceae,<br />
Trebouxiophyceae<br />
20: Cladophorales<br />
Outgroup 2: Prasinophyceae 4: Ulvophyceae<br />
Alignment length / variable sites /<br />
parsimony informative sites<br />
Model estimated by the Akaike<br />
information criterion (AIC)<br />
1787 / 867 / 557 647 / 388 / 311<br />
GTR+I+G4 GTR+G4<br />
Estimated base frequencies (A/C/G/T) 0.24 / 0.21 / 0.28 / 0.27 0.21 / 0.24 / 0.32 / 0.23<br />
Estimated substitution rates<br />
(AC / AG / AT / CG / CT / GT)<br />
Among-site rate variation: proportion <strong>of</strong><br />
invariable sites (I) / gamma distribution<br />
shape parameter (G)<br />
1.00 / 2.60 / 1.16 / 1.16 / 4.76 / 1.00 0.65 / 2.15 / 1.28 / 0.75 / 5.11 / 1.00<br />
0.27 / 0.46 0 / 0.39
8<br />
General discussion<br />
This thesis focuses on phylogenetic relationships among <strong>green</strong> <strong>algae</strong> <strong>and</strong> <strong>molecular</strong> <strong>evolution</strong>ary<br />
processes such as gain-loss dynamics <strong>of</strong> elongation factor genes, distribution <strong>of</strong> a non-canonical code<br />
<strong>and</strong> patterns in genome bias.<br />
<strong>Phylogeny</strong> <strong>of</strong> the <strong>green</strong> <strong>algae</strong><br />
The <strong>green</strong> <strong>algae</strong> have long been recognized as a natural group, well differentiated from all other<br />
groups <strong>of</strong> <strong>algae</strong> by a number <strong>of</strong> shared characters, including intraplastidial starch storage, doublemembraned<br />
plastids containing chlorophylls a <strong>and</strong> b, stacked thylakoids, isokont zoids, <strong>and</strong> a stellate<br />
transition zone between the flagellar axoneme <strong>and</strong> the basal body. All these characters are also<br />
shared by l<strong>and</strong> plants (at least by the ones with flagellate stages in their life cycles), <strong>and</strong> hence the<br />
close relationship between <strong>green</strong> <strong>algae</strong> <strong>and</strong> l<strong>and</strong> plants has been noted for many decades. The first<br />
<strong>molecular</strong> phylogenetic studies based on SSU nrDNA sequences have confirmed the monophyly <strong>of</strong><br />
the <strong>green</strong> plants (Sogin et al. 1986, Gunderson et al. 1987). More recently, phylogenies based on<br />
nuclear <strong>and</strong> plastid genes have provided clear evidence that the <strong>green</strong> plants, red <strong>algae</strong> <strong>and</strong><br />
glaucophytes diverged after primary endosymbiosis <strong>of</strong> a non-photosynthetic eukaryotic host cell <strong>and</strong><br />
a cyanobacterium had taken place (Rodriguez-Ezpeleta et al. 2005).<br />
Traditional <strong>evolution</strong>ary schemes <strong>of</strong> <strong>green</strong> <strong>algae</strong> have been largely based on thallus organization <strong>and</strong><br />
it was assumed that ancestral coccoid or flagellated unicells have given rise to distinct lines <strong>of</strong><br />
increasing size <strong>and</strong> complexity (Fott 1971, see Chapter 1). Since the 1970’s a vast amount <strong>of</strong><br />
ultrastructural information has gradually been accumulated. The hypotheses formulated from<br />
comparative ultrastructure studies were highly inconsistent with the traditional systems <strong>of</strong><br />
classification; they showed that various vegetative features have evolved numerous times in the<br />
<strong>green</strong> <strong>algae</strong> (Irvine <strong>and</strong> John 1984). Molecular phylogenetic studies, mainly based on SSU nrDNA<br />
sequences, by <strong>and</strong> large corroborated the ultrastructural data, showing that convergent <strong>evolution</strong> is<br />
responsible for the presence <strong>of</strong> near-identical morphologies in distantly related <strong>green</strong> algal lineages<br />
(see Chapter 7). DNA sequence data have further r<strong>evolution</strong>ized our underst<strong>and</strong>ing <strong>of</strong> <strong>green</strong> algal<br />
<strong>evolution</strong>. Current hypotheses <strong>of</strong> the <strong>evolution</strong> <strong>of</strong> the Viridiplantae posit the early divergence <strong>of</strong> two<br />
main lineages from an ancestral <strong>green</strong> flagellated unicell (Lewis <strong>and</strong> McCourt 2004, Becker <strong>and</strong> Marin<br />
2009). One lineage, the Streptophyta, includes a paraphyletic assemblage <strong>of</strong> <strong>green</strong> <strong>algae</strong> <strong>and</strong> their<br />
descendents, the l<strong>and</strong> plants. The second lineage, the Chlorophyta, includes the majority <strong>of</strong> <strong>green</strong><br />
<strong>algae</strong>. This dichotomy is supported by fundamental differences in the ultrastructure <strong>of</strong> the flagellated<br />
cells (e.g. cruciate flagellar roots in Chlorophyta vs. unilateral flagellar root with multilayered<br />
structures in Streptophyta). Considerable progress has been made in clarifying the relationships<br />
among the streptophyte <strong>green</strong> <strong>algae</strong> <strong>and</strong> l<strong>and</strong> plants based on multi-marker <strong>and</strong> genome-scale<br />
datasets (Parkinson et al. 1999, Turmel et al. 2003, Turmel et al. 2006, Lemieux et al. 2007, Moore et<br />
al. 2007, Rodriguez-Ezpeleta et al. 2007, Saarela et al. 2007). Conversely, the <strong>evolution</strong>ary history <strong>of</strong>
130 CHAPTER 8<br />
the Chlorophyta has received much less attention. Phylogenetic relationships among three<br />
chlorophytan clades (Trebouxiophyceae, Chlorophyceae <strong>and</strong> Ulvophyceae) have been the subject <strong>of</strong><br />
long-st<strong>and</strong>ing debates, <strong>and</strong> the relationships within several major clades (e.g. the Ulvophyceae) have<br />
been difficult to elucidate.<br />
Figure 1. Phylogenetic signal <strong>of</strong> each site in the SSU alignment for the three alternative UTC topologies. Only a<br />
few sites contain phylogenetic signal concerning UTC topologies, i.e. colored sites, <strong>and</strong> all these sites favor a<br />
sister relationship between Chlorophyceae <strong>and</strong> Ulvophyceae, T(CU) topology. The phylogenetic signal <strong>of</strong> the 5%<br />
strongest signals is decreased to the 95 percentile <strong>of</strong> signal strength.
SSU nrDNA phylogenies<br />
GENERAL DISCUSSION 131<br />
SSU nrDNA phylogenies showed conflicting results regarding the relationships between Ulvophyceae,<br />
Trebouxiophyceae <strong>and</strong> Chlorophyceae (UTC classes). A majority <strong>of</strong> SSU nrDNA <strong>molecular</strong> phylogenies<br />
showed a sister relationship between the Trebouxiophyceae <strong>and</strong> Chlorophyceae (Friedl 1995,<br />
Bhattacharya et al. 1996, Krienitz et al. 2001, Lopez-Bautista <strong>and</strong> Chapman 2003). Alternatively, the<br />
Chlorophyceae <strong>and</strong> Ulvophyceae are resolved as sisters clades in other studies (Friedl <strong>and</strong> O'Kelly<br />
2002, Lewis <strong>and</strong> Lewis 2005, Watanabe <strong>and</strong> Nakayama 2007). Although the latter studies are more<br />
trustworthy due to a broader taxon sampling <strong>and</strong> the use <strong>of</strong> likelihood based methods with more<br />
realistic models <strong>of</strong> sequence <strong>evolution</strong>, these studies only included a small number <strong>of</strong> ulvophycean<br />
representatives, <strong>and</strong> almost never resulted in a comprehensive taxon sampling (i.e. including the<br />
Dasycladales, Bryopsidales, Cladophorales <strong>and</strong> Trentepohliales).<br />
We checked the phylogenetic signal <strong>of</strong> each site in the SSU alignment for the three alternative UTC<br />
topologies (Fig. 1). This shows that only a few sites contain phylogenetic signal concerning UTC<br />
topologies, i.e. colored sites, <strong>and</strong> that the great majority <strong>of</strong> these sites favor a sister relationship<br />
between Chlorophyceae <strong>and</strong> Ulvophyceae. This strong phylogenetic signal is contradictory to SSU<br />
phylogenies showing conflicting results. The source <strong>of</strong> these conflicting topologies can possibly be<br />
attributed to alignment differences <strong>and</strong> the use <strong>of</strong> other phylogenetic methods. Comparison <strong>of</strong> the<br />
signal maps in Fig. 1 with rate maps (Ben Ali et al. 2001, Wuyts et al. 2001) indicates that signal<br />
concerning the UTC relationships is mainly found in the faster-evolving parts <strong>of</strong> the molecule.<br />
Chloroplast phylogenomics<br />
Organellar genomes have been shown to be particularly useful for phylogenomic reconstruction<br />
because <strong>of</strong> their relatively high gene content, condensed in comparison to nuclear genomes. Also,<br />
organellar genes are typically single-copy, in contrast to many nuclear genes that are multi-copy in<br />
nature, which can have a confounding effect on phylogenetic reconstruction if paralogous copies are<br />
being analyzed. Although chloroplast genes have been widely employed to reconstruct phylogenetic<br />
relationships among relatively closely related <strong>green</strong> <strong>algae</strong> (e.g. within orders or genera, Verbruggen<br />
et al. 2007, De Clerck et al. 2008, Verbruggen et al. 2009), only a few studies have used chloroplast<br />
genes to reconstruct phylogenies across the entire <strong>green</strong> plant lineage (e.g. Daugbjerg et al. 1995).<br />
During the last decade a large number <strong>of</strong> complete chloroplast genomes from a wide range <strong>of</strong> <strong>green</strong><br />
<strong>algae</strong> have been sequenced, <strong>and</strong> chloroplast phylogenomic studies have been valuable to resolve<br />
problematic relationships among <strong>green</strong> <strong>algae</strong> (Qiu et al. 2006, Jansen et al. 2007, Lemieux et al. 2007,<br />
Turmel et al. 2008, Turmel et al. 2009). Despite the plethora <strong>of</strong> answers these datasets have<br />
provided, they have not been able to resolve the branching order <strong>of</strong> the UTC classes conclusively. A<br />
phylogenetic analysis <strong>of</strong> 58 concatenated chloroplast genes support a sister relationship between<br />
Ulvophyceae <strong>and</strong> Trebouxiophyceae, while Ulvophyceae <strong>and</strong> Chlorophyceae were sisters in a<br />
phylogenetic analysis <strong>of</strong> seven mitochondrial genes (Pombert et al. 2004, Pombert et al. 2005). The<br />
latter topology is also supported by chloroplast gene order data <strong>and</strong> genomic structural features<br />
(shared gene losses <strong>and</strong> rearrangements within conserved gene clusters). These phylogenomic<br />
analyses included two Ulvophyceae, Pseudendoclonium akinetum <strong>and</strong> Oltmannsiellopsis viridis, that<br />
belong to or are allied with the Ulvales—Ulotrichales group, respectively. Only recently, 23
132 CHAPTER 8<br />
chloroplast genes <strong>of</strong> the siphonous ulvophycean seaweed Caulerpa filiformis (Bryopsidales) have<br />
been sequenced (Zuccarello et al. 2009). Phylogenetic analyses <strong>of</strong> these new data suggested that<br />
neither Ulvophyceae nor Trebouxiophyceae are monophyletic, <strong>and</strong> showed that Caulerpa is more<br />
closely related to the trebouxiophyte Chlorella than to the ulvophytes Oltmannsiellopsis <strong>and</strong><br />
Pseudendoclonium (Zuccarello et al. 2009). Explanations for this unsuspected relationship have not<br />
yet been provided. Another remarkable observation is that it has proven impossible to amplify<br />
chloroplast genes in the Cladophorales despite considerable efforts in various labs. Chloroplast<br />
isolation has also proven difficult.<br />
Mitochondrial phylogenomics<br />
Complete mitochondrial genomes are available for a number <strong>of</strong> <strong>green</strong> <strong>algae</strong> (see Chapter 1),<br />
providing an independent opportunity to study problematic relationships among <strong>green</strong> <strong>algae</strong>.<br />
Phylogenetic analysis <strong>of</strong> seven mitochondrial genes supported a sister relationship between<br />
Ulvophyceae <strong>and</strong> Chlorophyceae (Pombert et al. 2004). Similar to chloroplast phylogenomic studies,<br />
this study is based on a limited sample <strong>of</strong> taxa: one prasinophyte, one trebouxiophyte, a few<br />
Chlorophyceae <strong>and</strong> Pseudendoclonium as the sole ulvophyte. Mesostigma was revealed as the oldest<br />
lineage within the Streptophyta in a phylogenetic study <strong>of</strong> 33 mitochondrial genes (Rodriguez-<br />
Ezpeleta et al. 2007).<br />
Amplifying nuclear markers: not a sinecure<br />
Only a few studies have employed nuclear markers other than SSU rDNA to reconstruct <strong>green</strong> algal<br />
phylogenies. Single gene phylogenies have been made for actin (An et al. 1999, Bhattacharya et al.<br />
2000), glucose-6-phosphate isomerase (Grauvogel et al. 2007), glyceraldehyde-3-phosphate<br />
dehydrogenase (Petersen et al. 2006, Robbens et al. 2007) <strong>and</strong> elongation factor genes (Keeling <strong>and</strong><br />
Inagaki 2004, Noble et al. 2007). Recently, a multigene phylogeny (Rodriguez-Ezpeleta et al. 2007)<br />
has been made. In all case, these studies included only a few chlorophyte <strong>green</strong> <strong>algae</strong> <strong>and</strong> <strong>of</strong>ten no<br />
ulvophyte.<br />
We chose to amplify nuclear genes in the first place because phylogenetic analyses inferred from SSU<br />
nrDNA, chloroplast or mitochondrial genes showed conflicting results with respect to the radiation <strong>of</strong><br />
UTC classes <strong>and</strong> relationships between ulvophycean orders. The amplification failure <strong>of</strong> chloroplast<br />
genes in Cladophorales poses an additional problem hampering the use <strong>of</strong> chloroplast genes for<br />
<strong>green</strong> algal phylogenetics. Furthermore, nuclear genes <strong>of</strong>fer the opportunity to study multiple<br />
independent loci.<br />
We can think <strong>of</strong> four principal reasons why nuclear genes are barely used in <strong>green</strong> algal phylogenetic<br />
studies: (1) the limited availability <strong>of</strong> genomic data for <strong>green</strong> <strong>algae</strong> pose a restriction on the range <strong>of</strong><br />
taxa which can be used directly as a data source or indirectly for primer design; (2) amplification <strong>and</strong><br />
characterization <strong>of</strong> single copy nuclear genes is more difficult compared with chloroplast <strong>and</strong> SSU<br />
nrDNA sequences that can be relatively easily amplified with universal primers (Small et al. 2004). For<br />
SSU nrDNA there are numerous copies per cell present, whereas only a single copy <strong>of</strong> each singly
GENERAL DISCUSSION 133<br />
copy nuclear gene is present in each nucleus; (3) presence <strong>of</strong> multiple, large introns at variable<br />
positions hampering PCR amplification at the genomic DNA level, <strong>and</strong> (4) assessment <strong>of</strong> orthology is<br />
difficult due to the presence <strong>of</strong> <strong>evolution</strong>ary processes such as gene duplications, incomplete lineage<br />
sorting <strong>and</strong> lateral gene transfer.<br />
We anticipated all these challenges <strong>and</strong> have succeeded to amplify ten nuclear markers among the<br />
different <strong>green</strong> algal classes: actin, glucose-6-phosphate isomerase (GPI), glyceraldehyde-3phosphate<br />
dehydrogenase (GapA), oxygen-evolving enhancer protein (OOE1), 40S ribosomal protein<br />
S9, 60S ribosomal proteins L3 <strong>and</strong> L17, histone <strong>and</strong> elongation factor-1 alpha (EF-1α) or elongation<br />
factor-like (EFL). To overcome the limited availability <strong>of</strong> genomic data among <strong>green</strong> <strong>algae</strong>, an EST<br />
library for the siphonocladous ulvophyte Cladophora coelothrix was generated. The obtained EST<br />
sequences considerably contributed to our success since they allowed primer design <strong>and</strong> successful<br />
amplification <strong>of</strong> OOE1, three ribosomal proteins, histone <strong>and</strong> EF-1α genes among <strong>green</strong> <strong>algae</strong>.<br />
We have not been able to amplify nuclear genes starting from DNA material, most likely due to the<br />
presence <strong>of</strong> large introns (e.g. observed in available actin genes). Therefore, we worked on mRNA <strong>of</strong><br />
actively dividing algal cells. Amplification <strong>of</strong> the targeted nuclear genes may have been facilitated by<br />
their high expression <strong>and</strong> mRNA levels. Actin is the monomeric subunit <strong>of</strong> micr<strong>of</strong>ilaments, one <strong>of</strong> the<br />
three major component <strong>of</strong> the cytoskeleton, which provides cell shape <strong>and</strong> mechanical support <strong>and</strong><br />
which is involved during intracellular transport <strong>and</strong> cell division. Histones are the chief protein<br />
components <strong>of</strong> chromatin, act as spools around which DNA winds <strong>and</strong> play an important role in gene<br />
regulation. Elongation factor-1 alpha (EF-1α) <strong>and</strong> elongation factor-like (EFL) are two key genes <strong>of</strong> the<br />
translational apparatus. GapA is an important enzyme <strong>of</strong> the Calvin cycle <strong>and</strong> glycolysis. Glucose-6phosphate<br />
isomerase (GPI) is an essential enzyme for gluconeogenesis <strong>and</strong> glycolysis. Oxygenevolving<br />
enhancer protein (OOE1) is an auxiliary component <strong>of</strong> the photosystem II manganese<br />
cluster. Eukaryotic ribosomes are made <strong>of</strong> four ribosomal RNAs <strong>and</strong> approximately 80 ribosomal<br />
proteins, <strong>of</strong> which we amplified three (40S ribosomal protein S9 <strong>and</strong> 60S ribosomal proteins L3 <strong>and</strong><br />
L17).<br />
A phylogenetic tree for each individual gene was made to check the orthology assumption. Histone<br />
genes were excluded from our final concatenated dataset because the orthology assumption was<br />
violated for the phylogenetic tree inferred from this gene. This is consistent with the observation that<br />
histone genes are highly duplicated across genomes (Nei <strong>and</strong> Rooney 2005; Wahlberg <strong>and</strong> Wheat<br />
2008). Elongation factor genes EF-1α <strong>and</strong> EFL were also excluded from the concatenated alignment<br />
because <strong>of</strong> their mutually exclusive distribution in the <strong>green</strong> plant lineage (Cocquyt et al. 2009). All<br />
other individual gene trees did not violate the orthology assumption, although some <strong>of</strong> the genes<br />
were known to be duplicated in the <strong>green</strong> plant lineage (e.g. GapA/B, Petersen et al. 2006).<br />
Conventional actin genes form complex gene families in various groups <strong>of</strong> complex multicellular<br />
organism (e.g., animals <strong>and</strong> l<strong>and</strong> plants), but are single copy in most <strong>green</strong> <strong>algae</strong>. The common<br />
ancestor <strong>of</strong> the Viridiplantae most likely contained a single actin gene, followed by independent<br />
duplications <strong>of</strong> actin genes in the Ulvophyceae: Acetabularia cliftonii contains 3 actin genes, <strong>and</strong> in<br />
the Trebouxiophyceae: Nannochloris maculate, N. atomus <strong>and</strong> Chlorella vulgaris each contain 2 actin<br />
genes (An et al. 1999, Yamamoto et al. 2001, Yamamoto et al. 2003). Despite the presence <strong>of</strong><br />
multiple actin gene duplications events in <strong>green</strong> <strong>algae</strong>, we believe that actin is a useful marker for<br />
deep phylogenetic reconstruction because these duplications appear to have occurred relatively
134 CHAPTER 8<br />
recently, <strong>of</strong>ten within a single species (e.g. several Nannochloris species only contain a single actin<br />
gene). The Actin Related Proteins Annotation server (ARPAnno) was used to check if all actin<br />
sequences were conventional actins (Goodson <strong>and</strong> Hawse 2002, Muller et al. 2005). L<strong>and</strong> plants have<br />
cytosolic <strong>and</strong> plastid glucose-6-phoshate isomerase (GPI). The former is thought to be vertically<br />
inherited while the latter is <strong>of</strong> cyanobacterial origin. The chlorophytes Chlamydomonas <strong>and</strong> Volvox<br />
contain a single, nuclear encoded GPI that is related to the cytosolic GPI <strong>of</strong> l<strong>and</strong> plants, which<br />
subsequently acquired a transit peptide for transport to the plastids (Grauvogel et al. 2007). All our<br />
GPI sequences are related to the cytosolic GPI genes <strong>of</strong> l<strong>and</strong> plants <strong>and</strong> to the plastid-targeted GPI<br />
gene <strong>of</strong> Chlamydomonas <strong>and</strong> Volvox. Glyceraldehyde-3-phosphate dehydrogenases (GAPDH) are<br />
prominent examples <strong>of</strong> homologous isoenzymes. In <strong>green</strong> <strong>algae</strong>, there are several nuclear encoded<br />
GAPDHs with different <strong>evolution</strong>ary origins. Glycolytic GapC genes probably have a proteobacterial<br />
(mitochondrial) origin, whereas photosynthetic GapA was acquired from the cyanobacterial ancestor<br />
<strong>of</strong> the chloroplast. Both genes have been duplicated: GapCp <strong>and</strong> GapB, respectively. GapB originated<br />
from a GapA gene duplication, but clearly differs from GapA by the presence <strong>of</strong> a specific C-terminal<br />
extension <strong>and</strong> several GapB specific amino acid insertions <strong>and</strong> positions. GapB is found in<br />
Streptophytes <strong>and</strong> in the genome <strong>of</strong> the unicellular prasinophyte Ostreoccoccus, but is absent in the<br />
genomes <strong>of</strong> Chlamydomonas <strong>and</strong> Volvox (Petersen et al. 2006, Robbens et al. 2007). For all <strong>green</strong><br />
<strong>algae</strong> sequenced in this study, we only retained homologous GapA sequences, which are clearly<br />
different from GapC sequences. GapB sequences were not amplified in any <strong>of</strong> the sampled <strong>green</strong><br />
<strong>algae</strong>.<br />
Resolving <strong>green</strong> algal phylogenies: contribution <strong>of</strong> nuclear genes<br />
In our opinion, the progress in our underst<strong>and</strong>ing <strong>of</strong> the phylogeny <strong>of</strong> <strong>green</strong> <strong>algae</strong> achieved in this<br />
study is due to (1) a good balance between taxon <strong>and</strong> gene sampling; (2) the use <strong>of</strong> model-based<br />
techniques (ML <strong>and</strong> BI), paying careful attention to the selection <strong>of</strong> suitable partitioning strategies<br />
<strong>and</strong> models <strong>of</strong> sequence <strong>evolution</strong>; <strong>and</strong> (3) the removal <strong>of</strong> fast-evolving sites to improve phylogenetic<br />
signal. The dataset on which our analyses were based consisted <strong>of</strong> seven single-copy nuclear markers<br />
(actin, GPI, GapA, OOE1, 40S ribosomal protein S9 <strong>and</strong> 60S ribosomal proteins L3 <strong>and</strong> L17), SSU<br />
nrDNA <strong>and</strong> two plastid genes (rbcL <strong>and</strong> atpB) for 43 taxa representing the major lineages <strong>of</strong> the<br />
Viridiplantae.<br />
We obtained high support across the topology <strong>of</strong> the Viridiplantae (see Chapter 2). We reveal the<br />
monophyly <strong>of</strong> the UTC classes <strong>and</strong> provided evidence for a sister relationship between the<br />
Ulvophyceae <strong>and</strong> Chlorophyceae with high support. We also inferred the relationships among the<br />
Ulvophyceae, which was found to consist <strong>of</strong> two main clades. The first clade contains the orders<br />
Ulvales <strong>and</strong> Ulotrichales. The second clade includes the early diverging genus Ignatius <strong>and</strong> a clade<br />
comprising the orders Trentepohliales, Bryopsidales, Dasycladales <strong>and</strong> Cladophorales, along with<br />
Blastophysa. In this clade, the Bryopsidales <strong>and</strong> Dasycladales are sisters, Blastophysa is most closely<br />
related to the Cladophorales, while the phylogenetic position <strong>of</strong> the Trentepohliales remains<br />
uncertain.
GENERAL DISCUSSION 135<br />
Figure 2. Substitution rates for SSU nrDNA, plastid <strong>and</strong> nuclear protein coding genes, measured as average<br />
substition rate in a sliding window across the alignment were calculated with HyPhy. Average substitution rates<br />
calculated only using variable sites (thick lines) are higher than average substitution rates based on all sites<br />
(thin lines) because the latter includes a number <strong>of</strong> constant sites that decrease the average substitution rate.<br />
(A) Average substitution rates based on the complete alignment. Nuclear genes have the highest substitution<br />
rates (the end <strong>of</strong> 60S ribosomal protein L3 is extremely fast), followed by plastid genes. The substitution<br />
rates for SSU nrDNA are generally low, except for a few positions.<br />
(B) Average substitution rates based on the 25% site stripped dataset, when looking at the rates <strong>of</strong> variable<br />
sites, average substitution rates for plastid <strong>and</strong> nuclear genes are higher than those for SSU nrDNA.<br />
Removal <strong>of</strong> fast-evolving sites: site stripping<br />
The rationale <strong>of</strong> removing fast-evolving sites (site stripping) is to remove noise from the data by<br />
removing those sites that are most likely to contain homoplasy <strong>and</strong> focusing on the more informative<br />
slow-evolving positions for phylogeny reconstruction (Philip et al. 2005). The usefulness <strong>of</strong> site<br />
stripping has been demonstrated in a number <strong>of</strong> studies that aimed to resolve deep nodes, for<br />
example a phylogenomic study <strong>of</strong> bilaterian animals (Delsuc et al. 2005). ML analysis <strong>of</strong> the complete<br />
bilaterian dataset (almost 150 genes) support the Coelomata hypothesis (arthropods +<br />
deuterostomes), most likely due to a long branch attraction artifact between the fast-evolving<br />
nematodes <strong>and</strong> the distant fungal outgroup. Progressive removal <strong>of</strong> fast-evolving sites resulted in<br />
increasing support for the Ecdysozoa hypothesis (arthropods + nematodes). This study showed that<br />
even advanced phylogenetic methods such as ML can be misled by differences in <strong>evolution</strong>ary rates<br />
among species.<br />
An analysis <strong>of</strong> sitewise substitution rates in our complete alignment shows that nuclear genes evolve<br />
fastest, followed by plastid genes <strong>and</strong> SSU nrDNA, which generally has very low substitution rates<br />
(Fig. 2 A). This is consistent with Fig. 1, which shows that the phylogenetic signal at many sites <strong>of</strong> the<br />
SSU nrDNA molecule is too low for resolving deep phylogenetic relationships. On the other h<strong>and</strong>,<br />
phylogenetic signal in some parts <strong>of</strong> the nuclear genes may be lost due to high sitewise substitution<br />
rates (e.g. end <strong>of</strong> 60S ribosomal protein L3). To counteract this erosion <strong>of</strong> ancient phylogenetic signal<br />
in our dataset, we removed the 25% fastest-evolving sites to increase the signal to noise ratio. This<br />
did not change phylogenetic relationships but it improved the phylogenetic signal for the branching
136 CHAPTER 8<br />
order <strong>of</strong> the UTC classes <strong>and</strong> among the Ulvophyceae. The inferred relationships between the<br />
radiation <strong>of</strong> the UTC classes <strong>and</strong> the fast-evolving Bryopsidales—Dasycladales—Cladophorales orders<br />
are thus stable even when only the most reliable phylogenetic characters are used. Figure 2 B shows<br />
that for the 25% site-stripped dataset sitewise substitution rates for variable sites are higher in<br />
plastid <strong>and</strong> nuclear genes than in SSU nrDNA. Likewise plastid <strong>and</strong> nuclear genes may contain more<br />
phylogenetic signal than SSU nrDNA.<br />
The comparison <strong>of</strong> the signal maps in Fig. 1 with rate maps (Ben Ali et al. 2001; Wuyts, Van de Peer,<br />
<strong>and</strong> Wachter 2001) indicates that signal concerning the UTC relationships is mainly found in the<br />
faster-evolving parts <strong>of</strong> the molecule. Because our site stripping approach removes these fastevolving<br />
sites, one may expect that most sites containing phylogenetic signal concerning the UTC<br />
relationships will be removed from the SSU nrDNA alignment. However, about 60% <strong>of</strong> the sites<br />
containing phylogenetic signal concerning the UTC relationships are retained in the 25% site stripped<br />
dataset. This relatively high number <strong>of</strong> retained fast-evolving sites can be due to the lower sitewise<br />
substitution rates for SSU nrDNA compared to plastid <strong>and</strong> nuclear genes (Fig. 2). Nevertheless, SSU<br />
nrDNA alone cannot resolve the UTC relationship but it is generally accepted that the information<br />
contained in a single genes is not enough to resolve deep relationships (Philippe et al. 2005), which is<br />
one <strong>of</strong> the reason why we based this study on 10 markers <strong>and</strong> not on a single gene.<br />
Figure 3. Difference between removal <strong>of</strong> the 25% fastest-evolving sites (site stripping) <strong>and</strong> r<strong>and</strong>om removal <strong>of</strong><br />
25% <strong>of</strong> the sites.<br />
(A) Rate-smoothed tree with indication <strong>of</strong> the epoch in which the relationships <strong>of</strong> interest are situated (gray<br />
box across figure).<br />
(B) The strength <strong>of</strong> the phylogenetic signal in the site-stripped alignment (black line) is much higher than that<br />
<strong>of</strong> the r<strong>and</strong>omly stripped alignments (blue b<strong>and</strong>) in the epoch <strong>of</strong> interest. The gray area represents the 95<br />
percentile <strong>of</strong> signal strength (measured as average bootstrap values in a sliding window across the tree)<br />
obtained from the 100 alignments from which 25% <strong>of</strong> the sites were removed at r<strong>and</strong>om.
GENERAL DISCUSSION 137<br />
Our site stripping approach is also validated by a comparison between r<strong>and</strong>om removal <strong>of</strong> sites <strong>and</strong><br />
selective removal <strong>of</strong> fast-evolving site. This exercise shows that only in the latter case phylogenetic<br />
signal is increased (Fig. 3). R<strong>and</strong>om removal <strong>of</strong> one fourth <strong>of</strong> the positions in the alignment results in<br />
a global decrease <strong>of</strong> phylogenetic signal, as measured by bootstrap support.<br />
Dating the <strong>green</strong> tree <strong>of</strong> life<br />
To interpret the ecological, morphological <strong>and</strong> cytological diversification <strong>of</strong> the <strong>green</strong> <strong>algae</strong> in a<br />
geological timeframe, we dated our phylogeny <strong>of</strong> the Viridiplantae using relaxed <strong>molecular</strong> clock<br />
methods <strong>and</strong> a combination <strong>of</strong> the fossil record <strong>and</strong> previous <strong>molecular</strong> clock results (Fig. 4). We<br />
used the lognormal clock relaxation approach (Thorne et al. 1998) in a Bayesian framework as<br />
implemented in PhyloBayes (Lartillot et al. 2007). This method assumes autocorrelated rates <strong>of</strong><br />
<strong>molecular</strong> <strong>evolution</strong>, more specifically that the logarithm <strong>of</strong> the rate <strong>of</strong> <strong>molecular</strong> <strong>evolution</strong> can be<br />
described by a Brownian motion process. This model indicates a rapid radiation <strong>of</strong> the UTC classes<br />
within a timeframe <strong>of</strong> ca. 20 my during the first period <strong>of</strong> the Neoproterozoic (between 900 my [852-<br />
957] <strong>and</strong> 881 my [835-935]). This rapid radiation <strong>of</strong> the UTC classes complicates the interpretation <strong>of</strong><br />
ecological diversifications. A broader taxon sampling within the Trebouxiophyceae <strong>and</strong><br />
Chlorophyceae may allow predictions about the number <strong>of</strong> times transitions from marine to<br />
freshwater <strong>and</strong> terrestrial habitats occurred. The inferred radiation time for the UTC classes precedes<br />
the Cryogenian period (850-635 my), in the middle <strong>of</strong> the Neoproterozoic, which is known as a period<br />
<strong>of</strong> severe glaciations during which ice sheets reached the equator, events better known as “Snowball<br />
Earth”.<br />
We show a Neoproterozoic diversification <strong>of</strong> all ulvophycean orders in a timeframe <strong>of</strong> ca. 130 my<br />
(between 826 my [792-870] <strong>and</strong> 596 my [500-686]). Originating from an ancestral marine<br />
prasinophyte, our phylogenetic tree indicates that transitions to freshwater <strong>and</strong> terrestrial habitats<br />
not only occurred in the Chlorophyceae <strong>and</strong> Trebouxiophyceae, but also several times independently<br />
within the predominantly marine Ulvophyceae (Lopez-Bautista et al. 2007, Becker <strong>and</strong> Marin 2009).<br />
A number <strong>of</strong> representatives within the Ulvales, Ulotrichales <strong>and</strong> Cladophorales are adapted to<br />
freshwater environments. Ignatius, all members <strong>of</strong> the Trentepohliales <strong>and</strong> two species <strong>of</strong><br />
Cladophorales (Cladophorella <strong>and</strong> Spongiochrysis) are growing in subaerial habitats (Fritsch 1944,<br />
Lopez-Bautista <strong>and</strong> Chapman 2003, Rindi et al. 2006, Watanabe <strong>and</strong> Nakayama 2007).<br />
Multicellularity evolved independently in the UTC classes. Within the Ulvophyceae, multicellularity<br />
arose independently in the Ulvales—Ulotrichales. In chapter 6, we calibrated a five-locus phylogeny<br />
<strong>of</strong> the siphonous orders Dasycladales <strong>and</strong> Bryopsidales using relaxed <strong>molecular</strong> clock methods<br />
calibrated with the fossil record. These models indicate a late Neoproterozoic or early Cambrian<br />
origin <strong>of</strong> the Dasycladales <strong>and</strong> Bryopsidales (571 million years [628–510]) <strong>and</strong> a diversification <strong>of</strong> the<br />
orders into their families during the Paleozoic. The siphonous thallus structure, which is essentially<br />
composed <strong>of</strong> a single giant cell containing numerous nuclei, is most likely derived from a<br />
multinucleate <strong>and</strong> multicellular common ancestor <strong>of</strong> the Bryopsidales—Dasycladales—Cladophorales<br />
(BCD clade). Additional support for the <strong>evolution</strong> <strong>of</strong> siphonous <strong>algae</strong> from a multicellular ancestor is<br />
provided by the occurrence <strong>of</strong> a cross wall at the base <strong>of</strong> each reproductive structure in one <strong>of</strong> the<br />
two major bryopsidalean lineages (the Bryopsidineae).
138 CHAPTER 8<br />
Figure 4. Chronogram <strong>of</strong> the Viridiplantae. Node ages were inferred using Bayesian inference assuming a<br />
relaxed <strong>molecular</strong> clock <strong>and</strong> a set <strong>of</strong> node age constraints derived from the fossil record <strong>and</strong> from Verbruggen<br />
et al. (2009). These calibration points are indicated on the tree. Values at nodes indicate average node ages <strong>and</strong><br />
bars represent 95% confidence intervals.
GENERAL DISCUSSION 139<br />
In the light <strong>of</strong> this interpretation, a reinterpretation <strong>of</strong> the fossil Proterocladus seems in place. This<br />
fossil, which is characterized by large cells with cross-walls, has been interpreted as an ancestor <strong>of</strong><br />
the Cladophorales (Butterfield et al. 1994). Our results now suggest that the ancestors <strong>of</strong> the BCD<br />
clade also featured this morphology <strong>and</strong> we propose that Proterocladus should be regarded as an<br />
ancestor <strong>of</strong> the BCD clade rather than <strong>of</strong> the Cladophorales. This is the interpretation we have used<br />
in our <strong>molecular</strong> clock study.<br />
Phylogenetic position <strong>of</strong> Blastophysa warrants the recognition <strong>of</strong> a new order<br />
The enigmatic, endophytic <strong>green</strong> alga Blastophysa, is usually placed in the cladophoralean family<br />
Chaetosiphonaceae based on morphological, ultrastructural, cytological, <strong>and</strong> biochemical features<br />
(O'Kelly <strong>and</strong> Floyd 1984). However, the phylogenetic position <strong>of</strong> Blastophysa has been doubted since<br />
its establishment. First, the monophyly <strong>of</strong> the family Chaetosiphonaceae is questionable due to<br />
differences in ultrastuctural features <strong>of</strong> motile cells between Blastophysa <strong>and</strong> Chaetosiphon.<br />
Ultrastructural features <strong>of</strong> the motile cells <strong>of</strong> Blastophysa are almost identical to these <strong>of</strong> the<br />
Cladophorales <strong>and</strong> Dasycladales <strong>and</strong> have less features in common with the Bryopsidales (Chappell et<br />
al. 1991). Blastophysa has <strong>of</strong>ten been allied with the Bryopsidales in taxonomic treatments <strong>of</strong><br />
seaweed flora’s (e.g. Burrows 1991, Brodie et al. 2007, Kraft 2007). Although, Parker (1970)<br />
suggested that Blastophysa is not related to the Bryopsidales based on the presence <strong>of</strong> cellulose I in<br />
the cell walls (Burrows 1991). Finally, a phylogeny based on SSU <strong>and</strong> LSU nrDNA placed Blastophysa<br />
at the base <strong>of</strong> the Cladophorales, Dasycladales <strong>and</strong> Bryopsidales (Zechman et al. 1990).<br />
Our multi-locus phylogeny <strong>of</strong> the Viridiplantae (Chapter 2), shows a sister relation between<br />
Blastophysa <strong>and</strong> the order Cladophorales. The unique ultrastructural features, along with the<br />
divergent phylogenetic position <strong>of</strong> Blastophysa would warrant the recognition <strong>of</strong> a separate order <strong>of</strong><br />
Ulvophyceae.<br />
Molecular <strong>evolution</strong> in <strong>green</strong> <strong>algae</strong><br />
There are several indications that pr<strong>of</strong>ound changes to the translational system <strong>of</strong> the Ulvophyceae<br />
have occurred, more specifically in the siphonous <strong>and</strong> siphonocladous seaweed Bryopsidales,<br />
Cladophorales <strong>and</strong> Dasycladales (BCD clade) <strong>and</strong> their sister lineages Ignatius <strong>and</strong> Trentepohliales.<br />
First, we showed that their elongation factors, key genes <strong>of</strong> the translational apparatus that bind to<br />
the tRNAs before they attach to the ribosome, are fundamentally different than those <strong>of</strong> other <strong>green</strong><br />
<strong>algae</strong>. In Chapter 3, we showed that elongation factor-1 alpha (EF-1α) <strong>and</strong> elongation factor-like<br />
(EFL) have an almost mutually exclusive distribution in the <strong>green</strong> plant lineage. The Streptophyta<br />
posses EF-1α except Mesostigma, which has EFL. All Chlorophyta encode EFL except the<br />
Ulvophyceae <strong>of</strong> the BCD clade <strong>and</strong> Ignatius. Due to amplification failure we could not find out which<br />
gene is present in Trentepohlia but its phylogenetic position strongly suggests the presence <strong>of</strong> EF-1α.<br />
The fact that the BCD clade <strong>and</strong> Ignatius use another elongation factor gene is in itself an indication<br />
for a change in the translational system. In Chapter 4, we discussed the presence <strong>and</strong> distribution <strong>of</strong><br />
a non-canonical code, which translates stop codons TAG <strong>and</strong> TAA to glutamine. This non-canonical
140 CHAPTER 8<br />
code is found in Dasycladales, Cladophorales + Blastophysa <strong>and</strong> Trentepohliales. The remaining<br />
Ulvophyceae <strong>and</strong> <strong>green</strong> <strong>algae</strong> use the st<strong>and</strong>ard code. The presence <strong>of</strong> a different code requires<br />
changes in translation termination, tRNA-species <strong>and</strong> tRNA synthetase specificity, all factors<br />
influencing the translational system. In Chapter 5, we analyzed the <strong>evolution</strong> <strong>of</strong> codon usage bias<br />
<strong>and</strong> showed that codon usage is less biased in multicellular <strong>and</strong> macroscopic species compared to<br />
small unicells, indicating a more uniform use <strong>of</strong> synonymous codons in the former organisms. Within<br />
the Chlorophyta, the prasinophytes, Trebouxiophyceae <strong>and</strong> Chlorophyceae have strong codon usage<br />
bias, whereas codon usage bias is low in all Ulvophyceae, except for the small colonial Ignatius. The<br />
low codon usage bias observed for most Ulvophyceae indicates a uniform use <strong>of</strong> synonymous<br />
codons, implying that the tRNA pool is diverse, which impacts the efficiency <strong>of</strong> the translational<br />
system. In Chapter 5, we also showed that GC content shows a similar trend as codon usage bias, the<br />
Ulvophyceae having lower GC content than the prasinophytes, Trebouxiophyceae <strong>and</strong><br />
Chlorophyceae. This trend is most pronounced in the Trentepohliales, Dasycladales <strong>and</strong> Bryopsidales.<br />
The link with the translational system is not directly clear but a low GC content may facilitate<br />
denaturation <strong>of</strong> the DNA during replication <strong>and</strong> transcription. Finally, rates <strong>of</strong> <strong>molecular</strong> <strong>evolution</strong><br />
are high in the Trentepohliales <strong>and</strong> BCD clade as indicated by the long root-to-tip path lengths in our<br />
phylogeny. These high rates <strong>of</strong> <strong>molecular</strong> <strong>evolution</strong> suggest that more mutations are fixed in these<br />
groups. It is striking that root-to-tip paths are particularly longer for the Trentepohliales <strong>and</strong> BCD<br />
clade in SSU nrDNA phylogenies compared to plastid gene phylogenies (data not shown). Because<br />
SSU nrDNA is the structural RNA for the small component <strong>of</strong> eukaryotic cytoplasmic ribosomes, this<br />
provides another indication for changes in the translational apparatus. Taken together, this evidence<br />
points to pr<strong>of</strong>ound changes in the translational apparatus.<br />
Perspectives for future research<br />
The approach applied in this study started with mining the available <strong>green</strong> algal genomic data (e.g.<br />
EST, complete genomes) <strong>and</strong> a newly generated cDNA library <strong>of</strong> a siphonocladous ulvophyte. This<br />
allowed designing primers that could amplify nuclear genes in a wide range <strong>of</strong> <strong>green</strong> <strong>algae</strong>.<br />
Amplification starting from genomic DNA was difficult, if not impossible, mainly due to the<br />
omnipresence <strong>of</strong> introns. The introns hampered the design <strong>of</strong> primers applicable to a wide range <strong>of</strong><br />
taxa at the genomic DNA level because length <strong>and</strong> position <strong>of</strong> introns are highly variable between<br />
different <strong>green</strong> algal species (e.g. actin). De novo sequencing <strong>of</strong> nuclear genomes <strong>of</strong> a selection <strong>of</strong><br />
<strong>green</strong> <strong>algae</strong> (e.g. with Roche 454 technology) could alleviate this need by permitting the<br />
identification <strong>of</strong> intronless genes <strong>and</strong> regions suitable for exon-primed intron crossing (EPIC).<br />
Next-generation sequencing technologies (NGST) parallelize the sequencing procedure, allowing<br />
rapid sequencing <strong>of</strong> billions <strong>of</strong> nucleotides simultaneously (e.g. Roche 454 technology, Rokas <strong>and</strong><br />
Abbot 2009). NGST data for a balanced set <strong>of</strong> <strong>green</strong> <strong>algae</strong> is likely to provide a major boost to the<br />
assembly <strong>of</strong> the <strong>green</strong> tree <strong>of</strong> life. This brute-force approach is probably more efficient than primer<br />
design <strong>and</strong> amplification <strong>of</strong> nuclear genes as was attempted in this study. In addition to serving the<br />
resolution <strong>of</strong> the tree <strong>of</strong> life, NGST data can also be used to explore several other aspects <strong>of</strong> genome<br />
<strong>evolution</strong>. NGST data are appropriate to evaluate the importance <strong>and</strong> relative contributions <strong>of</strong><br />
processes such as lineage sorting, hybridization <strong>and</strong> lateral gene transfer in shaping the respective
GENERAL DISCUSSION 141<br />
genomes (Rokas <strong>and</strong> Abbot 2009). Also the origin <strong>of</strong> new genes or gene clusters <strong>and</strong> the <strong>evolution</strong> <strong>of</strong><br />
introns <strong>and</strong> repetitive elements can be studied.<br />
NGST data for Ulvophyceae, especially siphonous <strong>and</strong> siphonocladous species, as well as<br />
Trebouxiophyceae would be particularly useful since genomic data for these groups are lacking or<br />
sparse. Most available <strong>green</strong> algal genomic data come from prasinophytes <strong>and</strong> Chlorophyceae, e.g.<br />
the recently released or nearly finished genomes <strong>of</strong> Chlamydomonas <strong>and</strong> Volvox (Chlorophyceae)<br />
<strong>and</strong> Bathycoccus <strong>and</strong> Micromonas (prasinophytes).<br />
With respect to my study, NGST data would allow testing the reliability <strong>of</strong> the observed differences in<br />
codon usage bias <strong>and</strong> GC content among <strong>green</strong> <strong>algae</strong> (Chapter 5). A comparison <strong>of</strong> genes that<br />
regulate translation (e.g. eukaryotic release factor, glutamine tRNA genes, genes responsible for<br />
nonsense-mediated mRNA decay) among the various ulvophyte lineages would be particularly<br />
interesting because this will further increase our knowledge about the pr<strong>of</strong>ound changes in<br />
translation machinery that occurred in these lineages as is indicated by the presence <strong>of</strong> a noncanonical<br />
genetic code, a different elongation factor gene, fast rates <strong>of</strong> <strong>molecular</strong> <strong>evolution</strong><br />
especially <strong>of</strong> the ribosomal RNA (SSU nrDNA) <strong>and</strong> a more balanced codon usage.<br />
Despite that NGST data for a balanced set <strong>of</strong> <strong>green</strong> <strong>algae</strong> would provide a lot <strong>of</strong> useful information,<br />
continuing the approach followed in this study can in the short term increase our knowledge about<br />
<strong>green</strong> algal phylogenetic. In a next stage it is advisable to incorporate more prasinophytess,<br />
Trebouxiophyceae <strong>and</strong> Chlorophyceae. A broader taxon sampling within the Trebouxiophyceae <strong>and</strong><br />
Chlorophyceae would allow definitive conclusion about the monophyletic nature <strong>of</strong> these classes <strong>and</strong><br />
could demonstrate whether the relationship between the UTC classes is robust to differences in<br />
taxon sampling. Although the class Ulvophyceae was covered by 21 species, also here improvements<br />
in taxon sampling can be beneficial. For example, Oltmannsiellopsis is considered to be an ulvophyte<br />
based on SSU nrDNA <strong>and</strong> complete chloroplast genome sequences (Pombert et al. 2006) despite<br />
having ultrastructural features reminiscent <strong>of</strong> prasinophytes, especially <strong>of</strong> the genus Tetraselmis<br />
(O’Kelly personal communication). Incorporation <strong>of</strong> Oltmannsiellopsis would therefore provide<br />
further insight into the <strong>evolution</strong> <strong>of</strong> the ulvophyte lineages.<br />
With respect to the non-canonical genetic code in some ulvophyceaen lineages, studying<br />
selenoproteins could also prove interesting. The amino acid selenocysteine is encoded by the stop<br />
codon TGA in conjunction with a selenocysteine insertion sequence (SECIS) element in the 3’UTR<br />
(Lobanov et al. 2007). The non-canonical code <strong>of</strong> some Ulvophyceae involves the reassignment <strong>of</strong><br />
stop codons TAG <strong>and</strong> TAA to glutamine, leaving TGA as the only stop codon. Because the<br />
Ulvophyceae only use TGA as stop codon, the last stop codon in a selenoprotein should still<br />
terminate translation while the in-frame TGA codons should encode selenocysteine in the presence<br />
<strong>of</strong> a SECIS element. In this context, it would be useful to know whether selenoproteins are converted<br />
back to conventional cysteine-containing proteins in Ulvophyceae with a non-canonical code.
References<br />
Abascal F, Zardoya R, <strong>and</strong> Posada D. 2005. ProtTest: selection <strong>of</strong> best-fit models <strong>of</strong> protein <strong>evolution</strong>.<br />
Bioinformatics 21:2104-2105.<br />
Abbott IA <strong>and</strong> Huisman JM. 2004. Marine <strong>green</strong> <strong>and</strong> brown <strong>algae</strong> <strong>of</strong> the Hawaiian Isl<strong>and</strong>s. Bishop<br />
Museum Press, Honolulu.<br />
Adl SM, Simpson AGB, Farmer MA, Andersen RA, Anderson OR, Barta JR, Bowser SS, Brugerolle G,<br />
Fensome RA, Fredericq S, James TY, Karpov S, Kugrens P, Krug J, Lane CE, Lewis LA, Lodge J,<br />
Lynn DH, Mann DG, McCourt RM, Mendoza L, Moestrup Ø, Mozley-St<strong>and</strong>ridge SE, Nerad TA,<br />
Shearer CA, Smirnov AV, Spiegel FW, <strong>and</strong> Taylor M. 2005. The new higher level classification<br />
<strong>of</strong> eukaryotes with emphasis on the taxonomy <strong>of</strong> protists. Journal <strong>of</strong> Eukaryotic Microbiology<br />
52:399-451.<br />
Akashi H. 1995. Inferring weak selection from patterns <strong>of</strong> polymorphism <strong>and</strong> divergence at silent<br />
sites in Drosophila DNA. Genetics 139:1067-1076.<br />
An SS, Mopps B, Weber K, <strong>and</strong> Bhattacharya D. 1999. The origin <strong>and</strong> <strong>evolution</strong> <strong>of</strong> <strong>green</strong> algal <strong>and</strong><br />
plant actins. Molecular Biology <strong>and</strong> Evolution 16:275-285.<br />
Andersen R. 2005. Algal culturing techniques. Elsevier Academic Press.<br />
Andersson JO, Sjogren AM, Davis LAM, Embley TM, <strong>and</strong> Roger AJ. 2003. Phylogenetic analyses <strong>of</strong><br />
diplomonad genes reveal frequent lateral gene transfers affecting eukaryotes. Current<br />
Biology 13:94-104.<br />
Andersson JO. 2005. Lateral gene transfer in eukaryotes. Cellular <strong>and</strong> Molecular Life Sciences<br />
62:1182-1197.<br />
Angellotti MC, Bhuiyan SB, Chen G, <strong>and</strong> Wan XF. 2007. CodonO: codon usage bias analysis within <strong>and</strong><br />
across genomes. Nucleic Acids Research 35:W132-W136.<br />
Archibald JM. 2005. Jumping genes <strong>and</strong> shrinking genomes - Probing the <strong>evolution</strong> <strong>of</strong> eukaryotic<br />
photosynthesis with genomics. IUBMB Life 57:539-547.<br />
Archibald JM. 2008. Plastid <strong>evolution</strong>: Remnant algal genes in ciliates. Current Biology 18:R663-R665.<br />
Areschoug JE. 1866. Observationes phycologicae. Particula prima. De Confervaceis nonnullis. Nova<br />
Acta Regiae Societatis Scientiarum Upsaliensis Ser 3, 6(2):1-26.<br />
Badour SS. 1981. The inorganic carbon requirements <strong>of</strong> Chlamydomonas segnis (Chlorophyceae) for<br />
cell development in synchronous cultures. Journal <strong>of</strong> <strong>Phycology</strong> 17:293-299.<br />
Baker KE <strong>and</strong> Parker R. 2004. Nonsense-mediated mRNA decay: terminating erroneous gene<br />
expression. Current Opinion in Cell Biology 16:293-299.<br />
Baldauf SL, Palmer JD, <strong>and</strong> Doolittle WF. 1996. The root <strong>of</strong> the universal tree <strong>and</strong> the origin <strong>of</strong><br />
eukaryotes based on elongation factor phylogeny. Proceedings <strong>of</strong> the National Academy <strong>of</strong><br />
Sciences <strong>of</strong> the United States <strong>of</strong> America 93:7749-7754.<br />
Baldauf SL <strong>and</strong> Doolittle WF. 1997. Origin <strong>and</strong> <strong>evolution</strong> <strong>of</strong> the slime molds (Mycetozoa). Proceedings<br />
<strong>of</strong> the National Academy <strong>of</strong> Sciences <strong>of</strong> the United States <strong>of</strong> America 94:12007-12012.<br />
Baldauf SL. 2008. An overview <strong>of</strong> the phylogeny <strong>and</strong> diversity <strong>of</strong> eukaryotes. Journal <strong>of</strong> Systematics<br />
<strong>and</strong> Evolution 46:263-273.<br />
Barker D, Meade A, <strong>and</strong> Pagel M. 2007. Constrained models <strong>of</strong> <strong>evolution</strong> lead to improved prediction<br />
<strong>of</strong> functional linkage from correlated gain <strong>and</strong> loss <strong>of</strong> genes. Bioinformatics 23:14-20.
144 REFERENCES<br />
Bartsch I <strong>and</strong> Kuhlenkamp R. 2000. The marine macro<strong>algae</strong> <strong>of</strong> Helgol<strong>and</strong> (North Sea): an annotated<br />
list <strong>of</strong> records between 1845 <strong>and</strong> 1999. Helgol<strong>and</strong> Marine Research 54:160-189.<br />
Becker B <strong>and</strong> Marin B. 2009. Streptophyte <strong>algae</strong> <strong>and</strong> the origin <strong>of</strong> embryophytes. Annals <strong>of</strong> Botany<br />
103:999–1004.<br />
Beier H <strong>and</strong> Grimm M. 2001. Misreading <strong>of</strong> termination codons in eukaryotes by natural nonsense<br />
suppressor tRNAs. Nucleic Acids Research 29:4767-4782.<br />
Beltran M, Jiggins CD, Brower AVZ, Bermingham E, <strong>and</strong> Mallet J. 2007. Do pollen feeding, pupalmating<br />
<strong>and</strong> larval gregariousness have a single origin in Heliconius butterflies? Inferences<br />
from multilocus DNA sequence data. Biological Journal <strong>of</strong> the Linnean Society 92:221-239.<br />
Ben Ali A, De Baere R, Van der Auwera G, De Wachter R, <strong>and</strong> Van de Peer Y. 2001. Phylogenetic<br />
relationships among <strong>algae</strong> based on complete large-subunit rRNA sequences. International<br />
Journal <strong>of</strong> Systematic <strong>and</strong> Evolutionary Microbiology 51:737-749.<br />
Berger S <strong>and</strong> Liddle LB. 2003. The life cycle <strong>of</strong> Acetabularia (Dasycladales, Chlorophyta): textbook<br />
accounts are wrong. Phycologia 42:204-207.<br />
Berney C <strong>and</strong> Pawlowski J. 2006. A <strong>molecular</strong> time-scale for eukaryote <strong>evolution</strong> recalibrated with<br />
the continuous micr<strong>of</strong>ossil record. Proceedings <strong>of</strong> the Royal Society B-Biological Sciences<br />
273:1867-1872.<br />
Bhattacharya D, Stickel SK, <strong>and</strong> Sogin ML. 1993. Isolation <strong>and</strong> <strong>molecular</strong> phylogenetic analysis <strong>of</strong> actin<br />
coding regions from Emiliania huxleyi, a prymnesiophyte alga, by reverse transcriptase <strong>and</strong><br />
PCR methods. Molecular Biology <strong>and</strong> Evolution 10:689-703.<br />
Bhattacharya D, Friedl T, <strong>and</strong> Damberger S. 1996. Nuclear-encoded rDNA group I introns: Origin <strong>and</strong><br />
phylogenetic relationships <strong>of</strong> insertion site lineages in the <strong>green</strong> <strong>algae</strong>. Molecular Biology <strong>and</strong><br />
Evolution 13:978-989.<br />
Bhattacharya D, Weber K, An SS, <strong>and</strong> Berning-Koch W. 1998. Actin phylogeny identifies Mesostigma<br />
viride as a flagellate ancestor <strong>of</strong> the l<strong>and</strong> plants. Journal <strong>of</strong> Molecular Evolution 47:544-550.<br />
Bhattacharya D, Aubry J, Twait EC, <strong>and</strong> Jurk S. 2000. Actin gene duplication <strong>and</strong> the <strong>evolution</strong> <strong>of</strong><br />
morphological complexity in l<strong>and</strong> plants. Journal <strong>of</strong> <strong>Phycology</strong> 36:813-820.<br />
Bold HC <strong>and</strong> Wynne MJ. 1985. Introduction to the Algae, 2nd edition. Prentice-Hall, New Jersey.<br />
Booton GC, Floyd GL, <strong>and</strong> Fuerst PA. 1998. Origins <strong>and</strong> affinities <strong>of</strong> the filamentous <strong>green</strong> algal orders<br />
Chaetophorales <strong>and</strong> Oedogoniales based on 18S rRNA gene sequences. Journal <strong>of</strong> <strong>Phycology</strong><br />
34:312-318.<br />
Brinkmann H, Van der Giezen M, Zhou Y, De Raucourt GP, <strong>and</strong> Philippe H. 2005. An empirical<br />
assessment <strong>of</strong> long-branch attraction artefacts in deep eukaryotic phylogenomics. Systematic<br />
Biology 54:743-757.<br />
Brodie J, Maggs CA, <strong>and</strong> John DM. 2007. Green seaweeds <strong>of</strong> Britain <strong>and</strong> Irel<strong>and</strong>. British Phycological<br />
Society, London.<br />
Brown JM <strong>and</strong> Lemmon AR. 2007. The importance <strong>of</strong> data partitioning <strong>and</strong> the utility <strong>of</strong> bayes factors<br />
in Bayesian phylogenetics. Systematic Biology 56:643-655.<br />
Bulmer M. 1991. The selection-mutation-drift theory <strong>of</strong> synonymous codon usage. Genetics 129:897-<br />
907.<br />
Burrows EM. 1991. Seaweeds <strong>of</strong> the British Isles. Natural History Museum Publications, London.<br />
Butterfield NJ, Knoll AH, <strong>and</strong> Swett K. 1994. Paleobiology <strong>of</strong> the Neoproterozoic Svanbergfjellet<br />
formation, Spitsbergen. Fossils <strong>and</strong> Strata 34:1-84.
Castresana J. 2000. Selection <strong>of</strong> conserved blocks from multiple alignments for their use in<br />
phylogenetic analysis. Molecular Biology <strong>and</strong> Evolution 17:540-552.<br />
Cavalier-Smith T. 1981. Eukaryote kingdoms: Seven or nine? Biosystems 14:461-481.<br />
REFERENCES 145<br />
Chappell DF, O'Kelly CJ, <strong>and</strong> Floyd GL. 1991. Flagellar apparatus <strong>of</strong> the biflagellate zoospores <strong>of</strong> the<br />
enigmatic marine <strong>green</strong> alga Blastophysa rhizopus. Journal <strong>of</strong> <strong>Phycology</strong> 27:423-428.<br />
Chaudhary BT. 1979. Some observations on the morphology, reproduction <strong>and</strong> cytology <strong>of</strong> the genus<br />
Uronema Lagh. (Ulotrichales, Chlorophyceae) (Note). Phycologia 18:299-302.<br />
Chen SL, Lee W, Hottes AK, Shapiro L, <strong>and</strong> McAdams HH. 2004. Codon usage between genomes is<br />
constrained by genome-wide mutational processes. Proceedings <strong>of</strong> the National Academy <strong>of</strong><br />
Sciences <strong>of</strong> the United States <strong>of</strong> America 101:3480-3485.<br />
Chisholm JRM, Dauga C, Ageron E, Grimont PAD, <strong>and</strong> Jaubert JM. 1996. 'Roots' in mixotrophic <strong>algae</strong>.<br />
Nature 381:382-382.<br />
Cocquyt E, Verbruggen H, Leliaert F, Zechman FW, Sabbe K, <strong>and</strong> De Clerck O. 2009. Gain <strong>and</strong> loss <strong>of</strong><br />
elongation factor genes in <strong>green</strong> <strong>algae</strong>. BMC Evolutionary Biology 9:39.<br />
Cocquyt E, Gile GH, Leliaert F, Verbruggen H, Keeling P, <strong>and</strong> De Clerck O. in prep. Complex<br />
phylogenetic distribution <strong>of</strong> a non-canonical genetic code in <strong>green</strong> <strong>algae</strong>.<br />
Cocquyt E, Verbruggen H, Leliaert F, <strong>and</strong> De Clerck O. submitted. Ancient relationships among <strong>green</strong><br />
<strong>algae</strong> inferred from nuclear <strong>and</strong> chloroplast genes.<br />
Cohen J <strong>and</strong> Adoutte A. 1995. Why does the genetic code deviate so easily in ciliates? Biology <strong>of</strong> the<br />
Cell 85:105-108.<br />
Collins FS <strong>and</strong> Hervey AB. 1917. The <strong>algae</strong> <strong>of</strong> Bermuda. Proceedings <strong>of</strong> the National Academy <strong>of</strong><br />
Sciences <strong>of</strong> the United States <strong>of</strong> America 53.<br />
Coppejans E. versie 1998-1999. Syllabus Morfologie en Systematiek van de “Lagere Planten”. Partim<br />
Algologie. Universiteit Gent.<br />
Cutter AD, Wasmuth JD, <strong>and</strong> Blaxter ML. 2006. The <strong>evolution</strong> <strong>of</strong> biased codon <strong>and</strong> amino acid usage<br />
in nematode genomes. Molecular Biology <strong>and</strong> Evolution 23:2303-2315.<br />
Daugbjerg N, Moestrup Ø, <strong>and</strong> Arct<strong>and</strong>er P. 1995. <strong>Phylogeny</strong> <strong>of</strong> genera <strong>of</strong> Prasinophyceae <strong>and</strong><br />
Pedinophyceae (Chlorophyta) deduced from <strong>molecular</strong> analysis <strong>of</strong> the rbcL gene.<br />
Phycological Research 43:203–213.<br />
Dawes CJ <strong>and</strong> Mathieson AC. 2008. The seaweeds <strong>of</strong> Florida. University Press <strong>of</strong> Florida, Gainesville,<br />
Florida.<br />
De Clerck O, Verbruggen H, Huisman JM, Faye EJ, Leliaert F, Schils T, <strong>and</strong> Coppejans E. 2008.<br />
Systematics <strong>and</strong> biogeography <strong>of</strong> the genus Pseudocodium (Bryopsidales, Chlorophyta),<br />
including the description <strong>of</strong> P. natalense sp nov from South Africa. Phycologia 47:225-235.<br />
de Koning AP, Noble GP, Heiss AA, Wong J, <strong>and</strong> Keeling PJ. 2008. Environmental PCR survey to<br />
determine the distribution <strong>of</strong> a non-canonical genetic code in uncultivable oxymonads.<br />
Environmental Microbiology 10:65-74.<br />
De Rijk P <strong>and</strong> De Wachter R. 1993. DCSE, an interactive tool for sequence alignment <strong>and</strong> secondary<br />
structure research. Comput. Appl. Biosci. 9:735-740.<br />
De Rijk P, Robbrecht E, de Hoog S, Caers A, Van de Peer Y, <strong>and</strong> De Wachter R. 1999. Database on the<br />
structure <strong>of</strong> large subunit ribosomal RNA. Nucleic Acids Research 27:174-178.<br />
Delsuc F, Brinkmann H, <strong>and</strong> Philippe H. 2005. Phylogenomics <strong>and</strong> the reconstruction <strong>of</strong> the tree <strong>of</strong><br />
life. Nature Reviews Genetics 6:361-375.
146 REFERENCES<br />
Derelle E, Ferraz C, Rombauts S, Rouze P, Worden AZ, Robbens S, Partensky F, Degroeve S, Echeynie<br />
S, Cooke R, Saeys Y, Wuyts J, Jabbari K, Bowler C, Panaud O, Piegu B, Ball SG, Ral JP, Bouget<br />
FY, Piganeau G, De Baets B, Picard A, Delseny M, Demaille J, Van de Peer Y, <strong>and</strong> Moreau H.<br />
2006. Genome analysis <strong>of</strong> the smallest free-living eukaryote Ostreococcus tauri unveils many<br />
unique features. Proceedings <strong>of</strong> the National Academy <strong>of</strong> Sciences <strong>of</strong> the United States <strong>of</strong><br />
America 103:11647-11652.<br />
DOE Joint Genome Institute. www.jgi.doe.gov<br />
dos Reis M <strong>and</strong> Wernisch L. 2009. Estimating translational selection in eukaryotic genomes.<br />
Molecular Biology <strong>and</strong> Evolution 26:451-461.<br />
Douzery EJP, Snell EA, Bapteste E, Delsuc F, <strong>and</strong> Philippe H. 2004. The timing <strong>of</strong> eukaryotic <strong>evolution</strong>:<br />
Does a relaxed <strong>molecular</strong> clock reconcile proteins <strong>and</strong> fossils? Proceedings <strong>of</strong> the National<br />
Academy <strong>of</strong> Sciences <strong>of</strong> the United States <strong>of</strong> America 101:15386-15391.<br />
Drew EA <strong>and</strong> Abel KM. 1992. Studies on Halimeda IV. An endogenous rhythm <strong>of</strong> chloroplast<br />
migration in the siphonous <strong>green</strong>-alga, H. distorta. Journal <strong>of</strong> Interdisciplinary Cycle Research<br />
23:128-135.<br />
Driskell AC, Ane C, Burleigh JG, McMahon MM, O'Meara BC, <strong>and</strong> S<strong>and</strong>erson MJ. 2004. Prospects for<br />
building the tree <strong>of</strong> life from large sequence databases. Science 306:1172-1174.<br />
Duret L <strong>and</strong> Mouchiroud D. 1999. Expression pattern <strong>and</strong>, surprisingly, gene length shape codon<br />
usage in Caenorhabditis, Drosophila, Arabidopsis. Proceedings <strong>of</strong> the National Academy <strong>of</strong><br />
Sciences <strong>of</strong> the United States <strong>of</strong> America 96:4482-4487.<br />
Dybvig K, Cao Z, French CT, <strong>and</strong> Yu HL. 2007. Evidence for type III restriction <strong>and</strong> modification<br />
systems in Mycoplasma pulmonis. Journal <strong>of</strong> Bacteriology 189:2197-2202.<br />
Edgar RC. 2004. MUSCLE: multiple sequence alignment with high accuracy <strong>and</strong> high throughput.<br />
Nucleic Acids Research 32:1792-1797.<br />
Fawley MW, Yun Y, <strong>and</strong> Qin M. 2000. Phylogenetic analyses <strong>of</strong> 18S rDNA sequences reveal a new<br />
coccoid lineage <strong>of</strong> the Prasinophyceae (Chlorophyta). Journal <strong>of</strong> <strong>Phycology</strong> 36:387-393.<br />
Feldmann J. 1954. Inventaire de la flore marine de Rosc<strong>of</strong>f. Algues, champignons, lichens et<br />
spermatophytes. Trav. St. Biol. Rosc<strong>of</strong>f, Nouv. Sér. Suppl. 6:152.<br />
Felsenstein J. 1985. Confidence-limits on phylogenies - an approach using the bootstrap. Evolution<br />
39:783-791.<br />
Felsenstein J. 2005. PHYLIP (<strong>Phylogeny</strong> Inference Package) version 3.6.<br />
http://<strong>evolution</strong>.genetics.washington.edu/phylip/<br />
Fenchel T <strong>and</strong> Finlay BJ. 2004. The ubiquity <strong>of</strong> small species: Patterns <strong>of</strong> local <strong>and</strong> global diversity.<br />
Bioscience 54:777-784.<br />
Finlay BJ. 2002. Global dispersal <strong>of</strong> free-living microbial eukaryote species. Science 296:1061-1063.<br />
Floyd GL <strong>and</strong> O' Kelly CJ. 1984. Motile cell ultrastructure <strong>and</strong> the circumscription <strong>of</strong> the orders<br />
Ulotrichales <strong>and</strong> Ulvales (Ulvophyceae, Chlorophyta). American Journal <strong>of</strong> Botany 71:111–<br />
120.<br />
Foslie M. 1881. Om nogle nye arctiske havalger. Christiania Vidensk.-Selsk. Forh. 14:1-14.<br />
Fott B. 1971. Algenkunde. 2nd Ed. VEB Fischer, Jena.<br />
Friedl T. 1995. Inferring taxonomic positions <strong>and</strong> testing genus level assignments in coccoid <strong>green</strong><br />
lichen <strong>algae</strong> - a phylogenetic analysis <strong>of</strong> 18S ribosomal-RNA sequences from Dictyochloropsis<br />
reticulata <strong>and</strong> from members <strong>of</strong> the genus Myrmecia (Chlorophyta, Trebouxiophyceae cl.<br />
nov.). Journal <strong>of</strong> <strong>Phycology</strong> 31:632-639.
REFERENCES 147<br />
Friedl T <strong>and</strong> O'Kelly CJ. 2002. Phylogenetic relationships <strong>of</strong> <strong>green</strong> <strong>algae</strong> assigned to the genus<br />
Planophila (Chlorophyta): evidence from 18S rDNA sequence data <strong>and</strong> ultrastructure.<br />
European Journal <strong>of</strong> <strong>Phycology</strong> 37:373-384.<br />
Fritsch FE. 1944. Cladophorella calcicola nov. gen. et sp., a terrestrial member <strong>of</strong> the Cladophorales.<br />
Annals <strong>of</strong> Botany N.S. 8:157-171.<br />
Galtier N. 2007. A model <strong>of</strong> horizontal gene transfer <strong>and</strong> the bacterial phylogeny problem. Systematic<br />
Biology 56:633-642.<br />
Geuten K, Massingham T, Darius P, Smets E, <strong>and</strong> Goldman N. 2007. Experimental design criteria in<br />
phylogenetics: where to add taxa. Systematic Biology 56:609-622.<br />
Gile GH, Patron NJ, <strong>and</strong> Keeling PJ. 2006. EFL GTPase in cryptomonads <strong>and</strong> the distribution <strong>of</strong> EFL <strong>and</strong><br />
EF-1α in chromalveolates. Protist 157:435-444.<br />
Gile GH, Novis P, Cragg D, Zuccarello GC, <strong>and</strong> Keeling P. 2009. The distribution <strong>of</strong> elongation factor-<br />
1alpha (EF-1α), elongation factor-like (EFL), <strong>and</strong> a non-canonical genetic code in the<br />
Ulvophyceae: discrete genetic characters support a consistent phylogenetic framework.<br />
Journal <strong>of</strong> Eukaryotic Microbiology in press.<br />
Gogarten JP. 2003. Gene transfer: Gene swapping craze reaches eukaryotes. Current Biology 13:R53-<br />
R54.<br />
Goodson HV <strong>and</strong> Hawse WF. 2002. Molecular <strong>evolution</strong> <strong>of</strong> the actin family. Journal <strong>of</strong> Cell Science<br />
115:2619-2622.<br />
Graham LE, Graham JM, <strong>and</strong> Wilcox LW. 2009. Algae. Benjamin Cummings, San Francisco, Boston,<br />
New York, Cape Town, Hong Kong, London, Madrid, Mexico City, Montreal, Munich, Paris,<br />
Singapore, Sydney, Tokyo, Toronto.<br />
Grauvogel C, Brinkmann H, <strong>and</strong> Petersen J. 2007. Evolution <strong>of</strong> the glucose-6-phosphate isomerase:<br />
The plasticity <strong>of</strong> primary metabolism in photosynthetic eukaryotes. Molecular Biology <strong>and</strong><br />
Evolution 24:1611-1621.<br />
Guillou L, Eikrem W, Chretiennot-Dinet MJ, Le Gall F, Massana R, Romari K, Pedros-Alio C, <strong>and</strong> Vaulot<br />
D. 2004. Diversity <strong>of</strong> picoplanktonic prasinophytes assessed by direct nuclear SSU rDNA<br />
sequencing <strong>of</strong> environmental samples <strong>and</strong> novel isolates retrieved from oceanic <strong>and</strong> coastal<br />
marine ecosystems. Protist 155:193-214.<br />
Guindon S <strong>and</strong> Gascuel O. 2003. A simple, fast, <strong>and</strong> accurate algorithm to estimate large phylogenies<br />
by maximum likelihood. Systematic Biology 52:696-704.<br />
Guiry MD <strong>and</strong> Guiry GM. 2009. AlgaeBase. World-wide electronic publication. National University <strong>of</strong><br />
Irel<strong>and</strong>, Galway. http://www.<strong>algae</strong>base.org<br />
Gunderson JH, Elwood HJ, Ingold A, Kindle KL, <strong>and</strong> Sogin ML. 1987. Phylogenetic relationships<br />
between chlorophytes, chrysophytes, <strong>and</strong> Oomycetes. Proceedings <strong>of</strong> the National Academy<br />
<strong>of</strong> Sciences <strong>of</strong> the United States <strong>of</strong> America 84:5823-5827.<br />
Hall JD <strong>and</strong> Delwiche CF. 2007. In the shadow <strong>of</strong> giants: systematics <strong>of</strong> the charophyte <strong>green</strong> <strong>algae</strong>.<br />
Pp. 155-169 in J. Brodie, <strong>and</strong> J. Lewis, eds. Unravelling the <strong>algae</strong>: the past, present, <strong>and</strong> future<br />
<strong>of</strong> algal systematics. The Systematics Association Special Volume Series, 75. CRC Press, Boca<br />
Raton, FL, USA.<br />
Hanyu N, Kuchino Y, Nishimura S, <strong>and</strong> Beier H. 1986. Dramatic events in ciliate <strong>evolution</strong> - alteration<br />
<strong>of</strong> UAA <strong>and</strong> UAG termination codons to glutamine codons due to anticodon mutations in two<br />
Tetrahymena tRNAs-Gln. EMBO Journal 5:1307-1311.<br />
Hanyuda T, Arai S, <strong>and</strong> Ueda K. 2000. Variability in the rbcL introns <strong>of</strong> Caulerpalean <strong>algae</strong><br />
(Chlorophyta, Ulvophyceae). Journal <strong>of</strong> Plant Research 113:403-413.
148 REFERENCES<br />
Hanyuda T, Wakana I, Arai S, Miyaji K, Watano Y, <strong>and</strong> Ueda K. 2002. Phylogenetic relationships within<br />
Cladophorales (Ulvophyceae, Chlorophyta) inferred from 18S rRNA gene sequences, with<br />
special reference to Aegagropila linnaei. Journal <strong>of</strong> <strong>Phycology</strong> 38:564-571.<br />
Hashimoto T, Nakamura Y, Nakamura F, Shirakura T, Adachi J, Goto N, Okamoto K, <strong>and</strong> Hasegawa M.<br />
1994. Protein phylogeny gives a robust estimation for early divergences <strong>of</strong> eukaryotes:<br />
phylogenetic place <strong>of</strong> a mitochondria-lacking protozoan, Giardia lamblia. Molecular Biology<br />
<strong>and</strong> Evolution 11:65-71.<br />
Hedges SB, Blair JE, Venturi ML, <strong>and</strong> Shoe JL. 2004. A <strong>molecular</strong> timescale <strong>of</strong> eukaryote <strong>evolution</strong> <strong>and</strong><br />
the rise <strong>of</strong> complex multicellular life. BMC Evolutionary Biology 4.<br />
Herron MD, Hackett JD, Aylward FO, <strong>and</strong> Michod RE. 2009. Triassic origin <strong>and</strong> early radiation <strong>of</strong><br />
multicellular volvocine <strong>algae</strong>. Proceedings <strong>of</strong> the National Academy <strong>of</strong> Sciences <strong>of</strong> the United<br />
States <strong>of</strong> America 106:3254-3258.<br />
Hershberg R <strong>and</strong> Petrov DA. 2008. Selection on codon bias. Annual Review <strong>of</strong> Genetics 42:287-299.<br />
Higgs PG <strong>and</strong> Ran WQ. 2008. Co<strong>evolution</strong> <strong>of</strong> codon usage <strong>and</strong> tRNA genes leads to alternative stable<br />
states <strong>of</strong> biased codon usage. Molecular Biology <strong>and</strong> Evolution 25:2279-2291.<br />
Holder M <strong>and</strong> Lewis PO. 2003. <strong>Phylogeny</strong> estimation: Traditional <strong>and</strong> Bayesian approaches. Nature<br />
Reviews Genetics 4:275-284.<br />
Hori T. 1994. An illustrated atlas <strong>of</strong> the life history <strong>of</strong> <strong>algae</strong>. Volume 1. Green Algae. Uchida Rokakuho<br />
Publishing Co., Ltd., Tokyo.<br />
Horowitz S <strong>and</strong> Gorovsky MA. 1985. An An unusual genetic code in nuclear genes <strong>of</strong> Tetrahymena.<br />
Proceedings <strong>of</strong> the National Academy <strong>of</strong> Sciences <strong>of</strong> the United States <strong>of</strong> America 82:2452-<br />
2455.<br />
Inagaki Y, Blouin C, Doolittle WF, <strong>and</strong> Roger AJ. 2002. Convergence <strong>and</strong> constraint in eukaryotic<br />
release factor 1 (eRF1) domain 1: the <strong>evolution</strong> <strong>of</strong> stop codon specificity. Nucleic Acids<br />
Research 30:532-544.<br />
Index Nominum Algarum UH, University <strong>of</strong> California, Berkeley. Compiled by Paul Silva. Available<br />
online at http://ucjeps.berkeley.edu/INA.html.<br />
Ingvarsson PK. 2008. Molecular <strong>evolution</strong> <strong>of</strong> synonymous codon usage in Populus. BMC Evolutionary<br />
Biology 8:307.<br />
Irvine D <strong>and</strong> John D. 1984. The Systematics <strong>of</strong> Green Algae. Academic Press, London.<br />
James TY, Kauff F, Schoch CL, Matheny PB, H<strong>of</strong>stetter V, Cox CJ, Celio G, Gueidan C, Fraker E,<br />
Miadlikowska J, Lumbsch HT, Rauhut A, Reeb V, Arnold AE, Amt<strong>of</strong>t A, Stajich JE, Hosaka K,<br />
Sung GH, Johnson D, O'Rourke B, Crockett M, Binder M, Curtis JM, Slot JC, Wang Z, Wilson<br />
AW, Schussler A, Longcore JE, O'Donnell K, Mozley-St<strong>and</strong>ridge S, Porter D, Letcher PM,<br />
Powell MJ, Taylor JW, White MM, Griffith GW, Davies DR, Humber RA, Morton JB, Sugiyama<br />
J, Rossman AY, Rogers JD, Pfister DH, Hewitt D, Hansen K, Hambleton S, Shoemaker RA,<br />
Kohlmeyer J, Volkmann-Kohlmeyer B, Spotts RA, Serdani M, Crous PW, Hughes KW,<br />
Matsuura K, Langer E, Langer G, Untereiner WA, Lucking R, Budel B, Geiser DM, Aptroot A,<br />
Diederich P, Schmitt I, Schultz M, Yahr R, Hibbett DS, Lutzoni F, McLaughlin DJ, Spatafora JW,<br />
<strong>and</strong> Vilgalys R. 2006. Reconstructing the early <strong>evolution</strong> <strong>of</strong> Fungi using a six-gene phylogeny.<br />
Nature 443:818-822.<br />
Jansen RK, Cai Z, Raubeson LA, Daniell H, Depamphilis CW, Leebens-Mack J, Muller KF, Guisinger-<br />
Bellian M, Haberle RC, Hansen AK, Chumley TW, Lee SB, Peery R, McNeal JR, Kuehl JV, <strong>and</strong><br />
Boore JL. 2007. Analysis <strong>of</strong> 81 genes from 64 plastid genomes resolves relationships in
REFERENCES 149<br />
angiosperms <strong>and</strong> identifies genome-scale <strong>evolution</strong>ary patterns. Proceedings <strong>of</strong> the National<br />
Academy <strong>of</strong> Sciences <strong>of</strong> the United States <strong>of</strong> America 104:19369-19374.<br />
Jobb G, von Haeseler A, <strong>and</strong> Strimmer K. 2004. TREEFINDER: a powerful graphical analysis<br />
environment for <strong>molecular</strong> phylogenetics. BMC Evolutionary Biology 4.<br />
Jobb G. 2008. TREEFINDER version <strong>of</strong> March 2008. www.treefinder.de<br />
Jónsson S. 1962. Recherches sur des Cladophoracées marines: structure, reproduction, cycles<br />
comparés, conséquences systématiques. Annales des Sciences Naturelles, Botanique 12:25-<br />
263.<br />
Jónsson S. 1999. The status <strong>of</strong> the Acrosiphoniales (Chlorophyta). Rit Fiskideildar 16:187–196.<br />
Jorde I. 1933. Untersuchungen über den Lebenszyklus von Urospora Aresch. und Codiolum A. Braun.<br />
Nyt Magazin for Naturvidensk 73:1-19.<br />
Jukes TH <strong>and</strong> Osawa S. 1993. Evolutionary changes in the genetic code. Comparative Biochemistry<br />
<strong>and</strong> Physiology - Part B: Biochemistry & Molecular Biology 106:489-494.<br />
Kamikawa R, Inagaki Y, <strong>and</strong> Sako Y. 2008. Direct phylogenetic evidence for lateral transfer <strong>of</strong><br />
elongation factor-like gene. Proceedings <strong>of</strong> the National Academy <strong>of</strong> Sciences <strong>of</strong> the United<br />
States <strong>of</strong> America 105:6965-6969.<br />
Kapraun DF <strong>and</strong> Nguyen MN. 1994. Karyology, nuclear DNA quantification <strong>and</strong> nucleus-cytoplasmic<br />
domain variations in some multinucleate <strong>green</strong> <strong>algae</strong> (Siphonocladales, Chlorophyta).<br />
Phycologia 33:42-52.<br />
Karol KG, McCourt RM, Cimino MT, <strong>and</strong> Delwiche CF. 2001. The closest living relatives <strong>of</strong> l<strong>and</strong> plants.<br />
Science 294:2351-2353.<br />
Karsten U, Friedl T, Schumann R, Hoyer K, <strong>and</strong> Lembcke S. 2005. Mycosporine-like amino acids <strong>and</strong><br />
phylogenies in <strong>green</strong> <strong>algae</strong>: Prasiola <strong>and</strong> its relatives from the Trebouxiophyceae<br />
(Chlorophyta). Journal <strong>of</strong> <strong>Phycology</strong> 41:557-566.<br />
Kass RE <strong>and</strong> Raftery AE. 1995. Bayes Factors. Journal <strong>of</strong> the American Statistical Association 90:773-<br />
795.<br />
Kawahara Y <strong>and</strong> Imanishi T. 2007. A genome-wide survey <strong>of</strong> changes in protein <strong>evolution</strong>ary rates<br />
across four closely related species <strong>of</strong> Saccharomyces sensu stricto group. BMC Evolutionary<br />
Biology 7:9.<br />
Keeling PJ <strong>and</strong> Doolittle WF. 1996. A non-canonical genetic code in an early diverging eukaryotic<br />
lineage. EMBO Journal 15:2285-2290.<br />
Keeling PJ <strong>and</strong> Le<strong>and</strong>er BS. 2003. Characterisation <strong>of</strong> a non-canonical genetic code in the oxymonad<br />
Streblomastix strix. Journal <strong>of</strong> Molecular Biology 326:1337-1349.<br />
Keeling PJ <strong>and</strong> Inagaki Y. 2004. A class <strong>of</strong> eukaryotic GTPase with a punctate distribution suggesting<br />
multiple functional replacements <strong>of</strong> translation elongation factor 1α. Proceedings <strong>of</strong> the<br />
National Academy <strong>of</strong> Sciences <strong>of</strong> the United States <strong>of</strong> America 101:15380-15385.<br />
Keeling PJ <strong>and</strong> Palmer JD. 2008. Horizontal gene transfer in eukaryotic <strong>evolution</strong>. Nature Reviews<br />
Genetics 9:605-618.<br />
Kim GH, Klotchkova TA, <strong>and</strong> Kang YM. 2001. Life without a cell membrane: regeneration <strong>of</strong><br />
protoplasts from disintegrated cells <strong>of</strong> the marine <strong>green</strong> alga Bryopsis plumosa. Journal <strong>of</strong><br />
Cell Science 114:2009-2014.<br />
Knight R, Freel<strong>and</strong> S, <strong>and</strong> L<strong>and</strong>weber L. 2001a. A simple model based on mutation <strong>and</strong> selection<br />
explains trends in codon <strong>and</strong> amino-acid usage <strong>and</strong> GC composition within <strong>and</strong> across<br />
genomes. Genome Biology 2:1-13.
150 REFERENCES<br />
Knight RD, Freel<strong>and</strong> SJ, <strong>and</strong> L<strong>and</strong>weber LF. 2001b. Rewiring the keyboard evolvability <strong>of</strong> the genetic<br />
code. Nature Reviews Genetics 2:49-58.<br />
Kolisko M, Cepicka I, Hampl V, Leigh J, Roger AJ, Kulda J, Simpson AGB, <strong>and</strong> Flegr J. 2008. Molecular<br />
phylogeny <strong>of</strong> diplomonads <strong>and</strong> enteromonads based on SSU rRNA, alpha-tubulin <strong>and</strong> HSP90<br />
genes: Implications for the <strong>evolution</strong>ary history <strong>of</strong> the double karyomastigont <strong>of</strong><br />
diplomonads. BMC Evolutionary Biology 8:205.<br />
Kornmann P. 1963. Die Ulotrichales, neu geordnet auf der Grundlage entwicklungsgeschichtlicher<br />
Befunde. Phycologia 3:60-68.<br />
Kornmann P <strong>and</strong> Sahling P-H. 1994. Meeresalgen von Helgol<strong>and</strong>: Zweite Ergänzung. Helgoländer<br />
Meeresuntersuchungen 48:365-406.<br />
Kraft GT. 2007. Algae <strong>of</strong> Australia: marine benthic <strong>algae</strong> <strong>of</strong> Lord Howe Isl<strong>and</strong> <strong>and</strong> the Southern Great<br />
Barrier Reef, 1: Green Algae. Australian Biological Resources Study & CSIRO Publishing,<br />
Canberra & Melbourne.<br />
Krienitz L, Ustinova I, Friedl T, <strong>and</strong> Huss VAR. 2001. Traditional generic concepts versus 18S rRNA<br />
gene phylogeny in the <strong>green</strong> algal family Selenastraceae (Chlorophyceae, Chlorophyta).<br />
Journal <strong>of</strong> <strong>Phycology</strong> 37:852-865.<br />
Krienitz L, Hegewald E, Hepperle D, <strong>and</strong> Wolf M. 2003. The systematics <strong>of</strong> coccoid <strong>green</strong> <strong>algae</strong>: 18S<br />
rRNA gene sequence data versus morphology. Biologia 58:437-446.<br />
Lagerheim G. 1887. Note sur l'Uronema, nouveau genre des algues d'eau douce. Malpigia 1:517-523.<br />
Lake JA. 2008. Reconstructing <strong>evolution</strong>ary graphs: 3D parsimony. Molecular Biology <strong>and</strong> Evolution<br />
25:1677-1682.<br />
Lane CE <strong>and</strong> Archibald JM. 2008. The eukaryotic tree <strong>of</strong> life: endosymbiosis takes its TOL. Trends in<br />
Ecology & Evolution 23:268-275.<br />
Lartillot N, Blanquart S, <strong>and</strong> Lepage T. 2007. PhyloBayes v2.3.<br />
http://www.lirmm.fr/mab/article.php3?id_article=329<br />
Lein TE, Bruntse G, Gunnarsson K, <strong>and</strong> Nielsen R. 1999. New records <strong>of</strong> benthic marine <strong>algae</strong> for<br />
Norway, with notes on some rare species from the Florø district, western Norway. Sarsia<br />
84:39-53.<br />
Leliaert F, Rousseau F, De Reviers B, <strong>and</strong> Coppejans E. 2003. <strong>Phylogeny</strong> <strong>of</strong> the Cladophorophyceae<br />
(Chlorophyta) inferred from partial LSU rRNA gene sequences: is the recognition <strong>of</strong> a<br />
separate order Siphonocladales justified? European Journal <strong>of</strong> <strong>Phycology</strong> 38:233-246.<br />
Leliaert F <strong>and</strong> Boedeker C. 2007. Cladophorales. Pp. 131–183 in J. Brodie, C. A. Maggs, <strong>and</strong> D. M.<br />
John, eds. Green seaweeds <strong>of</strong> Britain <strong>and</strong> Irel<strong>and</strong>. British Phycological Society, London, UK.<br />
Leliaert F, De Clerck O, Verbruggen H, Boedeker C, <strong>and</strong> Coppejans E. 2007. Molecular phylogeny <strong>of</strong><br />
the Siphonocladales (Chlorophyta : Cladophorophyceae). Molecular Phylogenetics <strong>and</strong><br />
Evolution 44:1237-1256.<br />
Leliaert F, Boedeker C, Pena V, Bunker F, Verbruggen H, <strong>and</strong> De Clerck O. 2009. Cladophora<br />
rhodolithicola sp. nov. (Cladophorales, Chlorophyta), a diminutive species from European<br />
maerl beds. European Journal <strong>of</strong> <strong>Phycology</strong> 43: in press.<br />
Lemieux C, Otis C, <strong>and</strong> Turmel M. 2000. Ancestral chloroplast genome in Mesostigma viride reveals<br />
an early branch <strong>of</strong> <strong>green</strong> plant <strong>evolution</strong>. Nature 403:649-652.<br />
Lemieux C, Otis C, <strong>and</strong> Turmel M. 2007. A clade uniting the <strong>green</strong> <strong>algae</strong> Mesostigma viride <strong>and</strong><br />
Chlorokybus atmophyticus represents the deepest branch <strong>of</strong> the Streptophyta in chloroplast<br />
genome-based phylogenies. BMC Biology 5:2.
REFERENCES 151<br />
Levring T. 1937. Zur Kenntnis der Algenflora der Norwegischen Westküste. Lunds Univ. Årsskr. 33:1-<br />
147.<br />
Lewis LA <strong>and</strong> McCourt RM. 2004. Green <strong>algae</strong> <strong>and</strong> the origin <strong>of</strong> l<strong>and</strong> plants. American Journal <strong>of</strong><br />
Botany 91:1535-1556.<br />
Lewis LA <strong>and</strong> Lewis PO. 2005. Unearthing the <strong>molecular</strong> phylodiversity <strong>of</strong> desert soil <strong>green</strong> <strong>algae</strong><br />
(Chlorophyta). Systematic Biology 54:936–947.<br />
Li CH, Lu GQ, <strong>and</strong> Orti G. 2008. Optimal data partitioning <strong>and</strong> a test case for ray-finned fishes<br />
(Actinopterygii) based on ten nuclear loci. Systematic Biology 57:519-539.<br />
Lindstrom SC <strong>and</strong> Hanic LA. 2005. The phylogeny <strong>of</strong> North American Urospora (Ulotrichales,<br />
Chlorophyta) based on sequence analysis <strong>of</strong> nuclear ribosomal genes, introns <strong>and</strong> spacers.<br />
Phycologia 44:194-201.<br />
Littler DS, Littler MM, <strong>and</strong> Hanisak MD. 2008. Submersed plants <strong>of</strong> the Indian River Lagoon: A floristic<br />
inventory <strong>and</strong> field guide. OffShore Graphics, Inc., Washington, DC.<br />
Littler MM, Littler DS, <strong>and</strong> Lapointe BE. 1988. A comparison <strong>of</strong> nutrient-limited <strong>and</strong> light-limited<br />
photosynthesis in psammophytic versus epilithic forms <strong>of</strong> Halimeda (Caulerpales,<br />
Halimedaceae) from the Bahamas. Coral Reefs 6:219-225.<br />
Lobanov AV, Fomenko DE, Zhang Y, Sengupta A, Hatfield DL, <strong>and</strong> Gladyshev VN. 2007. Evolutionary<br />
dynamics <strong>of</strong> eukaryotic selenoproteomes: large selenoproteomes may associate with aquatic<br />
life <strong>and</strong> small with terrestrial life. Genome Biology 8:R198.<br />
Lokhorst GM <strong>and</strong> Trask BJ. 1981. Taxonomic studies on Urospora (Acrosiphoniales, Chlorophyceae) in<br />
western Europe. Acta Botanica Neerl<strong>and</strong>ica 30:353-431.<br />
Lopez-Bautista JM <strong>and</strong> Chapman RL. 2003. Phylogenetic affinities <strong>of</strong> the Trentepohliales inferred<br />
from small-subunit rDNA. International Journal <strong>of</strong> Systematic <strong>and</strong> Evolutionary Microbiology<br />
53:2099-2106.<br />
Lopez-Bautista JM, Rindi F, <strong>and</strong> Casamatta D. 2007. The subaerial <strong>algae</strong>. Pp. 601-617 in J. Seckbach,<br />
ed. Algae <strong>and</strong> Cyanobacteria in Extreme Environments. Springer.<br />
Lozupone CA, Knight RD, <strong>and</strong> L<strong>and</strong>weber LF. 2001. The <strong>molecular</strong> basis <strong>of</strong> nuclear genetic code<br />
change in ciliates. Current Biology 11:65-74.<br />
Maggs CA <strong>and</strong> O' Kelly CJ. 2007. Uronema. Pp. 209-210 in J. Brodie, C. A. Maggs, <strong>and</strong> D. M. John, eds.<br />
Green seaweeds <strong>of</strong> Britain <strong>and</strong> Irel<strong>and</strong>. British Phycological Society, London, UK.<br />
Mann DG. 1996. Crossing the Rubicon: the effectiveness <strong>of</strong> the marine/freshwater interface as a<br />
barrier to the migration <strong>of</strong> diatom germplasm. Pp. 1-21 in S. Mayama, M. Idei, <strong>and</strong> I. Koizumi,<br />
eds. Fourtheenth International Diatom Symposium. Koeltz Scientific Books, Tokyo, Japan.<br />
Maquat LE. 2004. Nonsense-mediated mRNA decay: Splicing, translation <strong>and</strong> mRNP dynamics. Nature<br />
Reviews Molecular Cell Biology 5:89-99.<br />
Marin B <strong>and</strong> Melkonian M. 1999. Mesostigmatophyceae, a new class <strong>of</strong> streptophyte <strong>green</strong> <strong>algae</strong><br />
revealed by SSU rRNA sequence comparisons. Protist 150:399-417.<br />
Martins EP. 1999. Estimation <strong>of</strong> ancestral states <strong>of</strong> continuous characters: A computer simulation<br />
study. Systematic Biology 48:642-650.<br />
Matsuyama K, Matsuoka T, Miyaji K, Tanaka J, <strong>and</strong> Aruga Y. 1998. Ultrastructure <strong>of</strong> the pyrenoid in<br />
the family Cladophoraceae (Cladophorales, Chlorophyta). Journal <strong>of</strong> Japanese Botany 73:279-<br />
286.
152 REFERENCES<br />
Mattox K <strong>and</strong> Stewart K. 1984. Classification <strong>of</strong> the <strong>green</strong> <strong>algae</strong>: a concept based on comparative<br />
cytology. Pp. 29–72 in D. Irvine, <strong>and</strong> D. John, eds. Systematics <strong>of</strong> the <strong>green</strong> <strong>algae</strong>. The<br />
Systematics Association Special Volume 27, Academic Press, London <strong>and</strong> Orl<strong>and</strong>o.<br />
McCourt RM, Delwiche CF, <strong>and</strong> Karol KG. 2004. Charophyte <strong>algae</strong> <strong>and</strong> l<strong>and</strong> plant origins. Trends in<br />
Ecology & Evolution 19:661-666.<br />
Melkonian M. 1989. Flagellar Apparatus Ultrastructure in Mesostigma viride (Prasinophyceae). Plant<br />
Systematics <strong>and</strong> Evolution 164:93-122.<br />
Menzel D. 1988. How do giant plant cells cope with injury? - The wound response in siphonous <strong>green</strong><br />
<strong>algae</strong>. Protoplasma 144:73-91.<br />
Meyer KI. 1927. Algae <strong>of</strong> the northern end <strong>of</strong> lake Baikal. Archives Russes de Protisologie 6:93-118 [In<br />
Russian, with French summary].<br />
Mishler BD, Lewis LA, Buchheim MA, Renzaglia KS, Garbary DJ, Delwiche CF, Zechman FW, Kantz TS,<br />
<strong>and</strong> Chapman RL. 1994. Phylogenetic relationships <strong>of</strong> the "<strong>green</strong> <strong>algae</strong>" <strong>and</strong> "bryophytes".<br />
Annals <strong>of</strong> the Missouri Botanical Garden 81:451-483.<br />
Miyaji K. 1999. A new type <strong>of</strong> pyrenoid in the genus Rhizoclonium (Cladophorales, Chlorophyta).<br />
Phycologia 38:267-276.<br />
Moestrup Ø. 1978. Phylogenetic validity <strong>of</strong> flagellar apparatus in <strong>green</strong> <strong>algae</strong> <strong>and</strong> other chlorophyll a<br />
<strong>and</strong> b containing plants. Biosystems 10:117-144.<br />
Moore MJ, Bell CD, Soltis PS, <strong>and</strong> Soltis DE. 2007. Using plastid genome-scale data to resolve<br />
enigmatic relationships among basal angiosperms. Proceedings <strong>of</strong> the National Academy <strong>of</strong><br />
Sciences <strong>of</strong> the United States <strong>of</strong> America 104:19363-19368.<br />
Muller J, Oma Y, Vallar L, Friederich E, Poch O, <strong>and</strong> Winsor B. 2005. Sequence <strong>and</strong> comparative<br />
genomic analysis <strong>of</strong> actin-related proteins. Molecular Biology <strong>of</strong> the Cell 16:5736-5748.<br />
Negrutskii BS <strong>and</strong> El'skaya AV. 1998. Eukaryotic translation elongation factor 1α : Structure,<br />
expression, functions, <strong>and</strong> possible role in aminoacyl-tRNA channeling. Pp. 47-78. Progress in<br />
Nucleic Acid Research <strong>and</strong> Molecular Biology, Volume 60.<br />
Nei M <strong>and</strong> Rooney AP. 2005. Concerted <strong>and</strong> birth-<strong>and</strong>-death <strong>evolution</strong> <strong>of</strong> multigene families. Annual<br />
Review <strong>of</strong> Genetics 39:121-152.<br />
Nielsen R <strong>and</strong> Gunnarsson K. 2001. Seaweeds <strong>of</strong> the Faroe Isl<strong>and</strong>s. An annotated checklist.<br />
Fródskaparrit 49:45-108.<br />
Noble GP, Rogers MB, <strong>and</strong> Keeling PJ. 2007. Complex distribution <strong>of</strong> EFL <strong>and</strong> EF-1α proteins in the<br />
<strong>green</strong> algal lineage. BMC Evolutionary Biology 7:82.<br />
Nosenko T, Lidie KL, Van Dolah FM, Lindquist E, Cheng JF, <strong>and</strong> Bhattacharya D. 2006. Chimeric plastid<br />
proteome in the florida "red tide" din<strong>of</strong>lagellate Karenia brevis. Molecular Biology <strong>and</strong><br />
Evolution 23:2026-2038.<br />
Nozaki H, Matsuzaki M, Takahara M, Misumi O, Kuroiwa H, Hasegawa M, Shin-i T, Kohara Y,<br />
Ogasawara N, <strong>and</strong> Kuroiwa T. 2003a. The phylogenetic position <strong>of</strong> red <strong>algae</strong> revealed by<br />
multiple nuclear genes from mitochondria-containing eukaryotes <strong>and</strong> an alternative<br />
hypothesis on the origin <strong>of</strong> plastids. Journal <strong>of</strong> Molecular Evolution 56:485-497.<br />
Nozaki H, Ohta N, Matsuzaki M, Misumi O, <strong>and</strong> Kuroiwa T. 2003b. <strong>Phylogeny</strong> <strong>of</strong> plastids based on<br />
cladistic analysis <strong>of</strong> gene loss inferred from complete plastid genome sequences. Journal <strong>of</strong><br />
Molecular Evolution 57:377-382.<br />
Nyl<strong>and</strong>er JAA, Ronquist F, Huelsenbeck JP, <strong>and</strong> Nieves-Aldrey JL. 2004. Bayesian phylogenetic analysis<br />
<strong>of</strong> combined data. Systematic Biology 53:47-67.
REFERENCES 153<br />
O'Kelly CJ <strong>and</strong> Floyd GL. 1984a. Flagellar apparatus absolute orientations <strong>and</strong> the phylogeny <strong>of</strong> the<br />
<strong>green</strong> <strong>algae</strong>. Biosystems 16:227-251.<br />
O'Kelly CJ <strong>and</strong> Floyd GL. 1984b. Correlations among patterns <strong>of</strong> sporangial structure <strong>and</strong><br />
development, life histories, <strong>and</strong> ultrastructural features in the Ulvophyceae. Pp. 121-156 in<br />
D. Irvine, <strong>and</strong> D. John, eds. Systematics <strong>of</strong> the <strong>green</strong> <strong>algae</strong>. The Systematics Association<br />
Special Volume 27, Academic Press, London <strong>and</strong> Orl<strong>and</strong>o.<br />
O'Kelly CJ, Wysor B, <strong>and</strong> Bellows WK. 2004. Gene sequence diversity <strong>and</strong> the phylogenetic position <strong>of</strong><br />
<strong>algae</strong> assigned to the genera Phaeophila <strong>and</strong> Ochlochaete (Ulvophyceae, Chlorophyta).<br />
Journal <strong>of</strong> <strong>Phycology</strong> 40:789-799.<br />
O'Kelly CJ. 2007. The origin <strong>and</strong> early <strong>evolution</strong> <strong>of</strong> <strong>green</strong> plants. Pp. 287-309 in P. G. Falkowski, <strong>and</strong> A.<br />
H. Knoll, eds. Evolution <strong>of</strong> primary producers in the sea. Elsevier Academic Press, Amsterdam,<br />
The Netherl<strong>and</strong>s.<br />
O'Neil RM <strong>and</strong> La Claire JW. 1984. Mechanical wounding induces the formation <strong>of</strong> extensive coated<br />
membranes in giant algal cells. Science 225:331-333.<br />
Pagel M. 1994. Detecting correlated <strong>evolution</strong> on phylogenies: a general method for the comparative<br />
analysis <strong>of</strong> discrete characters. Proceedings <strong>of</strong> the Royal Society <strong>of</strong> London Series B-Biological<br />
Sciences 255:37-45.<br />
Pagel M. 1999. The maximum likelihood approach to reconstructing ancestral character states <strong>of</strong><br />
discrete characters on phylogenies. Systematic Biology 48:612-622.<br />
Pagel M <strong>and</strong> Meade A. 2004. A phylogenetic mixture model for detecting pattern-heterogeneity in<br />
gene sequence or character-state data. Systematic Biology 53:571-581.<br />
Pagel M <strong>and</strong> Meade A. 2006. Bayesian analysis <strong>of</strong> correlated <strong>evolution</strong> <strong>of</strong> discrete characters by<br />
reversible-jump Markov chain Monte Carlo. American Naturalist 167:808-825.<br />
Palmer JD. 2003. The symbiotic birth <strong>and</strong> spread <strong>of</strong> plastids: How many times <strong>and</strong> whodunit? Journal<br />
<strong>of</strong> <strong>Phycology</strong> 39:4-11.<br />
Paradis E, Claude J, <strong>and</strong> Strimmer K. 2004. APE: Analyses <strong>of</strong> Phylogenetics <strong>and</strong> Evolution in R<br />
language. Bioinformatics 20:289-290.<br />
Parker B. 1970. Significance <strong>of</strong> cell wall chemistry to phylogeny in the <strong>green</strong> <strong>algae</strong>. Annals <strong>of</strong> the New<br />
York Academy <strong>of</strong> Sciences 175:417-428.<br />
Parkinson CL, Adams KL, <strong>and</strong> Palmer JD. 1999. Multigene analyses identify the three earliest lineages<br />
<strong>of</strong> extant flowering plants. Current Biology 9:1485-1488.<br />
Petersen J, Teich R, Becker B, Cerff R, <strong>and</strong> Brinkmann H. 2006. The GapA/B gene duplication marks<br />
the origin <strong>of</strong> streptophyta (Charophytes <strong>and</strong> l<strong>and</strong> plants). Molecular Biology <strong>and</strong> Evolution<br />
23:1109-1118.<br />
Philip GK, Creevey CJ, <strong>and</strong> McInerney JO. 2005. The Opisthokonta <strong>and</strong> the Ecdysozoa may not be<br />
clades: stronger support for the grouping <strong>of</strong> plant <strong>and</strong> animal than for animal <strong>and</strong> fungi <strong>and</strong><br />
stronger support for the Coelomata than Ecdysozoa. Molecular Biology <strong>and</strong> Evolution<br />
22:1175-1184.<br />
Philippe H, Snell EA, Bapteste E, Lopez P, Holl<strong>and</strong> PWH, <strong>and</strong> Casane D. 2004. Phylogenomics <strong>of</strong><br />
eukaryotes: Impact <strong>of</strong> missing data on large alignments. Molecular Biology <strong>and</strong> Evolution<br />
21:1740-1752.<br />
Philippe H, Delsuc F, Brinkmann H, <strong>and</strong> Lartillot N. 2005a. Phylogenomics. Annual Review <strong>of</strong> Ecology<br />
Evolution <strong>and</strong> Systematics 36:541-562.
154 REFERENCES<br />
Philippe H, Lartillot N, <strong>and</strong> Brinkmann H. 2005b. Multigene analyses <strong>of</strong> bilaterian animals corroborate<br />
the monophyly <strong>of</strong> Ecdysozoa, Lophotrochozoa, <strong>and</strong> Protostomia. Molecular Biology <strong>and</strong><br />
Evolution 22:1246-1253.<br />
Pickett-Heaps JD <strong>and</strong> Marchant HJ. 1972. The phylogeny <strong>of</strong> the <strong>green</strong> <strong>algae</strong>: a new proposal. Cytobios<br />
6:255-264.<br />
Pombert JF, Otis C, Lemieux C, <strong>and</strong> Turmel M. 2004. The complete mitochondrial DNA sequence <strong>of</strong><br />
the <strong>green</strong> alga Pseudendoclonium akinetum (Ulvophyceae) highlights distinctive <strong>evolution</strong>ary<br />
trends in the Chlorophyta <strong>and</strong> suggests a sister-group relationship between the Ulvophyceae<br />
<strong>and</strong> Chlorophyceae. Molecular Biology <strong>and</strong> Evolution 21:922-935.<br />
Pombert JF, Otis C, Lemieux C, <strong>and</strong> Turmel M. 2005. Chloroplast genome sequence <strong>of</strong> the <strong>green</strong> alga<br />
Pseudendoclonium akinetum (Ulvophyceae) reveals unusual structural features <strong>and</strong> new<br />
insights into the branching order <strong>of</strong> chlorophyte lineages. Molecular Biology <strong>and</strong> Evolution<br />
22:1903-1918.<br />
Pombert JF, Lemieux C, <strong>and</strong> Turmel M. 2006. The complete chloroplast DNA sequence <strong>of</strong> the <strong>green</strong><br />
alga Oltmannsiellopsis viridis reveals a distinctive quadripartite architecture in the<br />
chloroplast genome <strong>of</strong> early diverging ulvophytes. BMC Biology 4.<br />
Pond SLK, Frost SDW, <strong>and</strong> Muse SV. 2005. HyPhy: Hypothesis testing using Phylogenies.<br />
Bioinformatics 21:676-679.<br />
Posada D <strong>and</strong> Cr<strong>and</strong>all KA. 1998. MODELTEST: testing the model <strong>of</strong> DNA substitution. Bioinformatics<br />
14: 817-818.<br />
Powell JR <strong>and</strong> Moriyama EN. 1997. Evolution <strong>of</strong> codon usage bias in Drosophila. Proceedings <strong>of</strong> the<br />
National Academy <strong>of</strong> Sciences <strong>of</strong> the United States <strong>of</strong> America 94:7784-7790.<br />
Printz H. 1926. Die Algenvegetation des Trondjemsfjordes. Skr. Norske Vidensk.-Akad. Oslo, Mat.naturv.<br />
Kl. 1926 5:1- 273.<br />
Printz H. 1932. Observations on the structure <strong>and</strong> reproduction in Urospora. Aresch. Nyt. Mag.<br />
Naturvidensk. 70:274-287.<br />
Pröschold T <strong>and</strong> Leliaert F. 2007. Systematics <strong>of</strong> the <strong>green</strong> <strong>algae</strong>: conflict <strong>of</strong> classic <strong>and</strong> modern<br />
approaches. Pp. 123-153 in B. J., <strong>and</strong> L. J.M., eds. Unravelling the <strong>algae</strong>: the past, present,<br />
<strong>and</strong> future <strong>of</strong> algal systematics. The Systematics Association Special Volume Series, 75. CRC<br />
Press, Boca Raton, FL, USA.<br />
Qiu YL, Li LB, Wang B, Chen ZD, Knoop V, Groth-Malonek M, Dombrovska O, Lee J, Kent L, Rest J,<br />
Estabrook GF, Hendry TA, Taylor DW, Testa CM, Ambros M, Cr<strong>and</strong>all-Stotler B, Duff RJ, Stech<br />
M, Frey W, Qu<strong>and</strong>t D, <strong>and</strong> Davis CC. 2006. The deepest divergences in l<strong>and</strong> plants inferred<br />
from phylogenomic evidence. Proceedings <strong>of</strong> the National Academy <strong>of</strong> Sciences <strong>of</strong> the United<br />
States <strong>of</strong> America 103:15511-15516.<br />
Rambaut A <strong>and</strong> Drummond A. 2007. Tracer: MCMC Trace Analysis Tool.<br />
http://tree.bio.ed.ac.uk/s<strong>of</strong>tware/tracer/<br />
Reyes-Prieto A <strong>and</strong> Bhattacharya D. 2007. <strong>Phylogeny</strong> <strong>of</strong> nuclear-encoded plastid-targeted proteins<br />
supports an early divergence <strong>of</strong> glaucophytes within plantae. Molecular Biology <strong>and</strong><br />
Evolution 24:2358-2361.<br />
Reyes-Prieto A, Weber APM, <strong>and</strong> Bhattacharya D. 2007. The origin <strong>and</strong> establishment <strong>of</strong> the plastid in<br />
<strong>algae</strong> <strong>and</strong> plants. Annual Review <strong>of</strong> Genetics 41:147-168.<br />
Rindi F, Guiry MD, <strong>and</strong> Lopez-Bautista JM. 2006a. New records <strong>of</strong> Trentepohliales (Ulvophyceae,<br />
Chlorophyta) from Africa. Nova Hedwigia 83:431-449.
REFERENCES 155<br />
Rindi F, López-Bautista JM, Sherwood AR, <strong>and</strong> Guiry MD. 2006b. Morphology <strong>and</strong> phylogenetic<br />
position <strong>of</strong> Spongiochrysis hawaiiensis gen. et sp. nov., the first known terrestrial member <strong>of</strong><br />
the order Cladophorales (Ulvophyceae, Chlorophyta). International Journal <strong>of</strong> Systematic <strong>and</strong><br />
Evolutionary Microbiology 56:913-922.<br />
Robbens S, Petersen J, Brinkmann H, Rouze P, <strong>and</strong> Van de Peer Y. 2007. Unique regulation <strong>of</strong> the<br />
Calvin cycle in the ultrasmall <strong>green</strong> alga Ostreococcus. Journal <strong>of</strong> Molecular Evolution 64:601-<br />
604.<br />
Rodriguez-Ezpeleta N, Brinkmann H, Burey SC, Roure B, Burger G, Löffelhardt W, Bohnert HJ, Philippe<br />
H, <strong>and</strong> Lang BF. 2005. Monophyly <strong>of</strong> primary photosynthetic eukaryotes: <strong>green</strong> plants, red<br />
<strong>algae</strong>, <strong>and</strong> glaucophytes. Current Biology 15:1325-1330.<br />
Rodriguez-Ezpeleta N, Philippe H, Brinkmann H, Becker B, <strong>and</strong> Melkonian M. 2007. Phylogenetic<br />
analyses <strong>of</strong> nuclear, mitochondrial, <strong>and</strong> plastid multigene data sets support the placement <strong>of</strong><br />
Mesostigma in the Streptophyta. Molecular Biology <strong>and</strong> Evolution 24:723-731.<br />
Roger AJ, S<strong>and</strong>blom O, Doolittle WF, <strong>and</strong> Philippe H. 1999. An evaluation <strong>of</strong> elongation factor 1 alpha<br />
as a phylogenetic marker for eukaryotes. Molecular Biology <strong>and</strong> Evolution 16:218-233.<br />
Roger AJ <strong>and</strong> Hug LA. 2006. The origin <strong>and</strong> diversification <strong>of</strong> eukaryotes: problems with <strong>molecular</strong><br />
phylogenetics <strong>and</strong> <strong>molecular</strong> clock estimation. Philosophical Transactions <strong>of</strong> the Royal<br />
Society B-Biological Sciences 361:1039-1054.<br />
Rogers MB, Watkins RF, Harper JT, Durnford DG, Gray MW, <strong>and</strong> Keeling PJ. 2007. A complex <strong>and</strong><br />
punctate distribution <strong>of</strong> three eukaryotic genes derived by lateral gene transfer. BMC<br />
Evolutionary Biology 7:89.<br />
Rokas A <strong>and</strong> Abbot P. 2009. Harnessing genomics for <strong>evolution</strong>ary insights. Trends in Ecology &<br />
Evolution 24:192-200.<br />
Ronquist F <strong>and</strong> Huelsenbeck JP. 2003. MrBayes 3: Bayesian phylogenetic inference under mixed<br />
models. Bioinformatics 19:1572-1574.<br />
Rosenvinge LK. 1893. Grønl<strong>and</strong>s Havalger. Medd. Grønl<strong>and</strong> 3:763-981.<br />
Round FE. 1984. The systematics <strong>of</strong> the Chlorophyta: an historical review leading to some modern<br />
concepts. in I. D.E.G., <strong>and</strong> D. M. John, eds. The Systematics <strong>of</strong> Green Algae. The Systematics<br />
Association Special Volume 27, Academic Press, London <strong>and</strong> Orl<strong>and</strong>o.<br />
Rueness J. 1977. Norsk Algeflora. Universitetsforlaget, Olso.<br />
Rueness J. 1992. Field <strong>and</strong> culture observations on Uronema curvatum Printz (Chlorophyta). Acta<br />
Phytogeogr. Suec. 78:125-130.<br />
Saarela JM, Rai HS, Doyle JA, Endress PK, Mathews S, Marchant AD, Briggs BG, <strong>and</strong> Graham SW. 2007.<br />
Hydatellaceae identified as a new branch near the base <strong>of</strong> the angiosperm phylogenetic tree.<br />
Nature 446:312-315.<br />
Sakaguchi M, Suzaki T, Khan S, <strong>and</strong> Hausmann K. 2002. Food capture by kinetocysts in the heliozoon<br />
Raphidiophrys contractilis. European Journal <strong>of</strong> Protistology 37:453-458.<br />
Sakaguchi M, Takishita K, Matsumoto T, Hashimoto T, <strong>and</strong> Inagaki Y. 2008. Tracing back EFL gene<br />
<strong>evolution</strong> in the cryptomonads–haptophytes assemblage: Separate origins <strong>of</strong> EFL genes in<br />
haptophytes, photosynthetic cryptomonads, <strong>and</strong> goniomonads. Gene in press.<br />
Salim HMW <strong>and</strong> Cavalcanti ARO. 2008. Factors influencing codon usage bias in genomes. Journal <strong>of</strong><br />
the Brazilian Chemical Society 19:257-262.<br />
Sambrook J, Fritch EF, <strong>and</strong> Maniatis T. 1989. Molecular cloning: a laboratory manual. Cold Spring<br />
Harbor Laboratory Press, New York.
156 REFERENCES<br />
S<strong>and</strong>erson MJ. 2002. Estimating absolute rates <strong>of</strong> <strong>molecular</strong> <strong>evolution</strong> <strong>and</strong> divergence times: A<br />
penalized likelihood approach. Molecular Biology <strong>and</strong> Evolution 19:101-109.<br />
S<strong>and</strong>erson MJ. 2003. r8s: inferring absolute rates <strong>of</strong> <strong>molecular</strong> <strong>evolution</strong> <strong>and</strong> divergence times in the<br />
absence <strong>of</strong> a <strong>molecular</strong> clock. Bioinformatics 19:301-302.<br />
Santos MAS, Moura G, Massey SE, <strong>and</strong> Tuite MF. 2004. Driving change: the <strong>evolution</strong> <strong>of</strong> alternative<br />
genetic codes. Trends in Genetics 20:95-102.<br />
Scagel RF. 1966. Marine <strong>algae</strong> <strong>of</strong> British Columbia <strong>and</strong> northern Washington, Part I: Chlorophyceae<br />
(<strong>green</strong> <strong>algae</strong>). Bulletin National Museum <strong>of</strong> Canada 207:1-257.<br />
Schlösser UG. 1987. Action <strong>of</strong> cell wall autolysins in asexual reproduction <strong>of</strong> filamentous <strong>green</strong> <strong>algae</strong>:<br />
evidence <strong>and</strong> species specificity. Pp. 75–80 in W. Wiessner, D. G. Robinson, <strong>and</strong> S. R.C., eds.<br />
Algal Development: Molecular <strong>and</strong> Cellular Aspects. Springer, Berlin, Heidelberg, Germany.<br />
Schluter D, Price T, Mooers AO, <strong>and</strong> Ludwig D. 1997. Likelihood <strong>of</strong> ancestor states in adaptive<br />
radiation. Evolution 51:1699-1711.<br />
Schluter PM, Stuessy TF, <strong>and</strong> Paulus HF. 2005. Making the first step: practical considerations for the<br />
isolation <strong>of</strong> low-copy nuclear sequence markers. Taxon 54:766-770.<br />
Schneider CW <strong>and</strong> Searles RB. 1991. Seaweeds <strong>of</strong> the southeastern United States. Cape Hatteras to<br />
Cape Canaveral. Duke University Press, Durham & London.<br />
Schneider SU, Leible MB, <strong>and</strong> Yang XP. 1989. Strong homology between the small subunit <strong>of</strong> ribulose-<br />
1,5-bisphosphate carboxylase/oxygenase <strong>of</strong> two species <strong>of</strong> Acetabularia <strong>and</strong> the occurrence<br />
<strong>of</strong> unusual codon usage. Molecular & General Genetics 218:445-452.<br />
Schneider SU <strong>and</strong> de Groot EJ. 1991. Sequences <strong>of</strong> two rbcS cDNA clones <strong>of</strong> Batophora oerstedii:<br />
structural <strong>and</strong> <strong>evolution</strong>ary considerations. Current Genetics 20:173-175.<br />
Schöniger M <strong>and</strong> Von Haeseler A. 1994. A stochastic model for the <strong>evolution</strong> <strong>of</strong> autocorrelated DNA<br />
sequences. Molecular Phylogenetics <strong>and</strong> Evolution 3:240-247.<br />
Schultz DW <strong>and</strong> Yarus M. 1994. Transfer RNA mutation <strong>and</strong> the malleability <strong>of</strong> the genetic code.<br />
Journal <strong>of</strong> Molecular Biology 235:1377-1380.<br />
Sengupta S <strong>and</strong> Higgs PG. 2005. A unified model <strong>of</strong> codon reassignment in alternative genetic codes.<br />
Genetics 170:831-840.<br />
Seo TK <strong>and</strong> Kishino H. 2008. Synonymous substitutions substantially improve <strong>evolution</strong>ary inference<br />
from highly diverged proteins. Systematic Biology 57:367-377.<br />
Setchell WA <strong>and</strong> Gardner NL. 1920. The marine <strong>algae</strong> <strong>of</strong> the Pacific coast <strong>of</strong> North America. Part II.<br />
Chlorophyceae. University <strong>of</strong> California Publications in Botany 8:139-374.<br />
Shapiro B, Rambaut A, <strong>and</strong> Drummond AJ. 2006. Choosing appropriate substitution models for the<br />
phylogenetic analysis <strong>of</strong> protein-coding sequences. Molecular Biology <strong>and</strong> Evolution 23:7-9.<br />
Shimodaira H <strong>and</strong> Hasegawa M. 2001. CONSEL: for assessing the confidence <strong>of</strong> phylogenetic tree<br />
selection. Bioinformatics 17:1246-1247.<br />
Shimodaira H. 2002. An approximately unbiased test <strong>of</strong> phylogenetic tree selection. Systematic<br />
Biology 51:492-508.<br />
Sluiman HJ. 1989. The <strong>green</strong> algal class Ulvophyceae. An ultrastructural survey <strong>and</strong> classification.<br />
Cryptogamic botany 1:83-94.<br />
Small RL, Cronn RC, <strong>and</strong> Wendel JF. 2004. Use <strong>of</strong> nuclear genes for phylogeny reconstruction in<br />
plants. Australian Systematic Botany 17:145-170.
REFERENCES 157<br />
Sogin ML, Elwood HJ, <strong>and</strong> Gunderson JH. 1986. Evolutionary diversity <strong>of</strong> eukaryotic small subunit<br />
rRNA genes. Proceedings <strong>of</strong> the National Academy <strong>of</strong> Sciences <strong>of</strong> the United States <strong>of</strong><br />
America 83:1383-1387.<br />
Soltis PS <strong>and</strong> Soltis DE. 2003. Applying the bootstrap in phylogeny reconstruction. Statistical Science<br />
18:256-267.<br />
South GR <strong>and</strong> Tittley I. 1986. A checklist <strong>and</strong> distributional index <strong>of</strong> the benthic marine <strong>algae</strong> <strong>of</strong> the<br />
North Atlantic Ocean. British Museum (Natural History) <strong>and</strong> Huntsman Marine Laboratory,<br />
London <strong>and</strong> St. Andrews, New Brunswick, Canada.<br />
Steinkötter J, Bhattacharya D, Semmelroth I, Bibeau C, <strong>and</strong> Melkonian M. 1994. Prasinophytes form<br />
independent lineages within the Chlorophyta: evidence from ribosomal RNA sequence<br />
comparison. Journal <strong>of</strong> <strong>Phycology</strong> 30:340-345.<br />
Stiller JW, Riley J, <strong>and</strong> Hall BD. 2001. Are red <strong>algae</strong> plants? A critical evaluation <strong>of</strong> three key <strong>molecular</strong><br />
data sets. Journal <strong>of</strong> Molecular Evolution 52:527-539.<br />
Stiller JW <strong>and</strong> Harrell L. 2005. The largest subunit <strong>of</strong> RNA polymerase II from the Glaucocystophyta:<br />
functional constraint <strong>and</strong> short-branch exclusion in deep eukaryotic phylogeny. BMC<br />
Evolutionary Biology 5.<br />
Subramanian S. 2008. Nearly neutrality <strong>and</strong> the <strong>evolution</strong> <strong>of</strong> codon usage bias in eukaryotic genomes.<br />
Genetics 178:2429-2432.<br />
Sung GH, Sung JM, Hywel-Jones NL, <strong>and</strong> Spatafora JW. 2007. A multi-gene phylogeny <strong>of</strong><br />
Clavicipitaceae (Ascomycota, Fungi): Identification <strong>of</strong> localized incongruence using a<br />
combinational bootstrap approach. Molecular Phylogenetics <strong>and</strong> Evolution 44:1204-1223.<br />
Sw<strong>of</strong>ford DL. 2002. PAUP*. Phylogenetic Analysis Using Parsimony (*<strong>and</strong> Other Methods). Version 4.<br />
Sinauer Associates, Sunderl<strong>and</strong>, Massachusetts.<br />
Tartar A, Boucias DG, Adams BJ, <strong>and</strong> Becnel JJ. 2002. Phylogenetic analysis identifies the invertebrate<br />
pathogen Helicosporidium sp. as a <strong>green</strong> alga (Chlorophyta). International Journal <strong>of</strong><br />
Systematic <strong>and</strong> Evolutionary Microbiology 52:273-279.<br />
Telford MJ, Wise MJ, <strong>and</strong> Gowri-Shankar V. 2005. Consideration <strong>of</strong> RNA secondary structure<br />
significantly improves likelihood-based estimates <strong>of</strong> phylogeny: Examples from the Bilateria.<br />
Molecular Biology <strong>and</strong> Evolution 22:1129-1136.<br />
Than C, Ruths D, Innan H, <strong>and</strong> Nakhleh L. 2006. Identifiability issues in phylogeny-based detection <strong>of</strong><br />
horizontal gene transfer. Pp. 215-229. Comparative Genomics, Proceedings.<br />
Thorne JL, Kishino H, <strong>and</strong> Painter IS. 1998. Estimating the rate <strong>of</strong> <strong>evolution</strong> <strong>of</strong> the rate <strong>of</strong> <strong>molecular</strong><br />
<strong>evolution</strong>. Molecular Biology <strong>and</strong> Evolution 15:1647-1657.<br />
Tourancheau AB, Tsao N, Klobutcher LA, Pearlman RE, <strong>and</strong> Adoutte A. 1995. Genetic code deviations<br />
in the ciliates: evidence for multiple <strong>and</strong> independent events. EMBO Journal 14:3262-3267.<br />
Turmel M, Ehara M, Otis C, <strong>and</strong> Lemieux C. 2002a. Phylogenetic relationships among streptophytes<br />
as inferred from chloroplast small <strong>and</strong> large subunit rRNA gene sequences. Journal <strong>of</strong><br />
<strong>Phycology</strong> 38:364-375.<br />
Turmel M, Otis C, <strong>and</strong> Lemieux C. 2002b. The complete mitochondrial DNA sequence <strong>of</strong> Mesostigma<br />
viride identifies this <strong>green</strong> alga as the earliest <strong>green</strong> plant divergence <strong>and</strong> predicts a highly<br />
compact mitochondrial genome in the ancestor <strong>of</strong> all <strong>green</strong> plants. Molecular Biology <strong>and</strong><br />
Evolution 19:24-38.<br />
Turmel M, Otis C, <strong>and</strong> Lemieux C. 2003. The mitochondrial genome <strong>of</strong> Chara vulgaris: Insights into<br />
the mitochondrial DNA architecture <strong>of</strong> the last common ancestor <strong>of</strong> <strong>green</strong> <strong>algae</strong> <strong>and</strong> l<strong>and</strong><br />
plants. Plant Cell 15:1888-1903.
158 REFERENCES<br />
Turmel M, Otis C, <strong>and</strong> Lemieux C. 2006. The chloroplast genome sequence <strong>of</strong> Chara vulgaris sheds<br />
new light into the closest <strong>green</strong> algal relatives <strong>of</strong> l<strong>and</strong> plants. Molecular Biology <strong>and</strong> Evolution<br />
23:1324-1338.<br />
Turmel M, Brouard JS, Gagnon C, Otis C, <strong>and</strong> Lemieux C. 2008. Deep division in the Chlorophyceae<br />
(Chlorophyta) revealed by chloroplast phylogenomic analyses. Journal <strong>of</strong> <strong>Phycology</strong> 44:739-<br />
750.<br />
Turmel M, Gagnon M-C, O'Kelly CJ, Otis C, <strong>and</strong> Lemieux C. 2009. The chloroplast genomes <strong>of</strong> the<br />
<strong>green</strong> <strong>algae</strong> Pyramimonas, Monomastix, <strong>and</strong> Pycnococcus shed new light on the <strong>evolution</strong>ary<br />
history <strong>of</strong> prasinophytes <strong>and</strong> the origin <strong>of</strong> the secondary chloroplasts <strong>of</strong> euglenids. Molecular<br />
Biology <strong>and</strong> Evolution 26:631-648.<br />
Van de Peer Y, Taylor JS, Braasch I, <strong>and</strong> Meyer A. 2001. The ghost <strong>of</strong> selection past: Rates <strong>of</strong> <strong>evolution</strong><br />
<strong>and</strong> functional divergence <strong>of</strong> anciently duplicated genes. Journal <strong>of</strong> Molecular Evolution<br />
53:436-446.<br />
van den Hoek C. 1963. Revision <strong>of</strong> the European species <strong>of</strong> Cladophora, Brill, Leiden, The<br />
Netherl<strong>and</strong>s.<br />
van den Hoek C, Mann DG, <strong>and</strong> Jahns HM. 1995. Algae. An Introduction to <strong>Phycology</strong>. Cambridge<br />
University Press, Cambridge.<br />
van Oppen MJH, Olsen JL, <strong>and</strong> Stam WT. 1995. Genetic variation within <strong>and</strong> among North Atlantic<br />
<strong>and</strong> Baltic populations <strong>of</strong> the benthic alga Phycodrys rubens (Rhodophyta). European Journal<br />
<strong>of</strong> <strong>Phycology</strong> 30:251-260.<br />
Venditti C, Meade A, <strong>and</strong> Pagel M. 2008. Phylogenetic mixture models can reduce node-density<br />
artifacts. Systematic Biology 57:286-293.<br />
Verbruggen H, Leliaert F, Maggs CA, Shimada S, Schils T, Provan J, Booth D, Murphy S, De Clerck O,<br />
Littler DS, Littler MM, <strong>and</strong> Coppejans E. 2007. Species boundaries <strong>and</strong> phylogenetic<br />
relationships within the <strong>green</strong> algal genus Codium (Bryopsidales) based on plastid DNA<br />
sequences. Molecular Phylogenetics <strong>and</strong> Evolution 44:240-254.<br />
Verbruggen H. 2008. TreeGradients v1.02. http://www.phycoweb.net<br />
Verbruggen H <strong>and</strong> Theriot EC. 2008. Building trees <strong>of</strong> <strong>algae</strong>: some advances in phylogenetic <strong>and</strong><br />
<strong>evolution</strong>ary analysis. European Journal <strong>of</strong> <strong>Phycology</strong> 43.<br />
Verbruggen H. 2009. TreeGradients v1.02. http://www.phycoweb.net<br />
Verbruggen H, Ashworth M, LoDuca ST, Vlaeminck C, Cocquyt E, Sauvage T, Zechman FW, Littler DS,<br />
Littler MM, Leliaert F, <strong>and</strong> De Clerck O. 2009. A multi-locus time-calibrated phylogeny <strong>of</strong> the<br />
siphonous <strong>green</strong> <strong>algae</strong>. Molecular Phylogenetics <strong>and</strong> Evolution 50:642-653.<br />
Vetsigian K <strong>and</strong> Goldenfeld N. 2009. Genome rhetoric <strong>and</strong> the emergence <strong>of</strong> compositional bias. Pp.<br />
215-220.<br />
Vroom PS <strong>and</strong> Smith CM. 2003. Reproductive features <strong>of</strong> Hawaiian Halimeda velasquezii<br />
(Bryopsidales, Chlorophyta), <strong>and</strong> an <strong>evolution</strong>ary assessment <strong>of</strong> reproductive characters in<br />
Halimeda. Cryptogamie Algologie 24:355-370.<br />
Waddell PJ, Cao Y, Hauf J, <strong>and</strong> Hasegawa M. 1999. Using novel phylogenetic methods to evaluate<br />
mammalian mtDNA, including amino acid-invariant sites-LogDet plus site stripping, to detect<br />
internal conflicts in the data, with special reference to the positions <strong>of</strong> hedgehog, armadillo,<br />
<strong>and</strong> elephant. Systematic Biology 48:31-53.<br />
Wahlberg N <strong>and</strong> Wheat CW. 2008. Genomic outposts serve the phylogenomic pioneers: designing<br />
novel nuclear markers for genomic DNA extractions <strong>of</strong> Lepidoptera. Systematic Biology<br />
57:231-242.
REFERENCES 159<br />
Wan XF, Zhou J, <strong>and</strong> Xu D. 2006. CodonO: a new informatics method for measuring synonymous<br />
codon usage bias within <strong>and</strong> across genomes. International Journal <strong>of</strong> General Systems<br />
35:109-125.<br />
Watanabe S, Kuroda N, <strong>and</strong> Maiwa F. 2001. Phylogenetic status <strong>of</strong> Helicodictyon planctonicum <strong>and</strong><br />
Desmochloris halophila gen. et comb. nov <strong>and</strong> the definition <strong>of</strong> the class Ulvophyceae<br />
(Chlorophyta). Phycologia 40:421-434.<br />
Watanabe S <strong>and</strong> Nakayama T. 2007. Ultrastructure <strong>and</strong> phylogenetic relationships <strong>of</strong> the unicellular<br />
<strong>green</strong> <strong>algae</strong> Ignatius tetrasporus <strong>and</strong> Pseudocharacium americanum (Chlorophyta).<br />
Phycological Research 55:1-16.<br />
Wiens JJ. 2005. Can incomplete taxa rescue phylogenetic analyses from long-branch attraction?<br />
Systematic Biology 54:731-742.<br />
Wiens JJ, Kuczynski CA, Smith SA, Mulcahy DG, Sites JW, Townsend TM, <strong>and</strong> Reeder TW. 2008.<br />
Branch lengths, support, <strong>and</strong> congruence: testing the phylogenomic approach with 20<br />
nuclear loci in snakes. Systematic Biology 57:420-431.<br />
Wiens JJ <strong>and</strong> Moen DS. 2008. Missing data <strong>and</strong> the accuracy <strong>of</strong> Bayesian phylogenetics. Journal <strong>of</strong><br />
Systematics <strong>and</strong> Evolution 46:307-314.<br />
Wille N. 1890. Cladophoraceae. Pp. 114-119 in A. Engler, <strong>and</strong> K. Prantl, eds. Die natürlichen<br />
Pflanzenfamilien. I.Teil, Abt. 2, Leipzig.<br />
Wolf PG. 1997. Evaluation <strong>of</strong> atpB nucleotide sequences for phylogenetic studies <strong>of</strong> ferns <strong>and</strong> other<br />
pteridophytes. American Journal <strong>of</strong> Botany 84:1429-1440.<br />
Womersley HBS. 1984. The marine benthic flora <strong>of</strong> southern Australia. Part I. Government Printer,<br />
South Australia, Adelaide.<br />
Worden AZ, Lee J-H, Mock T, Rouze P, Simmons MP, Aerts AL, Allen AE, Cuvelier ML, Derelle E,<br />
Everett MV, Foulon E, Grimwood J, Gundlach H, Henrissat B, Napoli C, McDonald SM, Parker<br />
MS, Rombauts S, Salamov A, Von Dassow P, Badger JH, Coutinho PM, Demir E, Dubchak I,<br />
Gentemann C, Eikrem W, Gready JE, John U, Lanier W, Lindquist EA, Lucas S, Mayer KFX,<br />
Moreau H, Not F, Otillar R, Panaud O, Pangilinan J, Paulsen I, Piegu B, Poliakov A, Robbens S,<br />
Schmutz J, Toulza E, Wyss T, Zelensky A, Zhou K, Armbrust EV, Bhattacharya D, Goodenough<br />
UW, Van de Peer Y, <strong>and</strong> Grigoriev IV. 2009. Green <strong>evolution</strong> <strong>and</strong> dynamic adaptations<br />
revealed by genomes <strong>of</strong> the marine picoeukaryotes Micromonas. Science 324:268-272.<br />
Wuyts J, Van de Peer Y, <strong>and</strong> Wachter RD. 2001. Distribution <strong>of</strong> substitution rates <strong>and</strong> location <strong>of</strong><br />
insertion sites in the tertiary structure <strong>of</strong> ribosomal RNA. Nucleic Acids Research 29:5017-<br />
5028.<br />
Wuyts J, Perriere G, <strong>and</strong> Van de Peer Y. 2004. The European ribosomal RNA database. Nucleic Acids<br />
Research 32:D101-D103.<br />
Yamamoto M, Nozaki H, <strong>and</strong> Kawano S. 2001. Evolutionary relationships among multiple modes <strong>of</strong><br />
cell division in the genus Nannochloris (Chlorophyta) revealed by genome size, actin gene<br />
multiplicity, <strong>and</strong> phylogeny. Journal <strong>of</strong> <strong>Phycology</strong> 37:106-120.<br />
Yamamoto M, Nozaki H, Miyazawa Y, Koide T, <strong>and</strong> Kawano S. 2003. Relationship between presence<br />
<strong>of</strong> a mother cell wall <strong>and</strong> speciation in the unicellular microalga Nannochloris (Chlorophyta).<br />
Journal <strong>of</strong> <strong>Phycology</strong> 39:172-184.<br />
Yoon HS, Hackett JD, Ciniglia C, Pinto G, <strong>and</strong> Bhattacharya D. 2004. A <strong>molecular</strong> timeline for the origin<br />
<strong>of</strong> photosynthetic eukaryotes. Molecular Biology <strong>and</strong> Evolution 21:809-818.
160 REFERENCES<br />
Zechman FW, Theriot EC, Zimmer EA, <strong>and</strong> Chapman RL. 1990. <strong>Phylogeny</strong> <strong>of</strong> the Ulvophyceae<br />
(Chlorophyta): cladistic analysis <strong>of</strong> nuclear-encoded rRNA sequence data. Journal <strong>of</strong><br />
<strong>Phycology</strong> 26:700-710.<br />
Zhang HC <strong>and</strong> Qiao GX. 2007. Systematic status <strong>of</strong> the genus Formosaphis Takahashi <strong>and</strong> the<br />
<strong>evolution</strong> <strong>of</strong> galls based on the <strong>molecular</strong> phylogeny <strong>of</strong> Pemphigini (Hemiptera: Aphididae:<br />
Eriosomatinae). Systematic Entomology 32:690-699.<br />
Zhang RF, Cui ZL, Zhang XZ, Jiang JD, Gu JD, <strong>and</strong> Li SP. 2006. Cloning <strong>of</strong> the organophosphorus<br />
pesticide hydrolase gene clusters <strong>of</strong> seven degradative bacteria isolated from a methyl<br />
parathion contaminated site <strong>and</strong> evidence <strong>of</strong> their horizontal gene transfer. Biodegradation<br />
17:465-472.<br />
Zimmer A, Lang D, Richardt S, Frank W, Reski R, <strong>and</strong> Rensing SA. 2007. Dating the early <strong>evolution</strong> <strong>of</strong><br />
plants: detection <strong>and</strong> <strong>molecular</strong> clock analyses <strong>of</strong> orthologs. Molecular Genetics <strong>and</strong><br />
Genomics 278:393-402.<br />
Zuccarello GC, Price N, Verbruggen H, <strong>and</strong> Leliaert F. 2009. Analysis <strong>of</strong> a plastid multigene dataset<br />
<strong>and</strong> the phylogenetic position <strong>of</strong> the marine macroalga Caulerpa filiformis (Chlorophyta).<br />
Journal <strong>of</strong> <strong>Phycology</strong> in press.<br />
Zuker M. 2003. Mfold web server for nucleic acid folding <strong>and</strong> hybridization prediction. Nucleic Acids<br />
Research 31:3406-3415.<br />
Zwickl DJ <strong>and</strong> Hillis DM. 2002. Increased taxon sampling greatly reduces phylogenetic error.<br />
Systematic Biology 51:588-598.
Summary<br />
Green <strong>algae</strong> are distributed worldwide <strong>and</strong> can be found in almost every habitat, ranging from polar<br />
to tropical marine, freshwater <strong>and</strong> terrestrial environments, <strong>and</strong> as symbionts. They exhibit a<br />
remarkable morphological <strong>and</strong> cytological diversity ranging from unicells <strong>and</strong> colonial forms, over<br />
multicellular filaments <strong>and</strong> foliose blades, to siphonous life forms that are essentially composed <strong>of</strong> a<br />
single giant cell containing countless nuclei. Together with l<strong>and</strong> plants, <strong>green</strong> <strong>algae</strong> form the <strong>green</strong><br />
lineage or Viridiplantae. Morphological <strong>and</strong> <strong>molecular</strong> studies have identified a major split within the<br />
Viridiplantae giving rise to two monophyletic lineages, the Chlorophyta <strong>and</strong> the Streptophyta. The<br />
Streptophyta consists <strong>of</strong> several lineages <strong>of</strong> freshwater <strong>green</strong> <strong>algae</strong> from which l<strong>and</strong> plants evolved<br />
approximately 470 million years ago. Whereas considerable progress has been made during the past<br />
decade in clarifying the relationships among the streptophyte <strong>green</strong> <strong>algae</strong> <strong>and</strong> l<strong>and</strong> plants, the<br />
phylogeny <strong>and</strong> <strong>evolution</strong>ary history <strong>of</strong> the Chlorophyta has been more difficult to elucidate.<br />
The Chlorophyta consists <strong>of</strong> a paraphyletic assemblage <strong>of</strong> early diverging unicellular <strong>green</strong> <strong>algae</strong>,<br />
termed the prasinophytes, which gave rise to three main clades, the classes Ulvophyceae,<br />
Trebouxiophyceae <strong>and</strong> Chlorophyceae (UTC). The relationships among these three classes have been<br />
at the center <strong>of</strong> a long-st<strong>and</strong>ing debate. Based on ultrastuctural characters, <strong>and</strong> SSU nrDNA,<br />
chloroplast <strong>and</strong> mitochondrial phylogenies all possible relationships between UTC classes have been<br />
hypothesized. The unstable relationships exhibited among these three classes are likely due to a<br />
combination <strong>of</strong> their ancient age <strong>and</strong> the short time span over which they diverged from one<br />
another. Determining relationships among the different orders <strong>of</strong> the Ulvophyceae poses a similar<br />
problem. Up to now, <strong>green</strong> algal phylogenies were either based on limited gene or taxon sampling.<br />
The slow progress in <strong>green</strong> algal phylogenetics is in part due to difficulties in amplifying single-copy<br />
nuclear markers, as a consequence <strong>of</strong> the limited availability <strong>of</strong> genomic data for <strong>green</strong> <strong>algae</strong> <strong>and</strong> the<br />
presence <strong>of</strong> large introns in their genes.<br />
In Chapter 2, we performed phylogenetic analyses (ML <strong>and</strong> BI) <strong>of</strong> seven nuclear genes, SSU nrDNA<br />
<strong>and</strong> two plastid markers with carefully chosen partitioning strategies <strong>and</strong> models <strong>of</strong> sequence<br />
<strong>evolution</strong>. We obtained high support across the topology <strong>of</strong> the Chlorophyta, show the monophyly <strong>of</strong><br />
the UTC classes <strong>and</strong> reveal a sister relationship between Chlorophyceae <strong>and</strong> Ulvophyceae. Even<br />
though topology tests (AU) do not exclude an alternative branching order <strong>of</strong> UTC classes, we showed<br />
that moderate removal <strong>of</strong> fast-evolving sites improves the phylogenetic signal in the desired epoch.<br />
We also inferred the relationships among the Ulvophyceae, which was found to consist <strong>of</strong> two main<br />
clades. The first clade contains the orders Ulvales <strong>and</strong> Ulotrichales. The second clade includes the<br />
early diverging genus Ignatius <strong>and</strong> a clade comprising the orders Trentepohliales, Bryopsidales,<br />
Dasycladales <strong>and</strong> Cladophorales, along with Blastophysa. In this clade, the Bryopsidales <strong>and</strong><br />
Dasycladales are sisters, Blastophysa is most closely related to the Cladophorales, while the<br />
phylogenetic position <strong>of</strong> the Trentepohliales remains uncertain. The inferred relationships provide<br />
novel insights into the <strong>evolution</strong> <strong>of</strong> multicellularity <strong>and</strong> multinucleate cells in the <strong>green</strong> tree <strong>of</strong> life.<br />
Multicellularity evolved multiple times independently in the Streptophyta <strong>and</strong> Chlorophyta, <strong>and</strong> at<br />
least twice in the two main clades <strong>of</strong> the Ulvophyceae. Siphonous thallus structures are most likely
162 SUMMARY<br />
derived from a multinucleate <strong>and</strong> multicellular common ancestor <strong>of</strong> the Bryopsidales—<br />
Dasycladales—Cladophorales clade.<br />
In order to better underst<strong>and</strong> the timeframe in which key <strong>evolution</strong>ary events took place in the <strong>green</strong><br />
<strong>algae</strong>, we dated our multilocus phylogeny using relaxed <strong>molecular</strong> clock methods <strong>and</strong> the fossil<br />
record (Chapters 6 <strong>and</strong> 8). This dated phylogeny shows a rapid radiation <strong>of</strong> the UTC classes in ca. 20<br />
my during the first period <strong>of</strong> the Neoproterozoic (between 900—881 my) <strong>and</strong> a Neoproterozoic<br />
diversification <strong>of</strong> all ulvophycean orders in a timeframe <strong>of</strong> ca. 130 my (between 826—596 my).<br />
Guided by this improved <strong>green</strong> algal phylogenetic tree, we addressed various topics relating to<br />
<strong>molecular</strong> <strong>evolution</strong> <strong>of</strong> the Chlorophyta.<br />
In Chapter 3, we studied the distribution <strong>and</strong> gain-loss patterns <strong>of</strong> elongation factor genes.<br />
Elongation factor-1 alpha (EF-1α) <strong>and</strong> elongation factor-like (EFL), two key genes <strong>of</strong> the translational<br />
apparatus, have an almost mutually exclusive distribution in eukaryotes. All streptophytes except<br />
Mesostigma encode EF-1α. In the Chlorophyta, the prasinophytes, Trebouxiophyceae, Chlorophyceae<br />
<strong>and</strong> ulvophycean orders Ulvales <strong>and</strong> Ulotrichales have EFL. We showed that not only the ulvophyte<br />
Acetabularia (Dasycladales) but also closely related lineages, i.e. Ignatius, Cladophorales +<br />
Blastophysa, Bryopsidales <strong>and</strong> other Dasycladales, possess EF-1α.<br />
In order to gain more insight in the <strong>evolution</strong> <strong>of</strong> EF-1α <strong>and</strong> EFL in the Viridiplantae we analyzed their<br />
gain-loss dynamics in a maximum likelihood framework using continuous-time Markov models. These<br />
models revealed that the presence <strong>of</strong> EF-1α, EFL or both genes along the backbone <strong>of</strong> the <strong>green</strong> plant<br />
phylogeny is highly uncertain due to sensitivity to branch lengths <strong>and</strong> lack <strong>of</strong> prior knowledge about<br />
ancestral states or rates <strong>of</strong> gene gain <strong>and</strong> loss. Model refinements based on insights gained from the<br />
EF-1α phylogeny reduce uncertainty but still imply several equally likely possibilities: a primitive EF-<br />
1α state with multiple independent EFL gains or coexistence <strong>of</strong> both genes in the ancestor <strong>of</strong> the<br />
Viridiplantae or Chlorophyta followed by differential loss <strong>of</strong> one or the other gene in the various<br />
lineages.<br />
The genetic code, which translates nucleotide triplets (codons) into amino acids, is virtually identical<br />
in all living organisms. However, a small number <strong>of</strong> eubacterial, <strong>and</strong> eukaryotic nuclear <strong>and</strong><br />
mitochondrial genomes have evolved slight variations on this universal code. A non-canonical code,<br />
in which TAG <strong>and</strong> TAA have been reassigned from stop codons to glutamine, has previously been<br />
reported for the <strong>green</strong> algal order Dasycladales. Based on the amplified housekeeping nuclear genes,<br />
we demonstrate in chapter 4 that this non-canonical genetic code is shared with the related clades<br />
Trentepohliales, Cladophorales <strong>and</strong> Blastophysa, but not with the sister clade <strong>of</strong> the Dasycladales,<br />
the Bryopsidales. We favor a stepwise acquisition model for the <strong>evolution</strong> <strong>of</strong> a non-canonical code,<br />
whereby the alternative codes observed in these <strong>green</strong> algal orders share a single origin. Stop codon<br />
reassignment is a gradual process requiring changes to tRNA <strong>and</strong> eukaryotic release factor (eRF1)<br />
genes. We suggest that mutations in the anticodons <strong>of</strong> canonical glutamine tRNAs occurred once<br />
along the branch leading to the orders Trentepohliales, Dasycladales, Bryopsidales, Cladophorales<br />
<strong>and</strong> the genus Blastophysa. The presence <strong>of</strong> these mutated tRNAs allow TAG <strong>and</strong> TAA codons to be
SUMMARY 163<br />
translated to glutamine instead <strong>of</strong> terminating translation. At this step, the mutated tRNAs compete<br />
with eRF1 for the TAA <strong>and</strong> TAG codons. To complete the transition to the non-canonical code, a<br />
subsequent mutation <strong>of</strong> eRF1 that prevents binding <strong>of</strong> eRF1 with TAG <strong>and</strong> TAA is required. The<br />
complex distribution <strong>of</strong> the non-canonical code in the Ulvophyceae could then be explained by three<br />
independent mutations <strong>of</strong> eRF1 in the Trentepohliales, Dasycladales <strong>and</strong> Cladophorales +<br />
Blastophysa, along with a decrease in importance <strong>of</strong> the mutated tRNAs or their extinction through<br />
selection or drift in the branch leading to the Bryopsidales. A detailed comparison <strong>of</strong> eukaryotic<br />
release factors (eRF1) <strong>and</strong> glutamine tRNAs in the respective clades <strong>of</strong> the Ulvophyceae is, however,<br />
needed to test this <strong>evolution</strong>ary scenario.<br />
In Chapter 5, we studied differences in synonymous codon usage bias <strong>and</strong> GC content among <strong>green</strong><br />
<strong>algae</strong> based on our housekeeping nuclear genes <strong>and</strong> analyzed their <strong>evolution</strong> in a phylogenetic<br />
framework. We observe stronger codon usage bias in the ancestral streptophytes Mesostigma <strong>and</strong><br />
Chlorokybus than in the remainder <strong>of</strong> the Streptophyta. Within the Chlorophyta, the prasinophytes,<br />
Trebouxiophyceae <strong>and</strong> Chlorophyceae have markedly stronger codon usage bias than the<br />
Ulvophyceae. One exception is the ulvophyte Ignatius, which has a markedly stronger codon usage<br />
bias than other members <strong>of</strong> the Ulvophyceae. GC content patterns show congruent trends, species<br />
with strong codon usage bias having high GC content.<br />
We interpret these results along with the biology <strong>of</strong> the organisms in the framework <strong>of</strong> two models:<br />
the mutation-selection-drift model <strong>and</strong> the co-<strong>evolution</strong>ary model <strong>of</strong> genome composition <strong>and</strong><br />
resource allocation. It is remarkable that unicellular organisms <strong>and</strong> colony-forming species have<br />
much more pronounced GC <strong>and</strong> codon usage biases as compared to multicellular <strong>and</strong> macroscopic<br />
species. This may follow from unicells having large population sizes, which leads to more codon<br />
usage bias due to stronger selection as compared to species with smaller population sizes where drift<br />
can more rapidly fix mutation. Their large population sizes are revealed by characteristics for rselected<br />
species: small body size, fast growth rate <strong>and</strong> short generation times. We observe a negative<br />
correlation between rate <strong>of</strong> <strong>molecular</strong> <strong>evolution</strong> <strong>and</strong> codon usage bias <strong>and</strong> a positive correlation<br />
between GC content <strong>and</strong> codon usage bias.<br />
Chapters 6 <strong>and</strong> 7 focus on the phylogenetic relationships <strong>and</strong> <strong>evolution</strong> within two specific<br />
ulvophycean clades. In Chapter 6, we dated a five-locus phylogeny <strong>of</strong> the siphonous orders<br />
Dasycladales <strong>and</strong> Bryopsidales using relaxed <strong>molecular</strong> clock methods calibrated with the fossil<br />
record. These models indicate a late Neoproterozoic or early Cambrian origin <strong>of</strong> the Dasycladales <strong>and</strong><br />
Bryopsidales (571 million years [628–510]) <strong>and</strong> a Paleozoic diversifications <strong>of</strong> the different families<br />
within each order. In Chapter 7 we studied phylogenetic relationships within the Cladophorales<br />
based on small <strong>and</strong> large subunit nrDNA sequences. We found that Uronema curvatum, a marine<br />
micr<strong>of</strong>ilamentous species placed in the Chlorophyceae, is sister to the rest <strong>of</strong> the Cladophorales.<br />
Based on the divergent phylogenetic position <strong>of</strong> U. curvatum we described a new genus <strong>and</strong> family <strong>of</strong><br />
Cladophorales (Okellya, Okellyaceae).
Samenvatting<br />
Groenwieren worden wereldwijd aangetr<strong>of</strong>fen in ongeveer elk mogelijke habitat, zowel in polaire<br />
gebieden alsook in tropische zeeën, zoetwatermeren, terrestrische omgevingen en zelfs als<br />
symbiont. Morfologische en cytologische diversiteit tussen groenwieren is groot, ga<strong>and</strong>e van<br />
eencelligen en kolonies naar meercellige filamenten en bladachtige thalli, tot sifonale levensvormen<br />
die bestaan uit één enkele reusachtige cel met een ontelbaar aantal kernen.<br />
Samen met de l<strong>and</strong>planten vormen de groenwieren de groene planten <strong>of</strong> Viridiplantae.<br />
Morfologische en moleculaire studies toonden aan dat de Viridiplantae opgesplitst worden in 2<br />
mon<strong>of</strong>yletische groepen, de Chlorophyta en Streptophyta. De Streptophyta bestaan uit enkele<br />
groepen van zoetwater groenwieren die ongeveer 470 miljoen jaar geleden aan de oorsprong lagen<br />
van de l<strong>and</strong>planten. De laatste 10 jaar is er veel vooruitgang geboekt in de opheldering van de<br />
verwantschap tussen de streptophyte groenwieren en de l<strong>and</strong>planten. De fylogenie en <strong>evolution</strong>aire<br />
geschiedenis van de Chlorophyta blijken echter moeilijker te onderzoeken.<br />
De Chlorophyta bestaan uit een parafyletische groepering van reeds vroeg gedivergeerde eencellige<br />
groenwieren, de zogenaamde prasinophyten, die aan de basis liggen van drie belangrijke groepen: de<br />
klassen Ulvophyceae, Trebouxiophyceae <strong>and</strong> Chlorophyceae (UTC). De verwantschap tussen deze<br />
drie klassen is niet eenduidig en vormt de basis voor een langdurig debat.<br />
Gebaseerd op ultrastructurele kenmerken en fylogenieën op basis van SSU nrDNA, chloroplast en<br />
mitochondriale genen, zijn alle mogelijke verwantschappen tussen de UTC klassen vastgesteld. Deze<br />
onstabiele verwantschappen worden waarschijnlijk veroorzaakt door een combinatie van de<br />
ouderdom van deze klassen en de korte tijdsspanne waarin ze van elkaar divergeerden. Het bepalen<br />
van de verwantschap tussen de verschillende ordes binnen de Ulvophyceae vormt een gelijkaardig<br />
probleem. Totnogtoe waren groenwier fylogenieën steeds gebaseerd op een beperkt aantal genen <strong>of</strong><br />
taxa. De trage vooruitgang in het ophelderen van de groenwier fylogenie is waarschijnlijk te wijten<br />
aan moeilijkheden bij de amplificatie van nucleaire merkers, waarvan slechts een kopie per genoom<br />
aanwezig is als gevolg van de beperkte beschikbaarheid van genomische data voor groenwieren en<br />
de aanwezigheid van lange introns.<br />
In ho<strong>of</strong>dstuk 2, voeren we een fylogenetische analyse (ML <strong>and</strong> BI) uit op basis van zeven nucleaire<br />
genen, SSU nrDNA en twee chloroplast merkers waarbij veel a<strong>and</strong>acht gaat naar de<br />
partitioneringsstrategie en de keuze van <strong>evolution</strong>aire sequentiemodellen. We verkrijgen zo een<br />
goede ondersteuning van de volledige fylogenie, tonen de mon<strong>of</strong>ylie van de UTC klassen aan en<br />
bewijzen een zusterverwantschap tussen de Chlorophyceae en Ulvophyceae. Alhoewel dat topologie<br />
testen (AU) een alternatieve vertakkingvolgorde tussen de UTC klassen niet uitsluit, tonen we aan dat<br />
het verwijderen van een beperkt aantal snel evoluerende posities het fylogenetisch signaal versterkt<br />
in de gewenste periode.<br />
De studie toont eveneens de verwantschap aan tussen de verschillende ordes binnen de<br />
Ulvophyceae. Deze bestaan uit twee groepen. De eerste groep omvat de Ulvales en Ulotrichales. De<br />
tweede groep bestaat uit het reeds vroeg ontstane genus Ignatius en uit een groep die de ordes<br />
Trentepohliales, Bryopsidales, Dasycladales en Cladophorales, samen met het genus Blastophysa
166 SAMENVATTING<br />
omvat. Binnen deze laatste groep zijn de Bryospsidales en Dasycladales zusters, Blastophysa is het<br />
nauwst verwant aan de Cladophorales, terwijl de fylogenetische positie van de Trentepohliales<br />
onzeker blijft.<br />
De afgeleide verwantschappen verschaffen ons nieuwe inzichten over de evolutie van meercellige<br />
organismen en cellen met meerdere kernen. Meercellige organismen zijn verschillende keren<br />
onafhankelijk van elkaar ontstaan: minstens eenmaal in de Streptophyta en eenmaal in Chlorophyta<br />
en tenminste eenmaal in beide ho<strong>of</strong>dgroepen binnen de Ulvophyceae. Sifonale thallus structuren zijn<br />
hoogstwaarschijnlijk afgeleid van een multinucleate, meercellige voorouder van de Bryopsidales—<br />
Dasycladales—Cladophorales groep.<br />
Om de <strong>evolution</strong>aire tijdschaal waarbinnen deze gebeurtenissen plaatsvonden beter te begrijpen,<br />
hebben we onze multilocus groenwier fylogenie gedateerd aan de h<strong>and</strong> van ‘relaxed <strong>molecular</strong> clock’<br />
methodes en fossiele data (ho<strong>of</strong>dstukken 6 en 8). Deze gedateerde fylogenie geeft een snelle<br />
radiatie van de UTC klassen aan in ca. 20 miljoen jaar (mj) gedurende de eerste periode van het<br />
Neoproterozoic (tussen de 900—881 mj) en een Neoproterozoische diversificatie van alle<br />
ulvophyceae ordes in een tijdsspannen van ca. 130 mj (826—596 mj).<br />
In het kader van deze verbeterde groenwier fylogenie worden verschillende topics gerelateerd aan<br />
moleculaire evolutie binnen de Chlorophyta besproken.<br />
In ho<strong>of</strong>dstuk 3 bestuderen we de distributie en evolutie van ‘elongation factor’ genen. Elongation<br />
factor-1 alpha (EF-1α) en elongation factor-like (EFL), twee sleutelgenen van het translatie apparaat,<br />
hebben een onderling exclusief distributiepatroon in eukaryoten. Alle Streptophyta, behalve<br />
Mesostigma, hebben EF-1α. In de Chlorophyta hebben de prasin<strong>of</strong>yten, Trebouxiophyceae,<br />
Chlorophyceae en ulvophyte ordes Ulvales en Ulotrichales het EFL gen. Wij tonen aan dat niet alleen<br />
de ulv<strong>of</strong>yt Acetabularia (Dasycladales), maar ook nauw verwante groepen, in het bijzonder Ignatius,<br />
Cladophorales + Blastophysa, Bryopsidales en <strong>and</strong>ere Dasycladales, EF-1α bezitten.<br />
Om meer inzicht te krijgen in de evolutie van EF-1α en EFL binnen de Viridiplantae, hebben we de<br />
dynamiek van winst en verlies van deze genen in een maximum likelihood kader geanalyseerd met<br />
behulp van ‘continuous-time Markov’ modellen. Deze modellen tonen aan dat de aanwezigheid van<br />
EF-1α, EFL <strong>of</strong> beide genen langsheen de fylogenie van de groene planten onzeker is tengevolge van<br />
gevoeligheid voor taklengtes en een gebrek aan voorafga<strong>and</strong>e kennis omtrent voorouderlijke<br />
kenmerktoest<strong>and</strong>en en de snelheid van aanwinst en verlies van deze genen. Inzichten afgeleid van de<br />
EF-1α fylogenie maakten het mogelijk om ons model te verfijnen en verminderden de onzekerheid<br />
omtrent de aanwezigheid van EF-1α, EFL <strong>of</strong> beide genen. Desondanks blijven er nog steeds 3<br />
mogelijke scenario’s over: EF-1α als voorouderlijke toest<strong>and</strong> met meerdere onafhankelijke<br />
aanwinsten van EFL <strong>of</strong> een co-existentie van beide genen in de voorouder van de Viridiplantae <strong>of</strong><br />
Chlorophyta gevolgd door differentieel verlies van een van beide genen in de verschillende<br />
<strong>evolution</strong>aire lijnen.<br />
De genetische code, die nucleotide triplets (codons) vertaalt naar aminozuren, is bijna identiek in alle<br />
levende organismen. Een klein aantal eubacteriële en eukaryote genomen ontwikkelden echter
SAMENVATTING 167<br />
kleine variaties op deze universele code. Een alternatieve code, waarbij TAG en TAA ver<strong>and</strong>eren van<br />
stop codons naar glutamine coderende codons, was reeds aangetoond bij de groenwier orde<br />
Dasycladales. Op basis van de geamplificeerde nucleaire huishoudgenen, tonen we in ho<strong>of</strong>dstuk 4<br />
aan dat deze alternatieve code ook voorkomt bij de nauw verwanten groepen Trentepohliales,<br />
Cladophorales en Blastophysa, maar niet bij de zustergroep van de Dasycladales, de Bryopsisales.<br />
We verkiezen een ‘stepwise acquisition’ model voor de evolutie van de alternatieve code, waarbij de<br />
alternatieve code, geobserveerd in deze groenwier ordes, een gemeenschappelijk oorsprong heeft.<br />
De ver<strong>and</strong>ering van stop codon naar aminozuur coderend codon is een geleidelijk proces dat tevens<br />
ver<strong>and</strong>ering in tRNAs en ‘eukaryotic release factor’ (eRF1) genen vergt. We veronderstellen dat<br />
mutaties in het anticodon van gewone glutamine tRNAs eenmaal plaatsvond in de tak leidend naar<br />
de groepen Trentepohliales, Dasycladales, Bryopsidales, Cladophorales <strong>and</strong> the genus Blastophysa.<br />
De aanwezigheid van gemuteerde tRNAs (met anticodons complementair aan TAG en TAA) maakt<br />
het dan mogelijk dat TAG en TAA codons worden vertaald in glutamine in plaats van de translatie te<br />
beëindigen. Op dat moment zijn de gemuteerde tRNAs in competitie met eRF1 om te binden op TAG<br />
en TAA codons. Om de overgang naar een alternatieve code te vervolledigen is een mutatie in het<br />
eRF1 gen, die de binding met TAG en TAA verhindert, noodzakelijk. De complexe distributie van de<br />
alternatieve code binnen de Ulvophyceae kan verklaard worden door drie onafhankelijk mutaties van<br />
eRF1 in de Trentepohliales, Dasycladales, Cladophorales + Blastophysa tezamen met een afname in<br />
belang <strong>of</strong> verlies van de gemuteerde tRNAs door selectie <strong>of</strong> genetische drift in de tak leidend naar de<br />
Bryopsidales. Een nauwgezette vergelijking van eRF1 genen en glutamine tRNAs in de verschillende<br />
groepen binnen de Ulvophyceae is echter noodzakelijk om dit scenario te testen.<br />
In ho<strong>of</strong>dstuk 5 bestuderen we verschillen in codon gebruik en GC % tussen groenwieren gebaseerd<br />
op onze huishoudgenen en analyseren we de evolutie van codon gebruik en GC % in een<br />
fylogenetisch kader. We stellen een sterkere bias in codon gebruik vast bij de strept<strong>of</strong>yten<br />
Mesostigma en Chlorokybus dan bij de rest van de Streptophyta. Binnen de Chlorophyta hebben de<br />
prasin<strong>of</strong>yten, Trebouxiophyceae en Chlorophyceae veel meer bias in codon gebruik dan de<br />
Ulvophyceae. Een uitzondering is de ulv<strong>of</strong>yt Ignatius die veel meer bias in codon gebruik heeft dan<br />
de rest van de Ulvophyceae. GC waarden vertonen een gelijkaardig patroon, soorten met veel bias in<br />
codon gebruik hebben een hoger GC gehalte.<br />
Deze resultaten worden gerelateerd aan de biologie van de organismen door middel van twee<br />
modellen: het mutatie-selectie-drift model en het co-evolutie model tussen genoomsamenstelling en<br />
bouwsteen allocatie. Het valt op dat unicellulaire organismen en kolonievormende soorten veel meer<br />
bias in GC % en codon gebruik vertonen dan multicellulaire en macroscopische organismen. Dit kan<br />
het gevolg zijn van de grotere populatiegrootte van unicellulaire organismen waarbij een hogere<br />
selectiedruk leidt tot een sterkere bias in codon gebruik. Bij soorten met een kleine populatiegrootte<br />
zal de genetische drift er namelijk voor zorgen dat mutaties snel fixeren. De grote populatiegrootte is<br />
kenmerkend voor r-geselecteerde soorten. R-geselecteerde sooten zijn tevens klein, groeien snel en<br />
hebben een korte generatietijd. We stellen een negatieve correlatie vast tussen de snelheid van<br />
moleculaire evolutie en bias in codon gebruik enerzijds en een positieve correlatie tussen GC % en<br />
bias in codon gebruik <strong>and</strong>erzijds.
168 SAMENVATTING<br />
In ho<strong>of</strong>dstukken 6 en 7 ligt de nadruk op de fylogenetisch verwantschap en evolutie binnen enkele<br />
ulvophyt groepen. Gebaseerd op 5 loci, dateren we in ho<strong>of</strong>dstuk 6 een fylogenie van de sifonale<br />
ordes Dasycladales en Bryopsidales gebruik makend van ‘relaxed <strong>molecular</strong> clock’ methodes<br />
gekalibreerd met fossiele gegevens. Volgens deze modellen ontstonden de Dasycladales en<br />
Bryopsidales in het late Neoproterozoic <strong>of</strong> het vroege Cambrium (571 miljoen jaar [628–510]) en<br />
diversifieerden de verschillende families binnen deze ordes gedurende het Paleozoic. In ho<strong>of</strong>dstuk 7<br />
besturen we de fylogenetische verwantschappen binnen de Cladophorales gebaseerd op small en<br />
large subunit nrDNA sequenties. We stellen vast dat Uronema curvatum, een mariene soort<br />
besta<strong>and</strong>e uit kleine filamenten die normaalgezien binnen de Chlorophyceae wordt geplaatst, nauw<br />
verwant is aan de rest van de Cladophorales. Gebaseerd op deze afwijkende fylogenetische positie<br />
beschrijven we een nieuw genus en familie binnen de Cladophorales voor U. curvatum (Okellya,<br />
Okellyaceae).