Article

Aroma Profile, Microbial and Chemical Quality of Ensiled Green Forages Mixtures of Winter Cereals and Italian Ryegrass

1
Hungarian University of Agriculture and Life Sciences, Kaposvár Campus, Guba Sándor Str. 40., H-7400 Kaposvár, Hungary
2
ADEXGO Kft., Lapostelki Str. 13., H-8230 Balatonfüred, Hungary
3
Livestock Performance Testing Ltd., Dózsa György Str. 58., H-2100 Gödöllő, Hungary
4
Nutrition Physiology Research Group, Institute of Physiology and Nutrition, Hungarian University of Agriculture and Life Sciences, Gesztenyés str. 1, H-2053 Herceghalom, Hungary
*
Author to whom correspondence should be addressed.
Agriculture 2021, 11(6), 512; https://doi.org/10.3390/agriculture11060512
Submission received: 1 May 2021 / Revised: 27 May 2021 / Accepted: 28 May 2021 / Published: 31 May 2021

Abstract

:
The objective of this study was to evaluate the aroma profile, microbial and chemical quality of winter cereals (triticale, oats, barley and wheat) and Italian ryegrass (Lolium multiflorum Lam., IRG) plus winter cereal mixture silages detected with an electronic nose. Four commercial mixtures (mixture A (40% of two cultivars of winter triticale + 30% of two cultivars of winter oats + 20% of winter barley + 10% of winter wheat), mixture B (50% of two cultivars of winter triticale + 40% of winter barley + 10% of winter wheat), mixture C (55% of three types of Italian ryegrass + 45% of two cultivars of winter oat), mixture D (40% of three types of Italian ryegrass + 30% of two cultivars of winter oat + 15% of two cultivars of winter triticale + 10% of winter barley + 5% of winter wheat)) were harvested, wilted and ensiled in laboratory-scale silos (n = 80) without additives. Both the principal component analysis (PCA) score plot for aroma profile and linear discriminant analysis (LDA) classification revealed that mixture D had different aroma profile than other mixture silages. The difference was caused by the presence of high ethanol and LA in mixture D. Ethyl esters such as ethyl 3-methyl pentanoate, 2-methylpropanal, ethyl acetate, isoamyl acetate and ethyl-3-methylthiopropanoate were found at different retention indices in mixture D silage. The low LA and higher mold and yeast count in mixture C silage caused off odour due to the presence of 3-methylbutanoic acid, a simple alcohol with unpleasant camphor-like odor. At the end of 90 days fermentation winter cereal mixture silages (mixture A and B) had similar aroma pattern, and mixture C was also similar to winter cereal silages. However, mixture D had different aromatic pattern than other ensiled mixtures. Mixture C had higher (p < 0.05) mold and yeast (Log10 CFU (colony forming unit)/g) counts compared to mixture B. Mixture B and C had higher acetic acid (AA) content than mixture A and D. The lactic acid (LA) content was higher for mixture B than mixture C. In general, the electronic nose (EN) results revealed that the Italian ryegrass and winter cereal mixtures (mixture D) had better aroma profile as compared to winter cereal mixtures (mixture A and B). However, the cereal mixtures (mixture A and B) had better aroma quality than mixture C silage. Otherwise, the EN technology is suitable in finding off odor compounds of ensiled forages.

1. Introduction

The overall aim of ensiling forages is to obtain stable silages with a high recovery of dry matter, energy, highly digestible nutrients, and desirable smell compared with fresh forages. Microbial fermentation during ensiling produces an array of end products such as butyric, acetic, propionic, and lactic acids (LA) which can influence the odor of the final silage and can also change many nutritive aspects of forage [1]. Outcomes from silage fermentation analyses can be used to explain whether an excellent, average, or poor fermentation has occurred during the fermentation process. Relying on these analyses, assumptions can be deduced to explain various outcomes [1]. For instance, in an ideal fermentation process, lactobacillus bacteria use water-soluble carbohydrates such as sugars for the production of excessive lactic acid, to maintain high recovery of dry matter, energy and desirable silage odor for good feed intake. The excessive production of some end products such as butyric acid which was first identified to cause silage off odors [2] and a reduction agent of feed intake [3], the presences of other fermentation acids are critical in determining the balance of volatile fatty acids (VFAs) produced in the rumen [4]. Apart from measuring the nutritional constituents and fibre fractions, silages can be evaluated for volatile organic compounds (VOCs) that result from fermentation reactions to assess fermentation quality based on the content of undesired degradation products [5] and VOCs resulting from the metabolism of undesirable microorganisms (bacteria and yeast) [6]. Masoero et al. [7] applied an electronic nose (EN) to analysis silage quality as a simple alternative method for evaluating gaseous components. The EN exhibited advantages over some other analytical methods, including near-infrared spectroscopy (NIR), for the evaluation of fermentation characteristics of silage and it is also superior at estimating total fatty acid and ammonia levels and buffering capacity [6].
Due to challenges such as the laborious nature of assessing large silage or feedstuff samples, technologies such the electronic nose (e-nose) or aroma sensing machines have been used in some instances [8]. The e-nose can detect the volatile organic compounds (VOCs) emanating from fermented silage [9] and when using GC-MS based e-noses, the present VOCs can be determined.
Information on aroma profile, microbial and chemical quality of silages from winter cereals mixture (triticale, oats, barley and wheat) and Italian ryegrass (Lolium multiflorum Lam., IRG) plus winter cereals mixture are very limited. However, the crop mixtures complement its own property to elevate the fermentation quality and aroma profile of ensiled mixtures. For instance, harvesting at the appropriate time increases the amount of water-soluble carbohydrate (WSC) contents which is determinant for fermentation process during ensiling. The higher inclusion of IRG can improve the fermentation process because IRG has an elevated concentration of WSC, also known as high sugar grasses [10,11,12]. IRG silage is also known as low lignin content grass hybrid silage (ADL: 20 and 27 g/kg DM) [13]. Under normal condition well fermented silage has good aroma profile due to higher LA production. Therefore, our hypothesis was to exploit the advantages of winter cereals and IRG mixtures for maximizing fermentation and microbial quality and aroma profile since the crop mixtures are ensiled without additives. The objective of this study was to evaluate the aroma profile, microbial and chemical quality of silages from winter cereals mixture (triticale, oats, barley and wheat) and Italian ryegrass (Lolium multiflorum Lam., IRG) plus winter cereals mixture detected with an electronic nose.

2. Materials and Methods

2.1. Growing and Ensiling Conditions of Experimental Green Fodder

The trial was carried out on a medium-scale farm (Hungarian University of Agriculture and Life Sciences, Kaposvár Campus, Kaposvár, Hungary—46°22′ N 17°48′ E, 153 m altitude.
Four different forage mixtures (commercial products, Agroteam S.p.a., Torrimpietre, Rome, Italy) were studied: mixture A (40% of two cultivars of winter triticale + 30% of two cultivars of winter oats + 20% of winter barley + 10% of winter wheat), mixture B (50% of two cultivars of winter triticale + 40% of winter barley + 10% of winter wheat), mixture C (55% of three types of Italian ryegrass + 45% of two cultivars of winter oat), mixture D (40% of three types of Italian ryegrass + 30% of two cultivars of winter oat + 15% of two cultivars of winter triticale + 10% of winter barley + 5% of winter wheat). The percentage compositions are on the basis of weight of each crop seed. The experimental field allotted 3 hectares to each mixture. Deep loosening and disc + cylinder cultivation was executed as stubble tillage. 351 kg/ha artificial fertilizer (NPK: 16:16:16) was applied before sowing. Seedbed was prepared by Kongskilde VibroFlex 7400 cultivator (lifted, Kongskilde Agriculture, Albertslund, Denmark). The four different forage mixtures were sown on 29th September 2018 (mixture A: 75 kg seed/ha; mixture B: 75 kg seed/ha; mixture C: 75 kg seed/ha, mixture D: 75 kg seed/ha) with depth of 3 cm with John Deere 740 A type seed drill (Moline, IL, USA). Plant protection treatment was not applied during the growing period. The annual precipitation was 425 mm in 2018 [14]. Cutting was carried out on 4th May 2019, when the plants are in the following stages [15]: Italian ryegrass: BBCH51; oat: BBCH51; triticale: BBCH53; winter wheat: BBCH52; winter barley: BBCH58). The green crop mixtures with chemical composition detailed in Table 1 were wilted to 35% of DM (24 h) without any movement on the windrow. The wilted forage was chopped on concrete surface with theoretical chop length of 9 mm (weight of wilted and chopped forage: 800 kg/mixture). Wilted and chopped materials of 510 g were packed into a laboratory silo (tightly locked without fitted water lock) capacity of 0.72 L (729 kg/m3) using a mechanical hand packer without additives and ensiled for 90 days. Total number of laboratory silos were n = 80 (5 per treatment (n = 20) for chemical and microbial quality + 15 per treatment (n = 60) for aroma profile analysis). Then the silos were stored in the laboratory of the Hungarian University of Agriculture and Life Sciences, Kaposvár Campus, at constant temperature of 21 °C.

2.2. Sample Description

In addition to day 90, the aroma profile of fresh green forage right before ensiling and early fermentation phase of ensiled mixtures were studied by opening five laboratory silos per treatment on days 7 and 14. Sample from fresh green forage (day 0) and from each opening day (7, 14 and 90) were frozen at −20 °C (20 per treatment, n = 80).

2.3. Chemical Analysis

After ensiling for 90 days, five laboratory silos per experimental mixtures were opened (n = 20) and samples of silages collected for chemical and microbial quality and aroma profile analysis. Dry matter (DM), crude protein (CP), ether extract (EE) and total sugar (TS) content of all mixtures were determined following specific procedure identification numbers 37 (Nitrogen), 39 (fat), 44 (fibre), 55 (sugars) of AOAC [16] protocol and Van Soest et al. [17] procedure was used for fiber fraction analysis (ADF, NDF, ADL) following sodium sulphite assay. The laboratory silo was taken randomly and approximately 25 g composite sample was taken from each laboratory silo immediately after opening. The sample silage was mixed with 100 mL of distilled water. After hydration for 10 min, samples were shaked using hand for 40 s, the diluted material was then filtered through cheese cloth and pH was determined using a digital pH meter (Metrohm 744, Metrohm, Basel, Switzerland). The lactic acid (LA) content was analyzed following procedure developed by Megias [18] using a high-performance liquid chromatography (HPLC). Acetic acid (AA), butyric acid (BA), propionic acid (PA) and ethanol were measured with gas chromatography (Chrompack, Model CP 9002, Chrompack, EA Middelburg, Netherlands) GC-FID parameters: injected amount: 3 µL, column: 25 m × 0.32 mm FFAP-CB, detector: 220 °C FID, injector: splitter 160 °C, carrier gas: Helium 70 kPa, column: 40 °C for 3 min → 10 °C/min to 150 °C → kept at 150 °C for 10 min) described by Playne [19]. Ammonia concentration was determined by a modified Berthelot method [20].

2.4. Microbial Quality

The aerobic mesophilic bacteria count (AMC) and molds and yeasts count of ensiled mixtures were determined in the laboratory of the Hungarian University of Agriculture and Life Sciences Kaposvár Campus, following the standard laboratory protocols [21] and [22] using a standard dispersion plate method [23]. Total microbiological counts were expressed as colony forming units per gram (CFU g−1) and were transformed into log10 to obtain the lognormal distribution.

2.5. Aroma Profiling

The electronic nose (EN) measurement was performed in the laboratory of ADEXGO Kft. (Herceghalom, Hungary) with an Alpha MOS Heracles Neo 300 ultra-fast GC analyzer (Alpha MOS, Toulouse, France), specifically designed for the rapid analysis of volatile compounds. Frozen samples were thawed and chopped with scissors. The smell fingerprints of the samples were acquired in 3 replicates by measuring 3-times 1 g of each into 20 mL headspace vials which were then sealed with a magnetic cup and a silicon-polytetrafluoroethylene septum. The EN was equipped with a PAL-RSI autosampler unit (CTC Analytics AG, Zwingen, Switzerland) for standard handling of the samples, generating headspace, and injecting the headspace into the Heracles analyzer unit including an odor concentrator trap and two metal capillary columns (Restek MXT-5 (Restek Co., Bellefonte, PA, USA): length 10 m, ID 0.18 mm, thickness: 0.40 μm, low-polarity stationary phase composed of cross bond 5% diphenyl/95% dimethyl polysiloxane; and Restek MXT-1701 (Restek Co., Bellefonte, PA, USA): length 10 m, ID 0.18 mm, thickness: 0.40 μm, mid-polarity stationary phase composed of cross bond 14% cyanopropylphenyl/86% dimethyl polysiloxane (Restek, Co., Bellefonte, PA, USA). The volatile compounds were separated by both columns simultaneously and detected with two flame ionization detectors (FID). The autosampler and the analyzer were operated with the software AlphaSoft ver. 16 (Alpha MOS, Toulouse, France), and the same software was used for data acquisition and data evaluations. The retention times of the volatiles recorded on both columns were converted to Kováts retention indices (RI) that relate the retention time of the investigated volatile molecules of a sample to the retention time of n-alkanes under the same conditions (Alpha MOS, 2018). The RI characterizes the volatile compounds on the specific columns and can be assigned to specific aroma recorded in the AroChemBase v7 of AlphaSoft software (Alpha MOS, Toulouse, France). In this study, “1-A” as an identifier after the RI refers to column MXT-5 and “2-A” refers to column MXT-1701. Before the analysis, a method was created with the following parameters of the PAL-RSI Autosampler and Heracles GC analyzer: Autosampler: incubation at 40 °C for 5 min with 500 rpm agitation to generate headspace, 1 mL of headspace injected into the Heracles analyzer, flushing time between injections: 90 s; Analyzer: carrier gas: hydrogen, the flow of carrier gas: 30 mL/min, trapping temperature: 30 °C, initial oven temperature: 50 °C, the endpoint of oven temperature: 250 °C, heating rate: 2 °C/s, acquisition duration: 110 s, acquisition period: 0.01 s, injection speed: 125 μL/s, cleaning phase: 8 min. Ethanol, and the two major organic acids of the silages, AA and LA were analyzed as reference chemicals at analytical purity (Carl Roth GmbH, Karlsruhe, Germany) with the EN to identify the characteristic RIs.

2.6. Statistical Analysis

Chemical Composition, Fermentation Characteristics and Microbiological Count

Data were analysed using the GLM procedure for ANOVA in SAS 9.1 software [24]. Significant mean value differences were evaluated by Tukey’s test following a post hoc comparison of means. A significance level of p < 0.05 was used. Variables for nutritional composition, fermentation characteristics and microbiological count among ensiled mixtures were computed using the following model:
Yi = μ + αi + εi
where Yi is the observation in the ith crop mixture, μ is the overall mean, αi is the ith crop mixture effect, εi is the random error.
The multivariate data of the EN measurements describing the odor profiles of the fresh and ensiled samples were analyzed with the AlphaSoft (ver. 16) software (Alpha MOS, Toulouse, France). The chromatograms were transformed into a series of variables called sensors based on the identified chromatogram peaks [25]. The name of a sensor originated from the location of the peak within the chromatogram and was identical to the respective RI. The intensity of the sensor was calculated from the area under the respective chromatogram peak. Principal component analysis (PCA) was performed using the sensor data to detect outlier records and to describe the non-supervised clustering of the samples within the multidimensional space defined by the sensor variables [26]. The PCA models were characterized by the discrimination index (%) between the classified groups, where positive values indicated group separations without overlapping on the examined plane of principal components. Supervised classification models were built using linear discriminant analysis (LDA) to find linear combinations of the sensor variables, optimally discriminating against the pre-defined groups [26]. The accuracy of the LDA classification models was tested with leave-one-out cross-validation, when a single record was left out of the modelling process and was used for testing by predicting its group identity—the process was repeated iteratively until all samples were used for validation once [26]. The cross-validations were evaluated based on the validation score, representing the ratio of correctly classified samples.
During the multivariate data analysis, sensor selection was performed in two ways. First, a priori knowledge was used by measuring pure ethanol, AA and LA with EN, and the RIs of the chemicals were identified. In the knowledge driven phase, these RIs were used for checking the fermentation characteristics on day 90, and results were compared with those of the chemical analysis of silages. Second, in the data driven approach, the sensor selection function of AlphaSoft was used for tracing the most distinctive variables that showed the largest capability to contribute to an LDA model identifying the actual pre-defined groups. The LDA calculations based on the selected sensors were also performed, and the impact of the sensors was evaluated by comparing their orientations in the LDA loading lots to the orientation of the sample groups in the same plane of the discriminant factors (DFs). A sensor is more dominant in those samples to which its loading vector tends. The volatile compounds described by the selected sensors were identified using the AroChemBase database (Alpha MOS, Toulouse, France).

3. Results

3.1. Chemical Compositions of Ensiled Mixtures

The fermentation process and crop mixture type caused significant change (p < 0.05) on the nutritional composition of silage except ADF content (Table 2). At the end of 90 days fermentation mixture A and C had higher (p < 0.01) DM content than mixture B silage. The CP and total sugar contents (p < 0.001) were higher for mixture A and D than mixture B and C silages. The inclusion of 40–55% IRG in winter cereal (mixture C and D silages) had no significant (p > 0.05) advantage over winter cereals silages (mixture A and B). The starch content of all ensiled mixture was very low and below detectable concentration (<0.10 g/kg DM).

3.2. Fermentation Characteristics of Ensiled Mixtures

The crop mixture type caused significant change (p < 0.05) on fermentation characteristics of all ensiled mixtures except ethanol and NH3–N (g/100 g total N) contents (Table 3). At the end of 90 days fermentation mixture D had the highest (p < 0.05) pH value. However, there was no significance difference (p > 0.05) between mixture A and C silages in pH contents. Mixture B and C had higher AA content than mixture A and D. The LA content was higher for mixture B than mixture C, however mixtures A and D were not significantly different (p > 0.05) from mixtures B or C (Table 3).
The amount of total fermentation acids (TFA) was significantly higher (p < 0.05) in mixture B than in the other mixtures. The proportion of LA within TFA showed different arrangements of the mixtures as the LA concentration, as mixture D had the highest value, followed by mixtures A and C. There was no significant difference among these three mixtures, but mixture B showed significantly lower value. LA/AA ratio as an indicator of fermentation quality was highest for mixtures A and D, while mixture C showed the weakest ratio, significantly lower than the best ones. There was no difference (p > 0.05) in NH3–N content among the ensiled mixtures.

3.3. Microbiological Count of Ensiled Mixtures

At the end of 90 days fermentation the crop mixture types caused significant changes (p < 0.05) on both aerobic mesophilic bacterial (AMC) (Log10 CFU/g) and mold and yeast (Log10 CFU/g) counts of ensiled mixtures (Table 4). Mixture C had higher (p < 0.05) AMC (Log10 CFU/g) than other ensiled mixtures. However, it had higher mold and yeast (Log10 CFU/g) counts than mixture B silage.

3.4. Aroma Profiling

Conventionally, odor of silage is determined by sensory experts or professionals, mostly, following the protocols explained by [27]. Silages that are well fermented should not have a strong smell because lactic acid, which is the main organic acid from the good fermentation process, is less odorant than other fatty acids produced during false fermentation processes. Notwithstanding, some silages tend to have a mild smell of vinegar due to acetic acid, produced in the second highest concentration. Silages with very high concentrations of acetic acid will often initiate a burning sensation in the human nose [27]. Fruity smell silages or those with sweet odor are sometimes mistaken to be well-fermented, however, in reality, the smell originates from high ethanol concentration that is produced mainly by yeast [27].

3.4.1. Fermentation Characteristics of Ensiled Mixes Described by EN

In the knowledge driven phase of the EN data analysis, the retention indices of the major volatile compounds were identified using pure chemicals. The RIs of ethanol, AA and LA were 465, 569 and 439 on column MXT-5, and 565, 798 and 492 on column MXT-1701, respectively. The chromatograms of the silages fermented for 90 days were analysed at these RIs. Figure 1 shows the measured intensities of the replicate samples of the four different mixture silages. The applied EN system is very sensitive on ethanol, thus, ethanol gave dominant peaks on both columns (Figure 1a). Figure 1b shows the zoomed image of the bar graph, where the intensities for AA and LA can be seen.

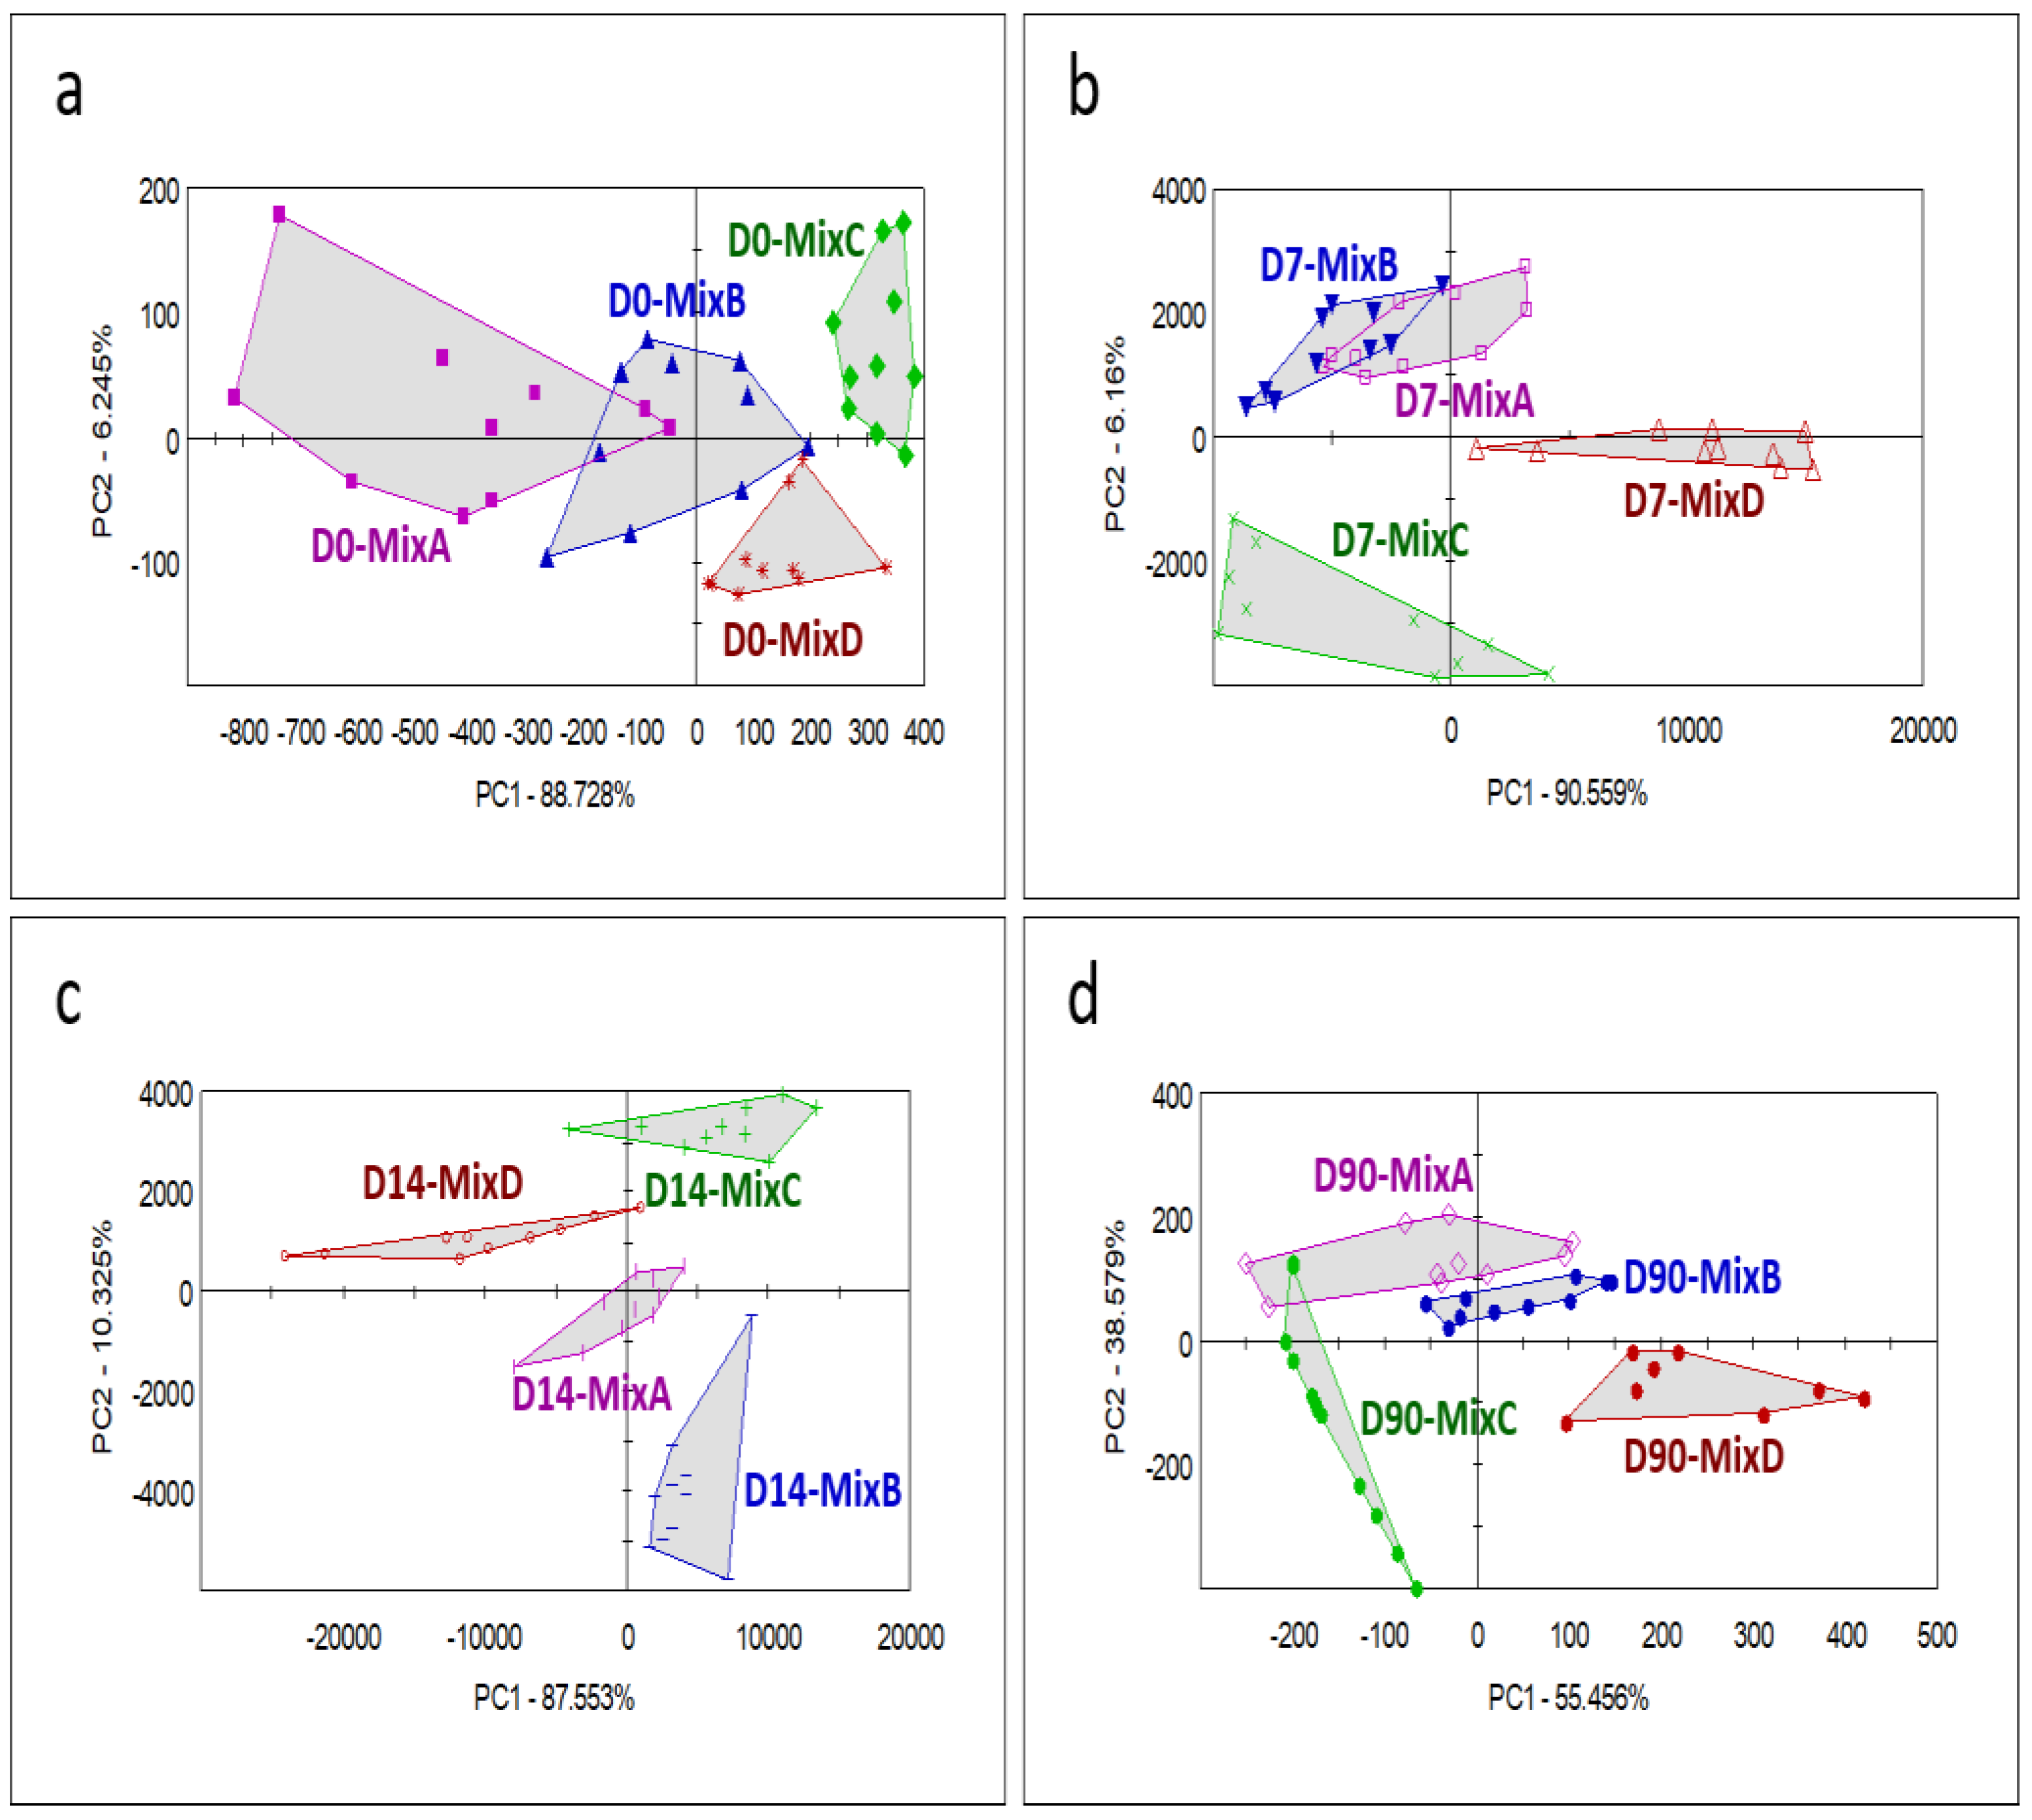
3.4.2. Comparing the Aroma Profiles between Mixtures

In the data driven phase of the EN data analysis, all of the chromatogram peaks describing the aroma profiles were considered as sensors, and this multivariate data of the four mixtures at the fresh and three fermented stages were analyzed. The PCA of the multivariate data showed repeatability of the aroma profiling of the 16 groups (Figure 2). The different types (mixtures A, B, C and D) of the freshly harvested samples formed one group with little variation along PC1 and PC2 describing 99.87% of the total variance of the sensor signals. The early stages of the fermentation (days 7 and 14) resulted in an increase of the variation of the aroma profiles. However, all mixtures showed similar changes, since there was no clear separation of the mixture groups found at 7 or 14 days of the fermentation. The PCA performed with all the 16 groups was dominated by the aroma variation caused by the 90 days of fermentation. At this stage, there was a clear effect of the mixture type on the detected aroma profile. Mixture D had the most unique aroma. Its difference from the other mixtures at the 90-day fermentation stage or at any previous stages is described by the first principal component (PC1) which covers 99.56% of the total variance of the sensor signals. Comparingly, mixtures A, B and C on day 90 are more similar, showing a distribution along PC2, containing 0.31% of the total variance. Mixture C changed the least until the 90th day of the fermentation as its aroma profile remained similar to that of the previous stages. Mixture A and B changed more, but differently than mixture D, because the direction of the change in the PCA score plot if orthogonal, i.e., the samples of mixtures A and B on day 90 are different from samples on day 14 and the difference is caused by the aroma signals described by PC2.

3.4.3. Comparing the Aroma Profiles over Time within a Mixture

When the PCA was performed for each mixture, separately, then different variations of the dataset were highlighted (Figure 3). The patterns of aroma changing during the fermentation process are diverse in the different mixtures. Mixture A was very stable at the beginning, then, its samples on day 90 are very much different from the previous three opening days, and more heterogeneous. Days 7 and 14 of mixture B were very heterogeneous but mostly similar, and these stages were divergent from the homogeneously unique aromas of the initial and end stages. In some aroma properties, day 90 is similar to day 0, since both were positioned in the same region along PC1 that was describing the major variance of the sensor signals. In mixture C, the initially homogeneous forage gets heterogenous by days 7 and 14 of fermentation. The aroma at these stages was highly similar. Samples of day 90 were different again, however, remain heterogenous. The initial stage of mixture D was very homogenous, and day 7 already differs significantly. The fermentation caused small change in the odor by day 14, but day 90 is appearing as a separate group, showing different odor pattern compared to the previous stages.
These changes can also be seen in the LDA graphs of Figure 4 prepared with the sensors most significant in the supervised classification of the given groups. Based on the cross-validation results of the LDA, the samples of days 7 and 14 had very similar odor in mixtures A, B. In mixtures C and D all the 4 days were separated as 93% and 95% of the samples were correctly identified in the cross-validation, respectively. Based on the LDA graphs, the aroma of mixtures A, B, and C changes differently in the first part of fermentation than in the final part, because the direction of day 0, day 7 and day 14 was different from that of day 14 and day 90. Mixture D was the only silage having a continuous change, as the samples of the different sampling days appeared separately along one principal component (PC1).
The results of LDA were similar, but somewhat different from PCA, which difference arises from the fact that LDA is to find differences among the pre-defined groups, while PCA describes the variance of the sensor signals not regarding the group identity, thus, it does not work against the existing similarities of the groups.
The LDA classifications were performed with the sensor selection approach of the AlphaSoft program. The right graphs (b, d, f, h) of Figure 4 show loadings of the LDA for mixtures A, B, C, and D. The loadings indicate the influence of the selected sensors on the linear discriminant factors defining the LDA planes in which we see the separation of the groups in the left graphs (a, c, e, g).

3.4.4. Comparing the Aroma Profiles of All Mixtures at Single Stages

Figure 5 shows the results of PCA when data of the fermentation stages were used and the separation of the four mixtures are indicated. Mixtures A and B were very similar on day 0 and day 7, while all mixtures were similarly different on day 14. On day 90, mixtures A and B were similar again, and mixture C was also similar to these. Mixture D was different from all others at the final stage. The biggest different was seen between mixtures D and C, although in the previous stages the closest neighbor of mixture D was mixture C.
The results of the LDA to classify mixtures at each sampling time highlight some further differences (Figure 6). At the initial stage, each mixture can be identified, but there was a considerable difference between the winter cereals (mixtures A and B) and IRG plus winter cereals mixtures (mixture C and D). This difference was described by the most influential discriminant factor (DF1) which was dominated by the selected sensors representing high absolute values along the DF1 axis in Figure 4b. After one week of the fermentation, mixture C showed a unique odor, and it was different from the rest of the samples along DF1. Mixtures A, B, and D aligned on the DF2. At day 14, the odor of mixture C remains unique, but the difference of the other mixtures was also increasing.
At day 90 (Figure 6g), there was considerable difference between mixtures B and D described by DF1. Mixture A was very close to mixture C which demonstrated odor similarities. Mixtures A and C were highly different from mixtures B and D along both DF1 and DF2.

4. Discussion

4.1. Chemical and Microbial Quality of Ensiled Mixtures

At the end of 90 days fermentation the pH content of ensiled mixtures (except mixture B) were not in a pH range of grass silage (25–35% of DM) 4.3–4.7 reported by [28]. The high pH at day 90 could be associated with low lactic acid concentration 4.35 (mixture A), 5.32 (mixture B), 3.44 (mixture C) and 4.08% of DM (mixture D) probably caused by restricted fermentation which result in low acidification and higher ethanol concentration [1]. Kung and Stanley [29,30] reports that restricted fermentation will occur when epiphytic yeasts converted sucrose into excessive ethanol. Kung et al. [1] reported that during fermentation lactic acid contributes the most to the decline in pH because it is about 10 to 12 times stronger than any of the other major acids such as acetic and propionic acid found in silages. The observed ethanol content for all ensiled mixture (except mixture C) was higher than the range (0.5–1.0) reported by [28]. However, Driehuis and van Wikselaar in [1] reported as high as 5 to 6% of DM concentrations of ethanol in some Dutch grass silage. The NH3–N/total N of all ensiled mixture was low (<5.35 g/100 g total N) at the end of 90 days fermentation. The observed NH3–N/total N at each opening days of all ensiled mixtures were below the ranges (8–12 NH3–N, total N) reported by [28]. For all ensiled mixtures the Aerobic mesophilic bacterial count (AMC) at the end of 90 days fermentation was higher than the normal count 6.00 (Log10 CFU/g) or 1 × 10⁶ (CFU/g) of European decree (EN ISO 4833, Microbiological limits 65-2012 VM Decree Annex 12). The mold and yeast count (Log10 CFU/g) were also higher than the limit recommended as a quality standard for animal feeds (3.00 (Log10 CFU/g) or 1 × 10⁴ (CFU/g) [31] as a result higher level of ethanol was recorded at the end of the 90 days fermentation period. Mold and yeast count were consistent with the results of González et al. [32] who reported 90% of their samples counts over 3.00 (Log10 CFU/g) or 1 × 10⁴ (CFU/g).

4.2. Aroma Profiling

The ranking of the mixture types based on the EN intensities at the RIs of ethanol (Figure 1a) was identical with that found in the chemical characterization of the fermentation process, even though those differences of mixtures were non-significant (Table 3), accordingly, mixture D had the highest ethanol concentration followed by mixtures A, B and C. The EN intensities of Figure 1b do not follow the chemical analysis results in the case of AA, but similarities can be detected in the case of LA ratio within TFA (Table 3) and the intensities measured at the RIs respective to LA (Figure 1b): mixture D showed the highest values, followed by mixtures A, C and B. LA alone is not showing this group arrangement, but LA% in TFA does, thus, the proportion of LA within TFA could better be related to the smell than the overall LA concentration.
The influence of the composition of the different mixtures on the odor profile is shown in fresh samples and in any stages of the fermentation by the very high ratio (≥95%) of correctly classified samples in the cross-validations of the classification models. In both types of classifications, (1) according to the sampling days of a single mixture, or (2) according to the mixture types on a single sampling day, each group was represented by five samples prepared in five different experimental silos. Since the samples of the different silos united in most of the classifications, it is demonstrated that both the fermentation stages and the mixture types cause reproducible odor differences of the silages. As the e-nose measurements of all samples were performed randomly, it is highly unlikely that the clusterings were the result of some sample misrepresentations or systematic sample handling protocols.
The sensors identified as most influential in the classifications are collected in Table 5, with the indication of the possible volatile molecules causing the respective chromatogram peak, assigned in the AroChemBase database of retention indices of volatile chemicals.
Effects of VOCs as markers of variation in silage fermentation quality in the voluntary feed intake of cattle were studied by [33]. Muck [34] confirmed that, the main components responsible for the characteristic smell of silages are volatile fatty acids that evaporate quite easily when introduced to air. Apart from organic acids, other VOCs should be mentioned. Ethanol is obviously associated with an alcohol smell. The gradual change of mixture D during the fermentation (Figure 4g) is described by four sensors with retention indices of 600-1A, 492-2A, 639-2A, and 670-2A. The difference of the mixtures A and B vs. mixtures C and D described in the initial stage (day 0, Figure 6a) is influenced by four sensors. Mixtures A and B are rich in volatiles at retention indices of 658-1A, 1046-1A, 1555-2A, while mixtures C is rich in volatiles at retention index 991-1A. The considerably different odor of mixture C on days 7 and 14 (Figure 6c,e) is caused by volatiles at retention index 506-2A. On day 90, mixture B differed from the other samples based on its richness in volatiles at retention index of 1189-1A, while the unique odor of mixture D was dominated by volatiles at retention indexes of 960-1A, 541-2A, 951-2A.
Some identified volatile compounds (Table 5) have significant importance in silage odor characterization. Volatile compounds which are esters or have esterification potential may give pleasant odor outcomes in silages. Esters often also have characteristic smells because esters known to be odorants, they could affect the taste of silage and, consequently, feed intake [6]. Some authors consider esters more important than organic acids in defining the odour of ensiled mass. Mo et al. [35,36] expected esters to contribute to silage flavour due to their volatility. Furthermore, many esters have low odour thresholds and thus are perceived at concentrations of parts per million. The most abundant esters in silages include ethyl butyrate, acetate and propionate [37]. Figueiredo et al. [38] reported that ethyl esters being the predominant subclass of all esters and the most abundant class of VOCs in red clover silages. Mo et al. [35] reported that ethyl esters is most abundant in grass silage. Ethyl propanoate at retention index 744-2A, characteristic in mixture B on day 14 (Figure 4c,d), and in mixture D on day 7 (Figure 6c,d), is an ethyl ester of propionic acid, ethyl butyrate at retention index 869-2A, characteristic in mixture B on day 14 (Figure 6e,f), is an ester formed from butyric acid and ethanol, and ethyl octanoate at retention index 1189-1A is an ester formed from caprylic acid and ethanol, and found to be characteristic for mixture B on day 90 (Figure 6g,h). These volatiles would likely produce pleasant fruity odors which could increase feed intake [39]. Campagnoli and Dell’Orto [6] also reported that ethyl lactate, which is characterised by a creamy odour with hints of fruit, has a weak negative influence on dry matter intake. However, some off odor compounds were also identified is some silages. These were 3-methylbutanoic acid also called beta-methylbutyric acid [40], a branched chain alkyl carboxylic and 2-methyl-2-propanol, a simple alcohol with unpleasant camphor-like odor [41] were found in fermented mixture C samples at retention index 858-1A (Figure 4e,f) and on day 7 in mixture A at retention index 489-1A (Figure 6c,d). The compounds with potential off odor formation may likely reduce the silage feed intake if they are found in significant amounts. This higher (p < 0.05) mold and yeast (Log10 CFU/g) counts of mixture C could be the reason for the existence of some off odor volatile organic compounds described so far.
Some authors have observed that ethyl acetate and ethyl lactate show a strong correlation with ethanol in fresh and well-fermented silages [6] were found in fermented mixture D (Figure 2) at retention index of 670-2A and fermented samples of mixture A and D at retention index of 1189-1A, 541-2A, 1366-2A (Figure 5a,d).
Results showed that mixture D had different aroma profile than other mixture silages attributed to higher ethanol content. The other reason causing difference in the aroma profile of mixture D and mixture B could be ethyl esters due to the presence of higher LA (for both mixture B and D) as well as AA (mixture B) (Table 3). Ethyl esters are the most abundant VOC in most silages with pleasant smell. Those were found in mixture B and D silages at retention indices of 960-1A (ethyl 3-methyl pentanoate), 639-2A (2 methylpropanal), 670-2A (ethyl acetate), 951-2A (isoamyl acetate) and 1206-2A (ethyl-3-methylthiopropanoate) (Table 5). Particularly 2 methylpropanal abundantly found in wet cereal or straw with pleasant fruity, banana like odor. The low LA in mixture C caused the presence of 3-methylbutanoic acid also called beta-methylbutyric acid, a branched chain alkyl carboxylic and 2-methyl-2-propanol, a simple alcohol with unpleasant camphor-like odor at retention index 858-1A (Table 5) and (Figure 4e,f).

5. Conclusions

The ensiled mixtures had comparable chemical, fermentation and microbial quality. The inclusion of 40–55% IRG in mixture C and D did not cause any significant quality advantages over winter cereal mixtures (mixture A and B). This implies that as far as the mixture crops harvested at proper stage (early heading) it has good fermentable characteristics; and chemical and microbial quality. However restricted fermentation affects the output of fermentation products such as moderate LA and higher ethanol content. Therefore, the use of silage additives such as Lactobacillus bacteria (LAB) recommended in future practical use. Otherwise, the restricted fermentation had mixed effect in IRG plus winter cereal silage (mixture C and D) on aromatic quality; due to the presence of higher ethanol and LA mixture D shows its richness in aromatic quality, however the high mold and yeast count together with lower LA and ethanol contents cause some off odour compound in mixture C which could affect its intake. However, the pure winter cereal mixtures (mixture A and B) had similar aromatic patterns, but its richness is lower than mixture D silage. Electronic nose as applied in this study could be a practically useful rapid analytical technology to characterize fermentation, identify and quantify the most abundant volatile compounds of silages, giving a good description of the sensible smell. The technology also gives the possibility to identify the characteristics of false fermentation processes rapidly.

Author Contributions

Conceptualization, A.W., T.T., S.O., H.F., R.H., G.B. and R.T.; Data curation, A.W., T.T., H.F., H.G.Y., G.B. and R.T.; Formal analysis, A.W., T.T., H.G.Y. and G.B.; Funding acquisition, T.T., B.H. and R.T.; Investigation, A.W., L.K., R.H., H.G.Y., G.B. and R.T.; Methodology, A.W., T.T., R.H., G.B. and R.T.; Project administration, T.T., B.H. and R.T.; Resources, A.W., T.T., B.H., R.H., G.B. and R.T.; Software, A.W., T.T., H.F. and G.B.; Supervision, T.T. and R.T.; Validation, A.W., T.T., S.O., H.F., G.B. and R.T.; Visualization, A.W., T.T., S.O., H.F., B.H., H.G.Y. and R.T.; Writing—original draft, A.W., T.T., G.B. and R.T.; Writing—review & editing, A.W., S.O. and H.F. All authors have read and agreed to the published version of the manuscript.

Funding

This research received no external funding. This research is funded by the European Union and the European Social Fund (grant number: EFOP-3.6.3-VEKOP-16-2017-00005) and EU (Project No.: GINOP-2.3.4.-15-2016-00005) for their financial support. The authors also gratefully acknowledge research funding support from the Hungarian government and EU (Project No.: GINOP-2.3.4.-15-2016-00005).

Institutional Review Board Statement

Not applicable.

Informed Consent Statement

Not applicable.

Data Availability Statement

The datasets used and/or analysed during the current study are available from the corresponding author on reasonable request.

Acknowledgments

The authors gratefully acknowledged the European Union and the European Social Fund (grant number: EFOP-3.6.3-VEKOP-16-2017-00005) and EU (Project No.: GINOP-2.3.4.-15-2016-00005) for their financial support. The authors also gratefully acknowledge research funding support from the Hungarian government and EU (Project No.: GINOP-2.3.4.-15-2016-00005). The authors are grateful to János Tossenberger and Gergő Sudár, Hungarian University of Agriculture and Life Sciences Kaposvár Campus, Institute of Nutrition and Product Development Science for their contributions.

Conflicts of Interest

The authors declare no conflict of interest.

References

  1. Kung, L., Jr.; Shaver, R.D.; Grant, R.J.; Schmidt, R.J. Silage review: Interpretation of chemical, microbial, and organoleptic components of silages. J. Dairy Sci. 2018, 101, 4020–4033. [Google Scholar] [CrossRef]
  2. Harris, C.E.; Raymond, W.F. The effect of ensiling on crop digestibility. J. Br. Grassl. Soci. 1963, 18, 204–212. [Google Scholar] [CrossRef]
  3. Phalow, G.; Muck, R.E.; Driehuis, F.; Qude Elferink, S.J.; Spoelstra, S.F. Microbiology of ensiling. In Silage Science and Technology; Buxton, D.R., Muck, R.E., Harrison, J.H., Eds.; American Society of Agronomy (Agronomy 42): Madison, WI, USA, 2003; pp. 31–93. [Google Scholar]
  4. Charmley, E. Towards improved silage quality—A review. Can. J. Ani. Sci. 2001, 81, 157–168. [Google Scholar] [CrossRef]
  5. Borreani, G.; Tabacco, E.; Cavallarin, L. A new oxygen barrier film reduces aerobic deterioration in farm-scale corn silage. J. Dairy Sci. 2007, 90, 4701–4706. [Google Scholar] [CrossRef] [PubMed] [Green Version]
  6. Campagnoli, A.; Dell’Orto, V. Potential Application of Electronic Olfaction Systems in Feedstuffs Analysis and Animal Nutrition. Sensors 2013, 13, 14611–14632. [Google Scholar] [CrossRef] [PubMed]
  7. Masoero, G.; Sala, G.; Peiretti, P.G. Development of near infrared (NIR) spectroscopy and electronic nose (EN) techniques to analyse the conservation quality of farm silages. J. Food Agri. Envt. 2007, 5, 172–177. [Google Scholar]
  8. Sberveglieri, V.; Carmona, E.N.; Comini, E.; Ponzoni, A.; Zappa, D.; Pirrotta, O.; Pulvirenti, A. A novel electronic nose as adaptable device to judge microbiological quality and safety in foodstuff. Biomed. Res. Int. 2014, 2014, 529519. [Google Scholar] [CrossRef]
  9. Campagnoli, A.; Pinotti, L.; Tognon, G.; Cheli, F.; Baldi, A.; Dell’Orto, V. Potential application of electronic nose in processed animal proteins (PAP) detection in feedstuffs. Biotech. Agron. Soc. Environ. 2004, 8, 253–255. [Google Scholar]
  10. Turner, L.B.; Cairns, A.J.; Armstead, P.; Ashton, J.; SkØt, K.; Whittaker, D.; Humphreys, M.O. Dissecting the regulation of fructan metabolism in perennial ryegrass (Lolium perenne) with quantitative trait locus mapping. New Phytol. 2006, 169, 45–58. [Google Scholar] [CrossRef]
  11. Baldinger, L.; Baumung, R.; Zollitsch, W.; Knaus, W.F. Italian ryegrass silage in winter feeding of organic dairy cows: Forage intake, milk yield and composition. J. Sci. Food Agric. 2011, 91, 435–442. [Google Scholar] [CrossRef]
  12. Baldinger, L.; Zollitsch, W.; Knaus, W.F. Maize silage and Italian ryegrass silage as high energy forages in organic dairy cow diets: Differences in feed intake, milk yield and quality, and nitrogen efficiency. Ren. Agri. Food Syst. 2014, 29, 378–387. [Google Scholar] [CrossRef]
  13. Lehel, L.; Orosz, S.; Tóthné, P.A.; Sümeghy, L.; Hajda, Z.; Sipiczki, B.; Várhegyi, J.; Fébel, H. The rye grass silage apparent digestibility, rumen protein degradability, content of metabolizable protein and net energy. AWETH 2011, 7, 149–157. [Google Scholar]
  14. World Weather Online. Kaposvar Monthly Climate Average. 2018. Available online: https://www.worldweatheronline.com/kaposvar-weather-averages/somogy/hu.aspx (accessed on 25 July 2018).
  15. BBCH (Biologische Bundesanstallt für Land-und Forstwirtschaft). Growth Stages of Mono-and Dicotyledonous Plants: BBCH Monograph; Blackwell Wissenschafts-Verlag: Berlin, Germany, 1997. [Google Scholar]
  16. AOAC (Association of Official Analytical Chemist). Official Methods of Analysis, 18th ed.; AOAC International: Washington, DC, USA, 2006. [Google Scholar]
  17. Van Soest, P.J.; Robertson, J.B.; Lewis, B.A. Methods for dietary fiber, neutral detergent fiber, and non-starch polysaccharides in relation to animal nutrition. J. Dairy Sci. 1991, 74, 3583–3597. [Google Scholar] [CrossRef]
  18. Megias, M.D.; Martinez, A.; Teruela, A.; Gallego, J.A.; Nuñez, J.M. Chemical changes during the ensiling of orange peel. Anim. Feed Sci. Tech. 1993, 43, 269–274. [Google Scholar] [CrossRef]
  19. Playne, M.J. Determination of ethanol, volatile fatty acids, lactic and succinic acids in fermentation liquids by gas chromatography. J. Sci. Food Agri. 1985, 36, 638–644. [Google Scholar] [CrossRef]
  20. Chaney, A.L.; Marbach, E.P. Modified reagents for determination of urea and ammonia. Clin. Chem. 1962, 8, 130–132. [Google Scholar] [CrossRef]
  21. IOS (International Organization for Standardization). Microbiology of the Food Chain—Horizontal Method for the Enumeration of Microorganisms—Part 1: Colony Count at 30 °C by the Pour Plate Technique; International Standard ISO 4833-1; ISO: Geneva, Switzerland, 2013. [Google Scholar]
  22. IOS (International Organization for Standardization). Microbiology of Food and Animal Feeding Stuffs—Horizontal Method for the Enumeration of Yeasts and Mold—Part 1: Colony Count Technique in Products with Water Activity Greater than 0.95; International Standard ISO 21527-1; ISO: Geneva, Switzerland, 2008. [Google Scholar]
  23. Pitt, J.I.; Hocking, A.D. Fungi and Food Spoilage, 3rd ed.; Blackie Academic and Professional: London, UK, 2009. [Google Scholar]
  24. SAS (Statistical analysis system). SAS Inc. SAS® User’s Guide: Statistics; Version 9.1; SAS Inc.: Cary, NC, USA, 2013. [Google Scholar]
  25. Kovacs, Z.; Zsanett, B.; John-Lewis, Z.Z.; Timea, K.; George, B.; Tamás, T.; Csilla, M. Electronic nose for monitoring odor changes of Lactobacillus species during milk fermentation and rapid selection of probiotic candidates. Foods 2020, 9, 1539. [Google Scholar] [CrossRef] [PubMed]
  26. Naes, T.; Isaksson, T.; Feran, T.; Davies, T. A User-Friendly Guide to Multivariate Calibration and Classification; NIR Publication: Chichester, UK, 2002. [Google Scholar] [CrossRef]
  27. McDonald, P.; Henderson, A.R.; Heron, S.J.E. The Biochemistry of Silage, 2nd ed.; Chalcombe Publications: Marlow, UK, 1991. [Google Scholar]
  28. Kung, L.; Shaver, R. Interpretation and Use of Silage Fermentation Analysis Reports. Focus Forage 2001, 3, 13. Available online: https://fyi.extension.wisc.edu/forage/files/2014/01/Fermentation.pdf (accessed on 7 August 2001).
  29. Kung, L., Jr.; Stanley, R.W. Effect of stage of maturity on the nutritive value of whole plant sugarcane preserved as silage. J. Anim. Sci. 1982, 54, 689–696. [Google Scholar] [CrossRef]
  30. Daniel, J.L.P.; Weiss, K.; Custodio, L.; Sa Neto, A.; Santos, M.C.; Zopollatto, M.; Nussio, L.G. Occurrence of volatile organic compounds in sugarcane silages. Ani. Feed Sci. Tech. 2013, 185, 101–105. [Google Scholar] [CrossRef]
  31. GMP (Good Manufacturing Practise). GMP+ Certification Scheme Animal Feed Sector 2006. Production of and Trade in Pet Foods. GMP+ Standard B8. 2008. Available online: http://www.bezpecna-krmiva.cz/soubory/gmp%20standard%2008%20EN.pdf (accessed on 25 November 2008).
  32. González, M.L.; Alonso, V.A.; Sager, R.; Morlaco, M.B.; Magnoli, C.E.; Astoreca, A.L.; Rosa, C.A.R.; Chiacchiera, S.M.; Dalcero, A.M.; Cavaglieri, L.R. Fungi and selected mycotoxins from pre-and post- fermented corn silage. J. Ap. Micro. 2008, 104, 1034–1041. [Google Scholar] [CrossRef]
  33. Huhtanen, P.; Khalili, H.; Nousiainen, J.I.; Rinne, M.; Jaakkola, S.; Heikkila, T.; Nousiainen, J. Prediction of the relative intake potential of grass silage by dairy cows. Liv. Prod. Sci. 2002, 73, 111–130. [Google Scholar] [CrossRef]
  34. Muck, R.E. Factors influencing silage quality and their implications for management. J. Dairy Sci. 1998, 71, 2992–3002. [Google Scholar] [CrossRef]
  35. Mo, M.; Selmer-Olsen, I.; Randby, Å.T.; Aakre, S.E.; Asmyhr, A. “New” Fermentation Products in Grass Silage and Their Effects on Feed Intake and Milk Taste. In Proceedings of the 10th International Symposium on Forage Conservation, Brno, Czech Republic, 10–12 September 2001; pp. 98–99. [Google Scholar]
  36. Kristensen, N.B.; Sloth, K.H.; Højberg, O.; Spliid, N.H.; Jensen, C.; Thøgersen, R. Effects of microbial inoculants on corn silage fermentation, microbial contents, aerobic stability, and milk production under field conditions. J. Dairy Sci. 2010, 93, 3764–3774. [Google Scholar] [CrossRef] [PubMed] [Green Version]
  37. Krizsan, S.J.; Westad, F.; Ådnøy, T.; Odden, E.; Aakre, S.E.; Randby, Å.T. Effect of volatile compounds in grass silage on voluntary intake by growing cattle. Animals 2007, 1, 283–292. [Google Scholar] [CrossRef] [Green Version]
  38. Figueiredo, R.; Rodrigues, A.I.; do Céu Costa, M. Volatile composition of red clover (Trifolium pratense L.) forages in Portugal: The influence of ripening stage and ensilage. Food Chem. 2007, 104, 1445–1453. [Google Scholar] [CrossRef]
  39. Arena, E.; Guarrera, N.; Campisi, S.; Nicolosi, A.C. Comparison of odour active compounds detected by gas-chromatography- olfactometry between hand-squeezed juices from different orange varieties. Food Chem. 2005, 98, 59–63. [Google Scholar] [CrossRef]
  40. Morgan, M.E.; Pereira, R.L. Volatile Constituents of Grass and Corn Silage. I. Steam Distillates. J. Dairy Sci. 1962, 45, 457–466. [Google Scholar] [CrossRef]
  41. Cometto-Muñiz, J.E.; Cain, W.S. Efficacy of volatile organic compounds in evoking nasal pungency and odor. Arch. Environ. Heal. 1993, 48, 309–314. [Google Scholar] [CrossRef] [Green Version]
Figure 1. Bar graphs of the intensities measured with the electronic nose at the retention indices (RI) corresponding to lactic acid, acetic acid and ethanol for the ensiled mixtures at day 90, with the indication of mixture type (A, B, C, D), GC column type (#1: Restek MXT-5; #2: Restek MXT-1701), retention indices and respective chemicals. (a) showing intensity values corresponding to ethanol; (b) as a zoomed image of (a) to overcome magnitude differences showing intensity corresponding to acetic acid and lactic acid.
Agriculture 11 00512 g001
Figure 2. PCA score plot of the aroma profile of all (4) mixtures (mixture A, B, C and D) measured on all (4) days (Day 0, 7, 14, 90). mixture A: 40% of two cultivars of winter triticale + 30% of two cultivars of winter oats + 20% of winter barley + 10% of winter wheat; mixture B: 50% of two cultivars of winter triticale + 40% of winter barley + 10% of winter wheat; mixture C: 55% of three types of Italian ryegrass + 45% of two cultivars of winter oat; mixture D: 40% of three types of Italian ryegrass + 30% of two cultivars of winter oat + 15% of two cultivars of winter triticale + 10% of winter barley + 5% of winter wheat.
Agriculture 11 00512 g002
Figure 3. PCA score plots calculated from the aroma profiles of mixture A (a), mixture B (b), mixture C (c) and mixture D (d), indicating the fermentation days (Days 0, 7, 14, 90) within each plot.
Agriculture 11 00512 g003
Figure 4. LDA classifications of the fermentation stages (Day 0, 7, 14, 90) within the different silage mixtures: (a) mixture A; (c) mixture B; (e) mixture C; (g) mixture D, and the loading plots (b,d,f,h) showing the impact of the selected dominant sensors on the relevant discriminant factors.
Agriculture 11 00512 g004
Figure 5. PCA score plots calculated from the aroma profiles of the silages at different fermentation stages (a): Day 0; (b): Day 7; (c): Day 14; (d): Day 90, indicating the type of mixture (mixture A, B, C and D) within each plot.
Agriculture 11 00512 g005
Figure 6. List discriminant analysis (LDA) classifications of the types of silages (mixture A, B, C and D) at the different fermentation stages (a): Day 0; (c): Day 7; (e): Day 14; (g): Day 90, and the loading plots (b,d,f,h) showing the impact of the selected dominant sensors on the relevant discriminant factors.
Agriculture 11 00512 g006
Table 1. Chemical compositions of fresh forage mixtures right before ensiling (n = 20).
ComponentsMixture AMixture BMixture CMixture D
Dry matter (g)186184168173
Crude protein (g/kg DM)12511710895
Neutral detergent fiber (g/kg DM)566579535532
Total sugar (g/kg DM)168166168140
Mixture A: 40% of two cultivars of winter triticale + 30% of two cultivars of winter oats + 20% of winter barley + 10% of winter wheat; mixture B: 50% of two cultivars of winter triticale + 40% of winter barley + 10% of winter wheat; mixture C: 55% of three types of Italian ryegrass + 45% of two cultivars of winter oat; mixture D: 40% of three types of Italian ryegrass + 30% of two cultivars of winter oat + 15% of two cultivars of winter triticale + 10% of winter barley + 5% of winter wheat.
Table 2. Chemical compositions of ensiled mixtures at the end of 90 days fermentation (n = 20).
Components (%DM)Mixture AMixture BMixture CMixture DSEMp Value
DM (%)33.06 a30.32 b33.94 a32.38 ab1.199<0.01
CP11.70 a9.36 b11.18 b12.56 a0.935<0.001
EE2.96 b3.56 a2.78 b3.74 a0.201<0.001
CF35.10 a30.32 b34.20 a34.10 a1.434<0.001
NDF66.66 a57.54 b61.14 ab61.92 ab3.313<0.01
ADF38.1633.1836.7834.483.817ns
TS13.30 a5.28 c6.18 c10.28 b1.479<0.001
Mixture A: 40% of two cultivars of winter triticale + 30% of two cultivars of winter oats + 20% of winter barley + 10% of winter wheat; mixture B: 50% of two cultivars of winter triticale + 40% of winter barley + 10% of winter wheat; mixture C: 55% of three types of Italian ryegrass + 45% of two cultivars of winter oat; mixture D: 40% of three types of Italian ryegrass + 30% of two cultivars of winter oat + 15% of two cultivars of winter triticale + 10% of winter barley + 5% of winter wheat. DM: dry matter; CP: crude protein; EE: ether extract; CF: crude fiber; NDF: neutral detergent fiber; ADF: acid detergent fiber; TS: total sugar. a–c Differences of means within a row with different superscripts are significant (p < 0.05). SEM—Standard error of the mean. ns = not significant (p > 0.05)
Table 3. Fermentation characteristics of ensiled mixtures at the end of 90 days fermentation (n = 20).
ComponentsMixture AMixture BMixture CMixture DSEMp Value
pH5.03 b4.47 c5.04 b5.30 a0.085<0.001
Ethanol (%DM)3.542.170.834.772.171ns
AA (%DM)0.42 b0.70 a0.73 a0.41 b0.213<0.05
LA (%DM)4.35 ab5.32 a3.44 b4.08 ab0.734<0.05
TFA (%DM)4.97 b7.23 a4.20 b4.59 b0.817<0.001
LA/AA10.39 a8.00 ab5.80 b10.27 a2.490<0.05
LA (%TFA)87.46 a74.28 b82.74 a88.54 a4.372<0.001
NH3–N (g/100 g tot. N)3.995.354.224.420.751ns
Mixture A: 40% of two cultivars of winter triticale + 30% of two cultivars of winter oats + 20% of winter barley + 10% of winter wheat; mixture B: 50% of two cultivars of winter triticale + 40% of winter barley + 10% of winter wheat; mixture C: 55% of three types of Italian ryegrass + 45% of two cultivars of winter oat; mixture D: 40% of three types of Italian ryegrass + 30% of two cultivars of winter oat + 15% of two cultivars of winter triticale + 10% of winter barley + 5% of winter wheat. DM: dry matter; AA: acetic acid; LA: lactic acid; TFA: total fermentation acids; SEM: standard error of mean. a–c Differences of means within a row with different superscripts are significant (p < 0.05). ns = not significant (p > 0.05).
Table 4. Bacterial and mold and yeast count (Log10 CFU g−1) of ensiled mixtures at the end of 90 days fermentation (n = 20).
ComponentsMixture AMixture BMixture CMixture DSEMp Value
Aerobic mesophilic bacterial count (AMC) (Log10 CFU g−1) (1)7.22 b7.29 b8.73 a7.44 b0.601<0.01
Mold and yeast count
(Log10 CFU g−1) (1)
6.73 ab4.53 b7.27 a5.03 ab1.414<0.05
Mixture A: 40% of two cultivars of winter triticale + 30% of two cultivars of winter oats + 20% of winter barley + 10% of winter wheat; mixture B: 50% of two cultivars of winter triticale + 40% of winter barley + 10% of winter wheat; mixture C: 55% of three types of Italian ryegrass + 45% of two cultivars of winter oat; mixture D: 40% of three types of Italian ryegrass + 30% of two cultivars of winter oat + 15% of two cultivars of winter triticale + 10% of winter barley + 5% of winter wheat. SEM: standard error of mean; CFU: colony forming unit. a,b Differences of means within a row with different superscripts are significant (p < 0.05); (1) Counting at silo opening.
Table 5. Identification of the possible chemical components responsible for the signals at the retention indices appeared in the various classification approaches.
Retention IndexColumnAppearance (in Classification of)1st Identified Volatile Compound2nd Identified Volatile Compound3rd Identified Volatile Compound4th Identified Volatile Compound
4891ADay 7diethyl ether2-methyl-2-propanol2-methyl-1-butene3-chloropropene
6001Amixture D, Day 7Hexanedi-isopropyl ether2-butanol2-methylfuran
6581ADay 0, Day 14methylbutanone1,1-dicholopropene2-methylbutanaltert-amylmethylether
7111Amixture Cethylene glycolpropyl acetateAcetoinBenyotrifluoride
7251Amixture B, mixture Cdiethoxy-1,1-ethane2,2,3-trimethylpentane3-methyl-3-buten-1-ol3-penten-2-one
7361Amixture AThiazole3-methyl-1-butanol4-methyl-2-pentanonePyrazine
7481Amixture Apropionic acidethanedioic aciddimethyl disulfideisopropyl propanoate
8011ADay 7, Day 142-hexanolHexanal3-hexanolOctane
8581Amixture C2,3-dimethylheptane1,3-propanedithiol3-methylbutanoic acidmethylthio-2-propanone
9601ADay 90ethyl 3-methylpentanoateisopropyl 2-methylbutanoate2-heptanal1-ethyl-3-methylbenzene
9911ADay 0butyl butanoateethyl hexanoatehexanoic acidTrimethylpyrazine
10461Amixture C, Day 0limoneneBenzeneacetaldehydeCineole2-methyl-phenol
11891ADay 90methylacetophenoneocatnoic acidethyl octanoate
4922Amixture B, mixture Dlactic acid
5062ADay 7, Day 14acetaldehyde
5412ADay 90ethanol
6002Amixture A, mixture Bformic acid2-propanolPropanal2-methylpropanal
6392Amixture D2-methylpropanalButanal
6702Amixture Dbutanalethyl acetatebutane2-onebutane-2,3-dione
6982Amixture Abutan-2-onebutane-2,3-dione
7442Amixture B, Day 72-methyl-1-propanol3-methylbutanalethyl propanoateisopropyl acetate
8692ADay 14propyl propanoateethyl butyratebutyl acetatepropionic acid
9512ADay 90pireneisoamyl acetatePropyleneglycol
10702Amixture Cisovaleric acidbutyl butanoateCymenelimonene
11012Amixture Coctanaltrimethylpyrazinealpha-terpinene
12062ADay 90acetophenonenonanalethyl-3-methylthiopropanoate
13662ADay 0ethylnonanoateethylphenylacetateCitronellolphenylethyl acetate
15552ADay 0pentyl octanoatemethyl cinnamateIndoleeugenol
1A: Column #1 Restek MXT-5; 2A: Column #2 Restek MXT-170.
Publisher’s Note: MDPI stays neutral with regard to jurisdictional claims in published maps and institutional affiliations.

