Article

Barley Varieties Stoneham and Sydney Exhibit Mild Antibiosis and Antixenosis Resistance to the Wheat Curl Mite, Aceria tosichella (Keifer)

by
Lina Maria Aguirre-Rojas
1,*,
Luaay Kahtan Khalaf
1,2 and
Charles Michael Smith
1
1
Department of Entomology, Kansas State University, Manhattan, KS 66506, USA
2
Department of Plant Protection, College of Agriculture, University of Baghdad, Al-Jadriyah, Baghdad 10059, Iraq
*
Author to whom correspondence should be addressed.
Agronomy 2019, 9(11), 748; https://doi.org/10.3390/agronomy9110748
Submission received: 3 October 2019 / Revised: 4 November 2019 / Accepted: 8 November 2019 / Published: 12 November 2019
(This article belongs to the Special Issue Genetic Diversity of Disease Resistance in Crops)

Abstract

:
The wheat curl mite, Aceria tosichella (Keifer), devastates cereal crops worldwide by direct feeding damage and transmission of several deadly viruses. Deployment of cereal crop varieties resistant to A. tosichella is key for reduction of crop yield losses, and management of this mite and associated viruses that it transmits. Barley varieties resistant to A. tosichella are not known to exist. The objectives of this study were to determine if A. tosichella resistance exists in the barley varieties Sydney and Stoneham, which are resistant to the Russian wheat aphid, Diuraphis noxia (Kurjumov), and, further, to determine which categories mediate the resistance. Categories of resistance to both A. tosichella biotypes were evaluated independently in non-choice and choice experiments using wheat varieties Ike and OK05312 as susceptible and resistant controls, respectively. Sydney barley displays mild antixenosis and antibiosis resistance to A. tosichella biotype 1 and 2, respectively. Stoneham barley exhibits only mild antibiosis to biotype 2. No evidence for plant tolerance was found in either barley variety to either mite biotype.

1. Introduction

The wheat curl mite, Aceria tosichella Keifer, is the most important eriophyid pest of cereals in the world [1,2]. Foliage damage, head trapping, and transmission and spreading of devastating viruses are the most significant economic impacts of this mite on cereals [3]. Although A. tosichella is widely recognized as a pest on wheat (Triticum aestivum L.) [3], it is also a significant problem on barley (Hordeum vulgare L.) due to the transmission of Wheat streak mosaic virus (Potyviridae: Tritimovirus, [WSMV]) [4]. WSMV-infected mites can successfully transmit WSMV to barley at rates ranging from 32 to 88%, and mechanical infection results in barley yield losses ranging from 25 to 40% [4,5]. Although estimates of barley yield losses due to mite damage and virus transmission are unavailable, mite feeding alone can reduce U.S. wheat yields by 9 to 30% [6] and can impair head development when mite densities quickly increase during head emergence [7].
The wheat curl mite exists as a complex of closely related species in Australia, Europe, North America and South America [8,9,10]. Two biotypes of A. tosichella that co-occur in North America exhibit different virulence responses to Cmc wheat mite-resistant genes and genetic variability [9,11]. Although A. tosichella biotype composition and distribution in U.S. barley production areas has yet to be determined, biotypes 1 (MT-8) and 2 (MT-1) collected from barley in Poland’s agrarian landscape occurred at mean densities of 9.7 and 19.3 mites per shoot, respectively [12]. Furthermore, the Polish biotype 2 collected from wheat and reared on susceptible barley plants exhibited a >40-fold increase in population growth rate in 14 days [10], providing evidence that this biotype has the ability to use barley as a host.
Volunteer wheat and barley serve as powerful reservoirs of mite and viruses between harvest and planting of the next crop [5], and often contribute to mite and WSMV outbreaks [7,13]. These outbreaks are expected to intensify and increase in frequency as warmer autumn temperatures sustain volunteer wheat and barley much longer than normal after harvests in the U.S. Northern Great Plains and Pacific Northwest cereal production areas [14].
Host plant resistance to A. tosichella and summer control of volunteer wheat are key components in the integrated pest management of this pest and associated viruses [2,15]. Reduced mite populations and virus transmission are valuable benefits resulting from A. tosichella-resistant wheat genotypes [16,17]. Although wheat cultivars resistant to A. tosichella have been successfully developed for more than 30 years [18,19,20], A. tosichella-resistant barley remains unknown and unavailable to barley producers. Since Diuraphis noxia (Kurjumov)-resistant wheat varieties containing the Dn7 gene show antibiosis resistance to A. tosichella [21], we hypothesized that D. noxia-resistant barley genotypes, Sydney and Stoneham, may also exhibit A. tosichella resistance. D. noxia-resistance is controlled in Sydney by recessive epistasis of a dominant gene, Rdn2, on an incompletely dominant gene, Rdn1 [22,23,24], whereas resistance in Stoneham is controlled by two dominant genes, Rdn1 and Rdn2*, with epistasis [25,26]. The objectives of this study were to determine if the barley varieties Sydney and Stoneham are resistant to both A. tosichella biotypes, and to evaluate the categories of resistance to each biotype.
There are three categories of plant resistance to arthropods: antibiosis, antixenosis, and tolerance [27]. Antibiosis refers to adverse effects of a resistant plant on the survival, development, or fecundity of an arthropod and their population [28]; antixenosis or non-preference refers to the reaction of an arthropod to accept or reject a plant as host [28,29]; and tolerance refers to the ability of a plant to withstand or recover from arthropod damage without adversely affecting the growth or survival of the attacking arthropod [28,30,31].

2. Materials and Methods

2.1. Seed Material, A. tosichella Biotypes and Environmental Conditions

Seeds of the D. noxia-resistant barley varieties Sydney and Stoneham [24,32] were provided by the Kansas State University Southwest Research Center, Tribune, KS. Seeds of barley variety Eight-twelve were provided by the Department of Bioagricultural Sciences and Pest Management at Colorado State University in Fort Collins, CO. Eight-twelve is a six-rowed winter feed barley with no arthropod resistance and was released by the U.S. Department of Agriculture—Agricultural Research Services (USDA-ARS) and the Idaho Agricultural Experiment Station in 1991 [33]. Seeds of the A. toschiella resistant wheat variety OK05312, containing the Cmc4 mite resistance gene, and the A. toschiella susceptible wheat variety Ike were provided by the Kansas Crop Improvement Association, Manhattan, KS.
A. tosichella biotype 1 and 2 were obtained from colonies mass-reared in 45 cm × 45 cm × 75 cm cages (BioQuip, Rancho Dominguez, CA, USA) covered with 36 µm mite-proof mesh screen (ELKO Filtering Co., Zurich, Switzerland) in separate greenhouses (24 °C, 14 h L:10 h D) at Kansas State University, Manhattan, KS. Each biotype was reared independently on Eight-twelve barley plants for more than 10 generations. The identity of each A. tosichella biotype was verified by DNA sequencing with an ITS1 marker [34]. Experiments were conducted in a growth chamber at 24 °C and 14 h:10 h (L:D) (Percival Scientific, Perry, IA, USA) at the Kansas State University Department of Entomology, in Manhattan, KS, from July to December 2018.

2.2. Non-Choice Experiments

Sydney, Stoneham, and Eight-Twelve barley plants were assessed for antibiosis and tolerance resistance to A. tosichella biotypes 1 and 2, in comparison to the wheat susceptible control Ike and the resistant control OK05312. Plants were infested with each biotype in separate, independent experiments. Three seeds per variety were planted in individual cylindrical pots (10 cm diameter × 8.9 cm tall) containing Metro-Mix 360 soil (Sungro Horticulture, Agawam, MA, USA) to guarantee at least one plant per pot. Only one seedling was used in the experiment if multiple plants germinated per pot. For each variety, eight pairs of equal-sized two-leaf stage plants were selected 10 days after planting [16,18,21,35,36,
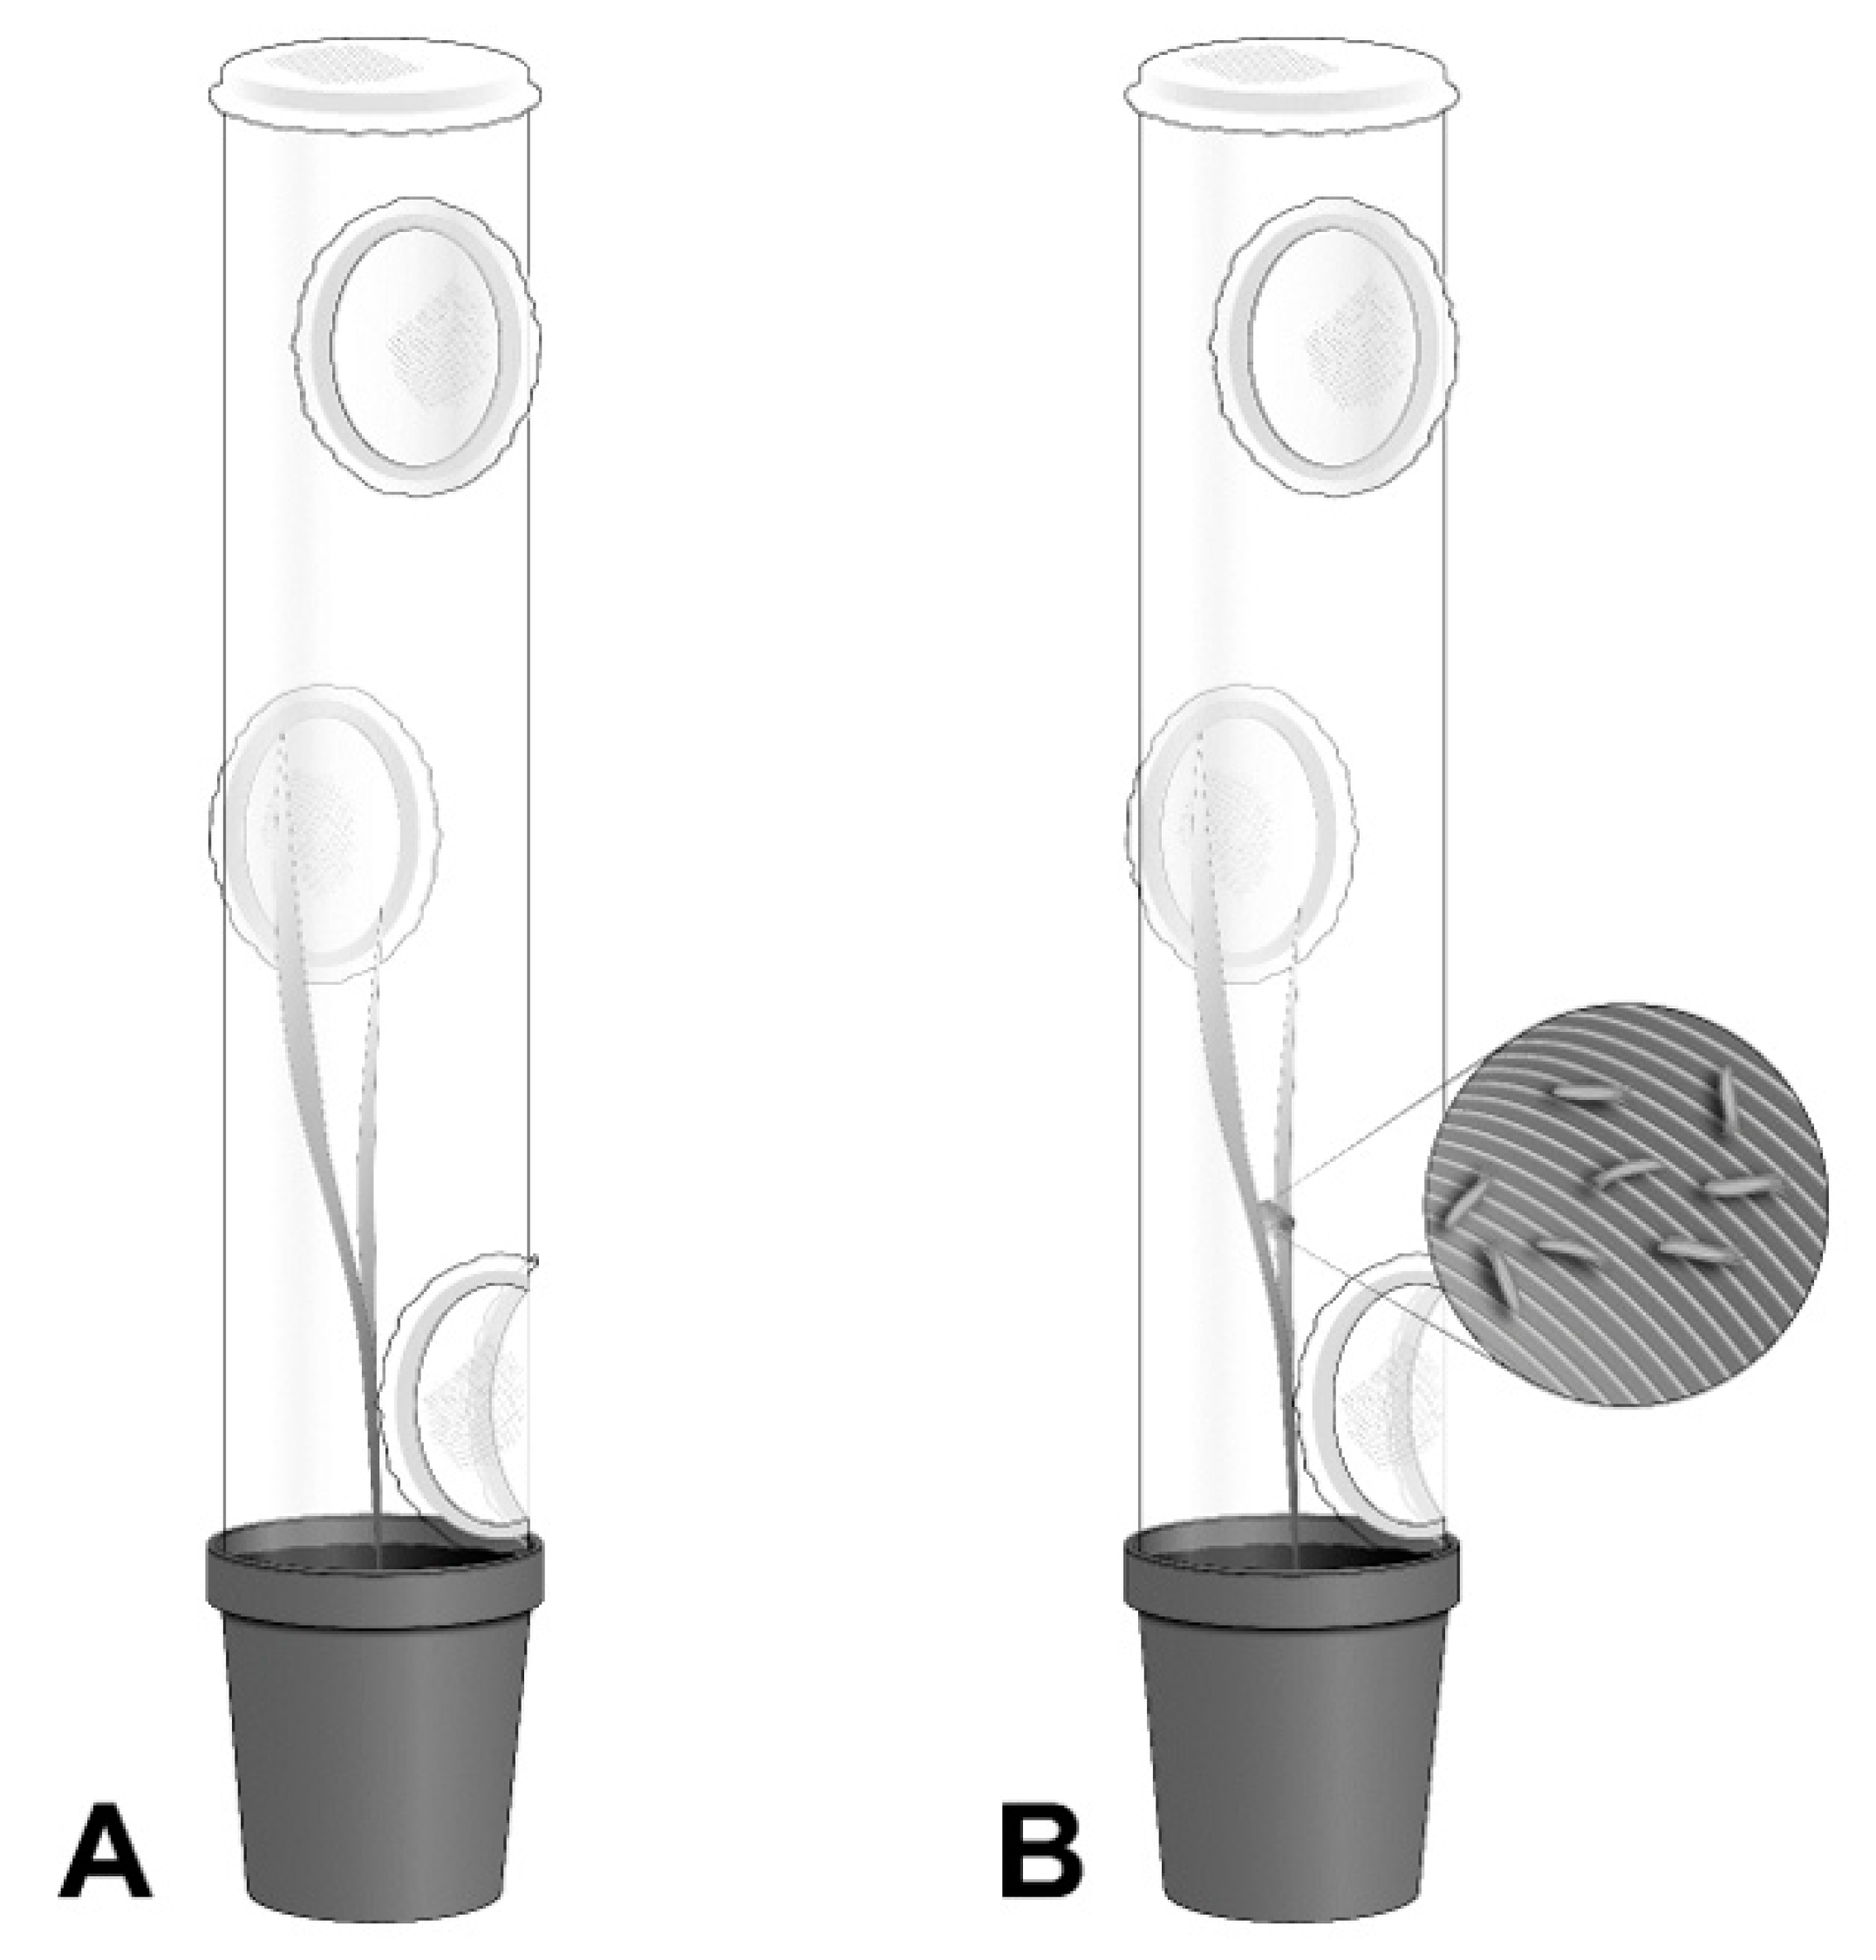
37], and, in each pair, one plant served as a non-infested control and the other infested with a piece of leaf containing 30 A. tosichella adults (Figure 1), counted with a stereoscope (Nikon SMZ645, Tokyo, Japan).
Individual plants were caged with a plastic tube (8.5 cm diameter × 51 cm tall) to prevent movement of mites to and from adjacent plants. Each cage had three side (5 cm diameter) and one top (8.5 cm diameter) openings that were covered with a mite-proof mesh (36 µm) and allowed reduction of humidity inside the cage. Each cage was depressed into the pot soil to hold it in place (Figure 1). Pots were arranged in a randomized complete block design in the growth chamber where each shelf (block) contained four pairs of plants per variety.
Barley varieties were evaluated for antibiosis and tolerance resistance to each A. tosichella biotype at 14 days post-infestation. The presence of mite-induced folded leaves in each plant and the height of each plant were recorded before cutting plant stems at soil level. Non-infested plants were placed in individual pre-weighted aluminum pouches and dried at 60 °C for 10 days (Precision, ThermoFisher Scientific, Waltham, MA, USA). Infested plants were placed on two gridded 3.9 cm × 7.5 cm paper cards coated with adhesive to collect mites as leaves dried at room temperature [35]. Each trap was stored inside an uncapped 50-mL centrifuge tube for seven days. Dried leaves were removed, placed in a pre-weighed aluminum pouch per plant, and dried for an additional 3 days at 60 °C.
Trapped mites were counted using a stereoscope. Plant dry weights were measured with an XS-310D analytical balance with 1-mg sensitivity (Denver Instrument, Bohemia, NY, USA) and used to estimate proportional plant dry weight change (DWT) and plant tolerance index (TI) (Reese et al. 1994). DWT and TI were calculated as DWT = [(U − I)/U] × 100 and TI = [DWT/WCM], where U is the weight of the non-infested plant in each variety pair, I is the weight of the infested plant in each variety pair, and WCM is the total number of mites counted on the infested plant. Numbers of mites per plant were used to evaluate antibiosis. Percent of folded-leaf plants, proportional plant height change, proportional plant dry weight change, and TI were used to assess plant tolerance.

2.3. Choice Experiments

The three barley varieties and two wheat controls were evaluated for antixenosis resistance to each A. tosichella biotype using the circular plant-arrangement method by Carrera et al. 2012. In brief, one seed of each variety was planted around the periphery of a 5.5 cm diameter circle (~3.5 cm space between seeds) in a pot (10 cm diameter × 8.9 cm tall) containing Metro-Mix 360 soil. To provide a support for mites to infest plants, a 4.5 cm diameter blue germination paper disc was glued to the open end of a 4.5 cm diameter × 4 cm tall plastic cup. When seedlings were at the two-leaf stage, a plastic cup support was inverted and placed inside each circle of five test plants, and five 0.5 mm long leaf pieces, each containing 30 A. tosichella adults (total of 150 adults) were placed on the germination paper disc. Stems of the five plants touched the paper containing mites by leaning them towards the cup with a string noose but keeping a space between each plant. Each pot was caged using a plastic tube (8.5 cm diameter × 51 cm tall), previously described in the non-choice experiment section. A separate, independent experiment was conducted for each A. tosichella biotype and arranged in a completely randomized block design with 10 replications, where pots were the blocking factor. At seven days post-infestation, plants were cut at the soil level, and leaves from each plant were placed on two paper cards coated with adhesive to collect mites as each plant dried at room temperature in uncapped 50-mL centrifuge tubes for seven days. Plant dried leaves were then removed from tubes and the antixenosis response was determined by counting the numbers of mites per plant.

2.4. Statistical Analyses

2.4.1. Non-Choice Experiments

Proportional plant height change and proportional plant dry weight change data followed assumptions of normality and homogeneity of variances based on the distribution of residuals, and the Kolmogorov–Smirnov [38], Levene [39], and Brown and Forsythe [40] tests. These data were analyzed using a normal distribution and PROC GLIMMIX procedure [41] (SAS v.9.2, Cary, NC, USA) where plant variety and block were considered a fixed and random effect, respectively. Mite counts and tolerance index data did not follow the assumptions previously mentioned and were analyzed using a negative binomial with a log-link function after verification of control of overdispersion with a Pearson’s Chi-square/DF test [42]. Degrees of freedom were estimated using the Kenward–Rogers method [43] when data failed to follow assumptions of normality and homogeneity of variances. When the F-test for type III effects was significant at P < 0.05, pairwise comparisons were conducted using a Tukey–Kramer test with a 0.05 significance level [44]. The percentage of folded-leaf plants were analyzed using Pearson’s chi-square test (PROC FREQ procedure, SAS v.9.2) to determine overall differences between varieties. If the Pearson’s chi-square test was significant (P < 0.05), paired comparisons between test barley varieties and the control wheat varieties were performed using Fisher’s exact test (α = 0.05) [45]. Data from each experiment with each mite biotype were analyzed independently, but each analysis followed the same standard operating procedures as previously described.

2.4.2. Choice Experiments

A. tosichella biotype 1 count data did not follow the assumptions of normality and homogeneity of variances and were analyzed using a negative binomial with a log-link function and the Kenward–Rogers method for estimation of degrees of freedom [43]. Overdispersion was assessed as mentioned above. A. tosichella biotype 2 count data were analyzed using a normal distribution since data followed the assumptions mentioned previously. The analyses were conducted using a PROC GLIMMIX procedure where plant variety and block were considered fixed and random effects, respectively. When the F-test for type III effects was significant at P < 0.05, pairwise comparisons were conducted using Tukey–Kramer test with a 0.05 significance level [44].

3. Results

3.1. Non-Choice Experiments

The numbers of A. tosichella biotype 1 and 2 occurring on tested varieties differed significantly (F4,4 = 16.15, P = 0.0098; and F4,4 = 6.40, P = 0.0498, respectively). Plants of Stoneham and Sydney contained 10.9- and 11.5-times more A. tosichella biotype 1 than the OK05312 resistant wheat control, respectively (Table 1). The numbers of biotype 1-mites on plants of the Eight-twelve susceptible barley control and the resistant and susceptible control wheat varieties did not differ significantly (Table 1). There were no significant differences in the numbers of A. tosichella biotype 2 between the barley varieties and each wheat control variety, respectively (Table 2). The numbers of A. tosichella biotype 1 and 2 did not differ significantly on the barley varieties and the susceptible Ike wheat control, respectively (Table 1 and Table 2). The susceptible wheat variety had 21.5- and 6.5-times greater numbers of A. tosichella biotype 1 and 2 than the resistant wheat variety, respectively (Table 1 and Table 2).
The percentage of plants with folded leaves differed significantly between varieties infested with A. tosichella biotype 1 and 2, respectively (χ2 = 10.6, df = 4, P = 0.03; and χ2 = 12.0, df = 4, P = 0.0175, respectively). When plants were infested with A. tosichella biotype 1, the barley variety Sydney and the susceptible Ike wheat variety had 5.2- and 6.1-times greater percentages of folded-leaf plants than the resistant OK05312 wheat variety, respectively (Table 3). There were no differences in the percentage of folded-leaf plants between Eight-twelve and Stoneham barley or the resistant OK05312 wheat control, respectively, when infested with A. tosichella biotype 1 (Table 3). Interestingly, differences in the percentage of folded-leaf plants infested with A. tosichella biotype 2 differed significantly only between Stoneham barley and the resistant OK05312 wheat control (Table 4).
Differences in mean tolerance index, mean proportional percent dry weight change and mean proportional percent plant height change between varieties were non-significant in plants infested with A. tosichella biotype 1 (F4,4 = 2.94, P = 0.1604; F4,4 = 0.45, P = 0.7707; and F4,4 = 1.66, P = 0.3173, respectively (Table 1)) or biotype 2 (F4,4 = 3.61, P = 0.1207; F4,4 = 0.41, P = 0.7958; and F4,4 = 4.9, P = 0.0765, respectively (Table 2)).

3.2. Choice Experiments

The numbers of A. tosichella biotype 1 and 2 on test varieties differed significantly (F4,38.49 = 5.23, P = 0.0018; and F4,36 = 8.97, P < 0.001, respectively). Plants of Stoneham and Eight-twelve barley contained ~7- and 4-times greater numbers of biotype 1 mites than the OK05312 resistant wheat control, respectively (Table 5). The numbers of biotype 1 mites on plants of Sydney barley and the Ike and OK05312 wheat controls did not differ significantly (Table 5). Plants of Sydney and Stoneham barley had significantly more (3.6- and 3.7-times more, respectively) numbers of biotype 2 mites than the OK05312 resistant wheat control (Table 6); however, numbers of biotype 2 mites on Eight-twelve did not differ when compared to each wheat control variety (Table 6). Similarly, the numbers of either mite biotype did not differ significantly between the Ike susceptible wheat control and each barley variety, respectively (Table 5 and Table 6). In addition, susceptible Ike plants had significantly greater numbers of biotype 1 and 2 mites (5- and 2.9-times greater, respectively) than the OK05312 resistant wheat control (Table 5 and Table 6).

4. Discussion

Sydney barley plants exhibited only mild antixenosis resistance to A. tosichella biotype 1 while Stoneham plants lacked any resistance to this biotype. Sydney and Stoneham barley displayed mild antibiosis to biotype 2. The susceptible barley control, Eight-twelve, showed mild antibiosis resistance to both mite biotypes, and mild antixenosis resistance to biotype 2 only. There was no indication of tolerance resistance in any of the barley varieties to either A. tosichella biotype. These results are substantiated by the responses of plants of the OK05312 resistant wheat control containing the Cmc4 mite resistance gene, which performed as expected, allowing only low numbers of both A. tosichella biotype 1 and 2 to develop.
Plants of D. noxia-resistant barley Sydney and Stoneham exhibited different magnitudes of antibiosis to A. tosichella relative to the antibiosis observed in the D. noxia-resistant wheat variety 94M370 containing the Dn7 resistance gene from rye, Secale cereale [21]. On average, A. tosichella biotype 1 and 2 populations on Dn7 plants were 20% and 10% of those observed on plants of the susceptible control Jagger, respectively [21]. In the current study, Sydney and Stoneham plants contained 46.3 and 49.5% of biotype 1 population, respectively, relative to those counted on the susceptible control (Table 1). While Sydney plants contained even more biotype 2 mites (63.2%), Stoneham plants only had 33.8% biotype 2 mites relative to Ike (Table 2).
One explanation of these results is the fact that the sources of Rdn1 and Rdn2 resistance used to create Stoneham and Sydney were screened for reaction to D. noxia, not A. tosichella. Additionally, the mode of inheritance of Rdn1, Rdn2, Dn7, and Cmc4 may also condition cross-resistance to A. tosichella. D. noxia-resistance in Sydney is controlled by recessive epistasis of a dominant gene, Rdn2, on an incompletely dominant gene, Rdn1 [22,23,24], whereas resistance in Stoneham is controlled by two dominant genes, Rdn1 and Rdn2*, with epistasis [25,26]. In contrast, Dn7 resistance in 94M370 and Cmc4 in OK05312 are each inherited as single dominant traits [46,47].
Another possible explanation is that cross resistance to A. tosichella may be related to the different origins of Cmc4, Rdn1, Rdn2, and Dn7. Cmc4 originated from goatgrass, Aegilops tauschii, the D genome donor of bread wheat, Triticum aestivum [47,48]. Dn7 was transferred into wheat from the long arm of rye chromosome 1 to form a 1BL/1RS translocation [49]. Finally, Rdn1 and -2 originated from barley, Hordeum vulgare [24,32]. To our knowledge, almost nothing is known about any of these four resistance genes. However, we hypothesize that different functional elements of resistance, different physiological mechanisms of resistance, and mode of inheritance of each gene condition cross resistance to A. tosichella. Further understanding of this cross resistance are beyond the scope of this study and will be subjects of future studies.
This is the first study to document antibiosis and antixenosis resistance to A. tosichella in barley. Further screening of arthropod-resistant barley germplasm [50] is needed to identify genotypes with stronger levels of A. tosichella resistance that can be used to develop mite-resistant barley varieties. The significance of A. tosichella-resistant barley not only rests on reducing mite populations and virus transmission within a season but also on controlling and/or decreasing mite survival on volunteer barley that can serve as a “green bridge” in the autumn after harvests.

Author Contributions

Conceptualization, L.M.A.-R., L.K.K. and C.M.S.; Conducted experiments, L.M.A.-R. and L.K.K.; Statistical analyses, L.M.A.-R.; and writing—review and editing, L.M.A.-R., L.K.K. and C.M.S.

Funding

This research was funded by University of Baghdad, Kansas State University Research and Extension, and the Kansas Wheat Commission.

Acknowledgments

This is contribution No. 20-063-J from the Kansas Agricultural Experiment Station.

Conflicts of Interest

The authors declare no conflict of interest.

References

  1. Slykhuis, J.T. Mite transmission of plant viruses. In Advances in Virus Research; Smith, K.M., Lauffer, M.A., Eds.; Academic Press: Cambridge, MA, USA, 1965; Volume 11, pp. 97–137. [Google Scholar]
  2. Skoracka, A.; Rector, B.G.; Hein, G.L. The interface between wheat and the wheat curl mite, Aceria tosichella, the primary vector of globally important viral diseases. Front. Plant Sci. 2018, 9, 1098. [Google Scholar] [CrossRef] [PubMed]
  3. Navia, D.; de Mendonça, R.S.; Skoracka, A.; Szydło, W.; Knihinicki, D.; Hein, G.L.; da Silva Pereira, P.R.V.; Truol, G.; Lau, D. Wheat curl mite, Aceria tosichella, and transmitted viruses: An expanding pest complex affecting cereal crops. Exp. Appl. Acarol. 2013, 59, 95–143. [Google Scholar] [CrossRef] [PubMed]
  4. Lehnhoff, E.; Miller, Z.; Menalled, F.; Ito, D.; Burrows, M. Wheat and barley susceptibility and tolerance to multiple isolates of Wheat Streak Mosaic Virus. Plant Dis. 2015, 99, 1383–1389. [Google Scholar] [CrossRef] [PubMed]
  5. Ito, D.; Miller, Z.; Menalled, F.; Moffet, M.; Burrows, M. Relative susceptibility among alternative host species prevalent in the Great Plains to Wheat Streak Mosaic Virus. Plant Dis. 2012, 96, 1185–1192. [Google Scholar] [CrossRef] [PubMed]
  6. Harvey, T.L.; Martin, T.J.; Seifers, D.L. Wheat yield reduction due to wheat curl mite (Acari: Eriophyidae) infestations. J. Agric. Urban Entomol. 2002, 19, 9–13. [Google Scholar]
  7. Gillespie, R.L.; Roberts, D.E.; Bentley, E.M. Population dynamics and dispersal of wheat curl mites (Acari: Eryophyidae) in North Central Washington. J. Kans. Entomol. Soc. 1997, 70, 361–364. [Google Scholar]
  8. Carew, M.; Schiffer, M.; Umina, P.; Weeks, A.; Hoffmann, A. Molecular markers indicate that the wheatcurl mite, Aceria tosichella Keifer, may be a species complex in Australia. Bull. Entomol. Res. 2009, 99, 479–486. [Google Scholar] [CrossRef] [PubMed]
  9. Hein, G.L.; French, R.; Siriwetwiwat, B.; Amrine, J.W. Genetic characterization of North American populations of the wheat curl mite and dry bulb mite. J. Econ. Entomol. 2012, 105, 1801–1808. [Google Scholar] [CrossRef] [PubMed]
  10. Skoracka, A.; Kuczyński, L.; Szydło, W.; Rector, B. The wheat curl mite Aceria tosichella (Acari: Eriophyoidea) is a complex of cryptic lineages with divergent host ranges: Evidence from molecular and plant bioassay data. Biol. J. Linn. Soc. 2013, 109, 165–180. [Google Scholar] [CrossRef]
  11. Malik, R.; Smith, C.M.; Brown-Guedira, G.L.; Harvey, T.L.; Gill, B.S. Assessment of Aegilops tauschii for resistance to biotypes of wheat curl mite (Acari: Eriophyidae). J. Econ. Entomol. 2003, 96, 1329–1333. [Google Scholar] [CrossRef] [PubMed]
  12. Skoracka, A.; Lewandowski, M.; Rector, B.G.; Szydło, W.; Kuczyński, L. Spatial and host-related variation in prevalence and population density of wheat curl mite (Aceria tosichella) cryptic genotypes in agricultural landscapes. PLoS ONE 2017, 12, e0169874. [Google Scholar] [CrossRef] [PubMed]
  13. Brey, C.W.; Johnson, G.D.; Blodgett, S.L. Survey of montana grasses for wheat curl mite (Acari: Eriophyidae), the vector of Wheat Streak Mosaic Virus. J. Agric. Entomol. 1998, 15, 173–181. [Google Scholar]
  14. Ranabhat, N.B.; Seipel, T.; Lehnhoff, E.A.; Miller, Z.J.; Owen, K.E.; Menalled, F.D.; Burrows, M.E. Temperature and alternative hosts influence Aceria tosichella infestation and Wheat Streak Mosaic Virus infection. Plant Dis. 2018, 102, 546–551. [Google Scholar] [CrossRef] [PubMed]
  15. Tatineni, S.; Hein, G.L. Genetics and mechanisms underlying transmission of Wheat streak mosaic virus by the wheat curl mite. Curr. Opin. Virol. 2018, 33, 47–54. [Google Scholar] [CrossRef] [PubMed]
  16. Chuang, W.-P.; Rojas, L.M.A.; Khalaf, L.K.; Zhang, G.; Fritz, A.K.; Whitfield, A.E.; Smith, C.M. Wheat genotypes with combined resistance to wheat curl mite, Wheat Streak Mosaic Virus, Wheat Mosaic Virus, and Triticum Mosaic Virus. J. Econ. Entomol. 2017, 110, 711–718. [Google Scholar] [PubMed]
  17. Khalaf, L.; Chuang, W.-P.; Aguirre-Rojas, L.; Klein, P.; Smith, C.M. Changes in virulence of North American A. tosichella populations to mite resistance genes in wheat. Arthropod. Plant Interact. 2019, 13, 807–818. [Google Scholar] [CrossRef]
  18. Carver, B.F.; Smith, C.M.; Chuang, W.-P.; Hunger, R.M.; Edwards, J.T.; Yan, L.; Brown-Guedira, G.; Gill, B.S.; Bai, G.; Bowden, R.L. Registration of OK05312, a high-yielding hard winter wheat donor of Cmc4 for wheat curl mite resistance. J. Plant Regist. 2016, 10, 75–79. [Google Scholar] [CrossRef]
  19. Martin, T.; Harvey, T.; Bender, C.G.; Seifers, S.L.; Hatchett, J.H. Wheat curl mite resistant germplasm. Crop. Sci. 1983, 23, 809. [Google Scholar] [CrossRef]
  20. Thomas, J.B.; Conner, R.L.; Graf, R.J. Radiant hard red winter wheat. Can. J. Plant Sci. 2012, 92, 169–175. [Google Scholar] [CrossRef]
  21. Aguirre-Rojas, M.L.; Khalaf, K.L.; Garcés-Carrera, S.; Sinha, K.D.; Chuang, W.-P.; Smith, M.C. Resistance to wheat curl mite in arthropod-resistant rye-wheat translocation lines. Agronomy 2017, 7, 74. [Google Scholar] [CrossRef]
  22. Mittal, S.; Dahleen, L.S.; Mornhinweg, D. Locations of quantitative trait loci conferring Russian wheat aphid resistance in barley germplasm STARS-9301B. Crop. Sci. 2008, 48, 1452–1458. [Google Scholar] [CrossRef]
  23. Mornhinweg, D.H.; Porter, D.R.; Webster, J.A. Inheritance of Russian wheat aphid resistance in spring barley. Crop. Sci. 1995, 35, 1368–1371. [Google Scholar] [CrossRef]
  24. Mornhinweg, D.W.; Bregitzer, P.P.; Porter, D.R.; Peairs, F.B.; Baltensperger, D.D.; Hein, G.L.; Randolph, T.A.; Koch, M.; Walker, T. Registration of ‘Sidney’ spring feed barley resistant to Russian wheat aphid. J. Plant Regist. 2009, 3, 214–218. [Google Scholar] [CrossRef]
  25. Mittal, S.; Dahleen, L.S.; Mornhinweg, D. Barley germplasm STARS-9577B lacks a Russian wheat aphid resistance allele at a quantitative trait locus present in STARS-9301B. Crop. Sci. 2009, 49, 1999–2004. [Google Scholar] [CrossRef]
  26. Mornhinweg, D.W.; Porter, D.R.; Webster, J.A. Inheritance of Russian wheat aphid resistance in spring barley germplasm line STARS-9577B. Crop. Sci. 2002, 42, 1891–1893. [Google Scholar] [CrossRef]
  27. Painter, R.H. The mechanisms of resistance. In Insect Resistance in Crop Plants; The MacMillan Co.: New York, NY, USA, 1951; pp. 23–83. [Google Scholar]
  28. Smith, C.M.; Clement, S.L. Molecular bases of plant resistance to arthropods. Annu. Rev. Entomol. 2011, 57, 309–328. [Google Scholar] [CrossRef] [PubMed]
  29. Khan, Z.R.; Saxena, R.C. Technique for locating planthopper (Homoptera: Delphacidae) and leafhopper (Homoptera: Cicadellidae) eggs in rice plants. J. Econ. Entomol. 1986, 79, 271–273. [Google Scholar] [CrossRef] [Green Version]
  30. Reese, J.C.; Schwenke, J.R.; Lamont, P.S.; Zehr, D. Importance and quantification of plant tolerance in crop pest management programs for aphids: Greenbug resistance in sorghum. J. Agric. Entomol. 1994, 11, 255–270. [Google Scholar]
  31. Peterson, R.K.D.; Varella, A.C.; Higley, L.G. Tolerance: The forgotten child of plant resistance. PeerJ 2017, 5, e3934. [Google Scholar] [CrossRef] [PubMed]
  32. Mornhinweg, D.W.; Bregitzer, P.P.; Porter, D.R.; Peairs, F.B.; Baltensperger, D.D.; Hein, G.L.; Randolph, T.A.; Koch, M.; Walker, T. Registration of ‘Stoneham’ spring feed barley resistant to Russian wheat aphid. J. Plant Regist. 2012, 6, 1–5. [Google Scholar] [CrossRef]
  33. Wesenberg, D.; Burrup, D.; Kolding, M.; Brown, B.; Burnett, C.R. Registration of “Eight-Twelve” barley. Crop. Sci. 1992, 32, 828. [Google Scholar] [CrossRef]
  34. Malik, R. Molecular Genetic Characterization of Wheat Curl Mite, Aceria Tosichella Keifer (Acari: Eriophyidae), and Wheat Genes Conferring Wheat Curl Mite Resistance. Ph.D. Thesis, Kansas State University, Manhattan, KS, USA, 2001. [Google Scholar]
  35. Carrera, S.G.; Davis, H.; Aguirre–Rojas, L.; Murugan, M.; Smith, C.M. Multiple categories of resistance to wheat curl mite (Acari: Eriophyidae) expressed in accessions of Aegilops tauschii. J. Econ. Entomol. 2012, 105, 2180–2186. [Google Scholar] [CrossRef] [PubMed] [Green Version]
  36. Murugan, M.; Cardona, P.S.; Duraimurugan, P.; Whitfield, A.E.; Schneweis, D.; Smith, C.M. Wheat curl mite resistance: Interactions of mite feeding with Wheat Streak Mosaic Virus infection. J. Econ. Entomol. 2011, 104, 1406–1414. [Google Scholar] [CrossRef] [PubMed]
  37. Kuczyński, L.; Rector, B.G.; Kiedrowicz, A.; Lewandowski, M.; Szydło, W.; Skoracka, A. Thermal niches of two invasive genotypes of the wheat curl mite Aceria tosichella: Congruence between physiological and geographical distribution data. PLoS ONE 2016, 11, e0154600. [Google Scholar] [CrossRef] [PubMed]
  38. Smirnov, N.V. Estimate of deviation between empirical distribution functions in two independent samples. Bull. Mosc. Univ. 1939, 2, 3–16. [Google Scholar]
  39. Levene, H. Robust tests for the equality of variance. In Contributions to Probability and Statistics: Essays in Honor of Harold Hotelling; Olkin, I., Ghurye, S.G., Hoeffding, W., Madow, W.G., Mann, H.B., Eds.; Stanford University Press: Palo Alto, CA, USA, 1960; pp. 278–292. [Google Scholar]
  40. Brown, M.B.; Forsythe, A.B. Robust tests for equality of variances. J. Am. Stat. Assoc. 1974, 69, 364–367. [Google Scholar] [CrossRef]
  41. SAS Institute. The GLIMMIX Procedure, SAS/STAT User’s Guide, version 9.2; SAS Institute, Inc.: Cary, NC, USA, 2009. [Google Scholar]
  42. Stroup, W.W. Generalized Linear Mixed Models: Modern Concepts, Methods and Applications; Chapman & Hall/CRC Press: Boca Raton, FL, USA, 2012. [Google Scholar]
  43. Littell, R.C.; Milliken, G.A.; Stroup, W.W.; Wolfinger, R.D. SAS System for Mixed Models; SAS Institute, INC: Cary, NC, USA, 1996. [Google Scholar]
  44. Milliken, G.; Johnson, D. Analysis of Messy Data; Chapman & Hall/CRC Press: Boca Raton, FL, USA, 2009; Volume 1. [Google Scholar]
  45. Agresti, A. An Introduction to Categorical Data Analysis, 2nd ed.; John Wiley & Sons: Hoboken, NJ, USA, 2007. [Google Scholar]
  46. Anderson, G.R.; Papa, D.; Peng, J.; Tahir, M.; Lapitan, N.L. V Genetic mapping of Dn7, a rye gene conferring resistance to the Russian wheat aphid in wheat. Theor. Appl. Genet. 2003, 107, 1297–1303. [Google Scholar] [CrossRef] [PubMed]
  47. Malik, R.; Brown-Guedira, G.L.; Smith, C.M.; Harvey, T.L.; Gill, B.S. Genetic mapping of wheat curl mite resistance genes Cmc3 and Cmc4 in common wheat. Crop. Sci. 2003, 43, 644–650. [Google Scholar] [CrossRef]
  48. Thomas, J.B.; Conner, R.L. Resistance to colonization by the wheat curl mite in Aegilops squarrosa and its inheritance after transfer to common wheat. Crop. Sci. 1986, 26, 527–530. [Google Scholar] [CrossRef]
  49. Marais, G.F.; Horn, M.; Du Torr, F. Intergeneric transfer (rye to wheat) of a gene (s) for Russian wheat aphid resistance. Plant Breed. 1994, 113, 265–271. [Google Scholar] [CrossRef]
  50. Porter, D.R.; Mornhinweg, D.W.; Webster, J.A. Insect resistance in barley germplasm. In Global Plant Genetic Resources for Insect-Resistant Crops; CRC Press: Boca Raton, FL, USA, 1999; pp. 51–62. [Google Scholar]
Figure 1. Non-infested (A) and infested (B) plants in a non-choice experiment. (A) Non-infested plants lacked the piece of leaf containing mites. (B) Infested plants had a piece of leaf containing 30 A. tosichella adults. Individual plants were caged with a plastic tube (8.5 cm diameter × 51 cm tall) to prevent movement of mites to and from adjacent plants. Each cage had three-side (5 cm diameter) and one-top (8.5 cm diameter) openings that were covered with a mite-proof mesh (36 µm) to reduce humidity inside the cage. Each cage was depressed into the pot soil to hold it in place (Illustration by Neal Wollenberg, Kansas State University Global Campus, Manhattan, KS, USA).
Agronomy 09 00748 g001
Table 1. Mean number of A. tosichella biotype 1, mean plant tolerance index, mean percent proportional plant dry weight change and mean percent proportional plant height change in three barley varieties and two control wheat varieties at 15 days post infestation in a non-choice experiment.
Mean (Lower, Upper CI)Mean Percent Proportional Change ± SE
Plant VarietyArthropod R Gene(s)# Mites °Tolerance Index °Dry WeightHeight
OK05312 wheat (R)Cmc47.2 (0.9, 58.2) a5.9 (0.8, 25.9)18.6 ± 14.524.5 ± 8.7
Eight-twelve barleyNone40.5 (5.3, 308.2) ab0.5 (0.3, 6.1)6.9 ± 13.823.4 ± 8.4
Stoneham barleyRdn1, Rdn2*78.3 (10.3, 593.5) b0.9 (0.2, 4.5)−3.6 ± 13.87.8 ± 8.4
Sydney barleyRdn1, Rdn283.2 (11.0, 630.8) b0.5 (0.3, 6.1)18.7 ± 13.87.6 ± 8.4
Ike wheat (S)None155.2 (20.5, 1175.0) b4.0 (0.3, 6.1)12.5 ± 13.8−0.7 ± 0.7
Means followed by different lowercase letter are significantly different based on Tukey–Kramer mean separation tests (P < 0.05). R, Resistant wheat control; S, susceptible wheat control; CI, confidence interval; SE, standard error; ° Data presented in original data scale after back-transformation; * allele. Percent proportional plant dry weight change = ([dry weight non-infested − dry weight infested]/dry weight non-infested) × 100. Percent Proportional plant height change = ([height non-infested − height infested]/height non-infested) × 100.
Table 2. Mean number of A. tosichella biotype 2, mean plant tolerance index, mean percent proportional plant dry weight change and mean percent proportional plant height change in three barley varieties and two control wheat varieties at 15 days post infestation in a non-choice experiment.
Mean (Lower, Upper CI)Mean Percent Proportional Change ± SE
Plant VarietyArthropod R Gene(s)# Mites °Tolerance Index °Dry WeightHeight
OK05312 wheat (R)Cmc433.4 (9.4, 118.2) a5.6 (1.0, 20.8)9.1 ± 11.824.2 ± 4.5
Eight-twelve barleyNone58.9 (16.7, 207.3) ab1.4 (0.4, 4.2)15.1 ± 11.84.6 ± 4.5
Sydney barleyRdn1, Rdn279.6 (21.6, 290.0) ab0.1 (0.3, 3.4)0.2 ± 11.84.6 ±4.5
Stoneham barleyRdn1, Rdn2*143.1 (37.5, 545.9) ab0.5 (0.3, 5.3)14.7 ± 11.823.1 ± 4.5
Ike wheat (S)None216.3 (61.8, 757.6) b0.1 (0.3, 3.3)19.9 ± 11.88.1 ± 4.5
Means followed by different lowercase letter are significantly different based on Tukey–Kramer mean separation tests (p < 0.05). R, Resistant wheat control; S, susceptible wheat control; CI, confidence interval; SE, standard error; ° Data presented in original data scale after back-transformation; *allele. Percent Proportional plant dry weight change = ([dry weight non-infested − dry weight infested]/dry weight non-infested) × 100. Percent Proportional plant height change = ([height non-infested − height infested]/height non-infested) × 100.
Table 3. Percent of plants of three barley and two control wheat varieties exhibiting folded-leaf reaction to A. tosichella biotype 1 feeding at 15 days post infestation in a non-choice experiment.
Fisher’s Exact Test P-Value for Each Variety Compared to:
Plant VarietyArthropod R Gene(s)% Folded PlantsIke (Susceptible Control)OK05312 (Resistant Control)
OK05312 wheat (R)Cmc414.30.0101 *-
Eight-twelve barleyNone37.50.1189 ns0.2872 ns
Stoneham barleyRdn1, Rdn2*62.50.5692 ns0.1189 ns
Sydney barleyRdn1, Rdn275.01.0 ns0.0406 *
Ike wheat (S)None87.5-0.0101 *
* = significant at P < 0.05; ns, not significant P > 0.05; S, susceptible wheat control; R, resistant wheat control.
Table 4. Percent of plants of three barley and two control wheat varieties exhibiting folded-leaf reaction to A. tosichella biotype 2 feeding at 15 days post infestation in a non-choice experiment.
Fisher’s Exact Test P-Value for Each Variety Compared to:
Plant VarietyArthropod R Gene(s)% Folded PlantsIke (Susceptible Control)OK05312 (Resistant Control)
OK05312 wheat (R)Cmc400.4667 ns-
Eight-twelve barleyNone00.4667 ns1.0 ns
Sydney barleyRdn1, Rdn2251.0 ns0.4667 ns
Ike wheat (S)None25-0.4667 ns
Stoneham barleyRdn1, Rdn2*62.50.3147 ns0.0256 *
* = significant at P < 0.05; ns, not significant P > 0.05; S, susceptible wheat control; R, resistant wheat control.
Table 5. Mean (CI) number of A. tosichella biotype 1 on three barley and two control wheat varieties at seven days post infestation in a choice experiment.
Plant VarietyArthropod R Gene(s)Mean # Mites (Lower, Upper CI) °
OK05312 wheat (R)Cmc42.2 (1.0, 5.1) a
Sydney barleyRdn1, Rdn24.8 (2.2, 10.3) ab
Eight-twelve barleyNone9.2 (4.4, 19.5) b
Ike wheat (S)None10.1 (4.8, 21.1) b
Stoneham barleyRdn1, Rdn2*17.7 (8.6, 36.6) b
Means followed by different lowercase letter are significantly different based on Tukey–Kramer mean separation tests (P < 0.05). R, resistant wheat control; S, susceptible wheat control; CI, confidence interval; ° Data presented in original data scale after back-transformation; * allele.
Table 6. Mean (CI) number of A. tosichella biotype 2 on three barley and two control wheat varieties at seven days post infestation in a choice experiment.
Plant VarietyArthropod R Gene(s)Mean # Mites (Lower, Upper CI)
OK05312 wheat (R)Cmc491.9 (176.5, 368.3) a
Eight-twelve barleyNone176.3 (80.4, 272.2) ab
Ike wheat (S)None272.4 (176.5, 368.3) bc
Sydney barleyRdn1, Rdn2331.7 (235.8, 427.6) c
Stoneham barleyRdn1, Rdn2*347.8 (251.9, 443.7) c
Means followed by different lowercase letter are significantly different based on Tukey–Kramer mean separation tests (P < 0.05). R, resistant wheat control; S, susceptible wheat control; CI, confidence interval.

