Modelling the Effects of Climate Change on the Distribution of Endangered Cypripedium japonicum in China
by
 ,
,
Yadong Xu
1,2, 
Yi Huang
1,2,
Huiru Zhao
1,2,
Meiling Yang
1,2,
Yuqi Zhuang
1,2 and
Xinping Ye
1,2,* 1
College of Life Sciences, Shaanxi Normal University, Xi’an 710119, China
2
Research Center for UAV Remote Sensing, Shaanxi Normal University, Xi’an 710119, China
*
Author to whom correspondence should be addressed.
Forests 2021, 12(4), 429; https://doi.org/10.3390/f12040429
Submission received: 17 March 2021
/
Revised: 1 April 2021
/
Accepted: 1 April 2021
/
Published: 2 April 2021
(This article belongs to the Section Forest Inventory, Modeling and Remote Sensing)
Abstract
:Cypripedium japonicum is an endangered terrestrial orchid species with high ornamental and medicinal value. As global warming continues to intensify, the survival of C. japonicum will be further challenged. Understanding the impact of climate change on its potential distribution is of great significance to conserve this species. In this study, we established an ensemble species distribution model based on occurrence records of C. japonicum and 13 environmental variables to predict its potential distribution under current and future climatic conditions. The results show that the true skill statistic (TSS), Cohen’s kappa statistic (Kappa), and the area under the receiver operating characteristic curve (AUC) values of the ensemble model were 0.968, 0.906, and 0.995, respectively, providing more robust predictions. The key environmental variables affecting the distribution of C. japonicum were the precipitation in the warmest quarter (Bio18) and the mean temperature in the driest quarter (Bio9). Under future climatic conditions, the total suitable habitat of C. japonicum will increase slightly and tend to migrate northwestward, but the highly suitable areas will be severely lost. By 2070, the loss of its highly suitable habitat area will reach 57.69–72.24% under representative concentration pathway (RCP) 4.5 and 8.5 respectively, and the highly suitable habitats in Zhejiang and Anhui will almost disappear. It is noteworthy that the highly suitable habitat of C. japonicum has never crossed the Qinba mountainous area during the migration process of the suitable habitat to the northwest. Meanwhile, as the best-preserved area of highly suitable habitat for C. japonicum in the future, the Qinba mountainous area is of great significance to protect the wild germplasm resources of C. japonicum. In addition, we found that most of the changes predicted for 2070 will already be seen in 2050; the problem of climate change may be more urgent than it is believed.
1. Introduction
Climate change has been recognized as one of the major threats to global biodiversity [1,2]. Local extinctions of species related to climate change have been reported all over the world, and such extinctions are likely to continue as the global climate continues to warm in the future [3]. Therefore, it is important to evaluate species’ vulnerability to climate change and identify species’ potential range shifts, which is crucial for the management and conservation of endangered species under climate change. Orchids are a flagship group in plant conservation and currently face unprecedented risks of extinction, not only in China [4] but also in other continents, such as Australia [5] and Europe [6,7]. All orchid species are included under Appendix II of the Convention on International Trade in Endangered Species of Wild Fauna and Flora (CITES) [8]. Cypripedium japonicum Thunb., also called the lady’s slipped orchid, is an extremely rare terrestrial orchid unique to East Asia and is listed as an endangered species on the International Union for Conservation of Nature (IUCN) Red List of Threatened Species [8]. C. japonicum is usually found at the edges of bamboo forests, near streams, and in moist deciduous woodlands, preferring to grow in well-drained, humus-rich, slightly acidic organic soils [8,9,10]. Possessing two large fan-shaped leaves and highly appealing flowers, C. japonicum is of high horticultural value [11,12]. In addition, the whole plant can be used in traditional Chinese medicine (TCM) to promote blood circulation for regulating menstruation and alleviating pain [12,13].
Species distribution models (SDMs) are numerical tools that combine observations of species occurrence or abundance with environmental estimates, and the main assumption is that species are at equilibrium with their environments [14]. SDMs are considered a powerful tool to predict the impacts of climate change on a species’ distribution [15,16,17] and are typically used to assess the introduction and cultivation of plants [18], the potential threat of pests [19], and the natural preservation of endangered species [20]. For example, Danping Xu et al., analysed the climate suitability of Zanthoxylum armatum DC. in China and determined its suitable planting area, which provided scientific guidance for the introduction and cultivation of Z. armatum [18]. Hsiao-Hsuan Wang et al., predicted the suitable habitat of an endangered terrestrial orchid (Spiranthes parksii Correll) in central Texas, USA, and provided scientific advice for protecting this species [21].
To appropriately preserve and utilize the natural resources of C. japonicum, it is important to understand its potential distribution. However, past research on C. japonicum has mainly focused on pollination biology [22], reproductive characteristics [23], and population genetics [11,12], and no study has predicted the potential distribution of C. japonicum. In addition, the potential impacts of climate change on the distribution of this species are unclear. Therefore, we used the ensemble modelling approach to (1) identify the key factors influencing its distribution; (2) map the potential suitable habitat for this species under current, 2050 (average for 2041–2060) and 2070 (average for 2061–2080) climate scenarios; and (3) compare the potential effects of climate change on the suitable habitat for this species in two future periods.
2. Materials and Methods
2.1. Species Occurrence Data
The current occurrence records of C. japonicum used in the study were collected from the Global Biodiversity Information Facility (https://www.gbif.org (accessed on 31 August 2020)), the Chinese Virtual Herbarium (http://www.cvh.org.cn (accessed on 31 August 2020)), the Specimen Resources Sharing Platform for Education (http://mnh.scu.edu.cn (accessed on 31 August 2020)), the Chinese Field Herbarium (http://www.cfh.ac.cn (accessed on 31 August 2020)), and from published literature [24]. Google Earth (http://ditu.google.cn (accessed on 31 August 2020)) was used to assign longitude and latitude data to any record that lacked geographic coordinates. To match the resolution of the selected environmental variables and avoid overrepresentation of environmental conditions in densely sampled areas, only one distribution record was kept in each 2.5 × 2.5 arc-minute grid cell. In total, 190 occurrence records of C. japonicum were retrieved, of which 163 records were included in this study (Figure 1).
2.2. Environmental Variables
Twenty-eight environmental variables related to the distribution of C. japonicum were selected, including 19 bioclimatic factors, 6 edaphic factors, and 3 topographic factors. Nineteen bioclimatic layers and elevation were obtained from the WorldClim database (www.worldclim.org (accessed on 31 August 2020)) for the baseline scenario and two future climatic scenarios (2050 and 2070) [25]. Slope and aspect were extracted from the digital elevation model (DEM) data in ArcGIS 10.2 (ESRI, Redlands, CA, USA). The addition of edaphic factors could better capture the needs of plants [26]; thus, six edaphic factors related to the distribution of C. japonicum were obtained from the Harmonized World Soil Database (www.iiasa.ac.at (accessed on 31 August 2020)). We assumed that there would be no significant changes in edaphic factors within the time span of the projections. All environmental variables had a spatial resolution of 2.5 arc-minutes (~5 km). With the help of ArcGIS Conversion Tools, environmental factors were converted into ASCII format.
The bioclimatic factors for 2050 and 2070 were derived from two commonly used general circulation models (GCMs), the Community Climate System Model version 4.0 (CCSM4) and the Model for Interdisciplinary Research on Climate, Earth System Model (MIROC-ESM) [27,28]. The CCSM4 dataset was developed by the National Center for Atmospheric Research of the United States and could better simulate the climate characteristics of East Asia [29]. The MIROC-ESM model includes simulations of terrestrial carbon cycling and vegetation dynamics in comparison to other models [27]. Four representative concentration pathways (RCPs) were established in the 5th report of the IPCC [30]. RCP4.5 is a scenario with a moderate amount of greenhouse gas emissions, and RCP8.5 represents the highest emissions scenario. We selected RCP4.5 because RCP2.6 is a stringent mitigation scenario that is difficult to implement. Thus, RCP4.5 and RCP8.5 were selected to predict the future suitable distributions of C. japonicum under two GCMs.
Eliminating the multicollinearity among the environmental variables can reduce overfitting and improve the predictive ability of a model [31,32]. We used the Spearman correlation coefficient to examine multicollinearity. When the Spearman correlation coefficient between variables is greater than 0.7, a variable with a small variance inflation factor (VIF) is selected for the model [33]. This work was implemented through the “fuzzySim” package in R 4.0.2 [34,35]. Finally, out of 28 variables, 13 were selected as evaluator variables (Table 1).
2.3. Modelling Procedure
The modelling algorithm was the greatest source of uncertainty in the SDM performance, and the ensemble of multiple algorithms could provide more accurate predictions [36]. Ten modelling algorithms implemented through the “biomod2” package in R 4.0.2 were used to predict the potential distribution of C. japonicum [37]. These models included the generalized linear model (GLM), generalized additive model (GAM), generalized boosting model (GBM), classification tree analysis (CTA), artificial neural network (ANN), surface range envelope (SRE), flexible discriminant analysis (FDA), multiple adaptive regression splines (MARS), random forest (RF), and maximum entropy (MaxEnt). To build a more reliable SDM, we generated 1000 pseudoabsence records randomly in the study area, and each algorithm was repeated ten times [38]. We used the default settings of the biomod2 package for all modelling algorithms.
To assess model accuracy, a random subset of 70% of the occurrence data was used to calibrate the models, and the remaining 30% was used for evaluation. SDM model performance was assessed with the true skill statistic (TSS), Cohen’s kappa statistic (Kappa), and the area under the receiver operating characteristic curve (AUC) [39,40,41]. The above three metrics are the most highly applied in assessing the performance of SDMs [17,42]. The TSS and Kappa values range from −1 to 1, and the AUC value ranges from 0.5 to 1; the closer their value is to 1, the more reliable the prediction results are [40,41]. We repeated the calculation ten times and calculated the mean values of the TSS, Kappa, and AUC of the ten model algorithms. Model algorithms with a mean TSS value greater than 0.8 were applied for further analysis.
We also assessed the relative importance of the variables using the biomod2 method. The principle is to shuffle a single variable of the given data and use this dataset to make model predictions. Then, we compute Pearson’s correlation coefficient between reference predictions and the “shuffled” prediction. The returned score is 1 minus Pearson’s correlation coefficient; the higher the value is, the more influence the variable has on the model [37]. To show the importance of each variable more intuitively, we converted the returned score into a percentage.
In creating the potential distribution maps, maximum training sensitivity plus specificity threshold values were used. Accordingly, values of “0–0.1223” denote unsuitable regions, values of “0.1223–0.4149” denote regions of low suitability, values of “0.4119–0.7074” denote moderately suitable regions, and values of “0.7074–1” denote highly suitable regions. The size of each suitable area and how it will change under the four future climate scenarios (2050-RCP4.5, 2070-RCP4.5-, 2050-RCP8.5, and 2070-RCP8.5) were determined in ArcGIS 10.2.
2.4. Centroid Shifts
Our study also focused on the centroid shifts in the distribution of C. japonicum under future climatic conditions, and the centroid is the geographic centre of a region. We calculated the centroids of current and future suitable areas using SDM Toolbox 2.4, a type of Python-based GIS software [43]. The software created a vector file that was used to depict the magnitude and direction of the predicted change over time. Finally, we examined the shifts in the distribution of C. japonicum by tracking how the centroid changed.
3. Results
3.1. Model Performance
Through the cross-validation evaluation of the models, both the ensemble model and all ten algorithms were used to obtain the TSS, Kappa, and AUC values (Table 2). The TSS values varied from 0.586 (SRE) to 0.915 (RF), the Kappa values varied from 0.656 (SRE) to 0.847 (RF), and the AUC values ranged from 0.793 (SRE) to 0.983 (RF). The results of the three metrics all showed that the RF algorithm provided the best predictive performance and the SRE provided the worst. We selected model algorithms with a mean TSS value greater than 0.8 for ensemble modelling. Finally, eight algorithms were selected (RF, GBM, GLM, MARS, MAXENT, FDA, ANN, and CTA). The TSS, Kappa, and AUC values of the ensemble model were 0.968, 0.906, and 0.995, respectively, providing more robust predictions than all of the single models.
3.2. Variable Contribution
Thirteen variables were inputted into the final model, and the importance of the contributed variables is presented in Table 3. The precipitation of the warmest quarter (Bio18) and the mean temperature of the driest quarter (Bio9) were the two most significant variables that contributed 24.00% and 23.69% to the model, respectively, followed by precipitation seasonality (Bio15; 19.08%) and slope (11.98%). Bioclimatic factors and topographic factors played important roles in the potential distribution of C. japonicum, and their cumulative contribution rate was as high as 97.65%. Edaphic factors, especially topsoil organic carbon (T_OC; 0.11%), contributed little to the predictive performance of the model. This result indicates that bioclimatic factors and topographic factors provide more precise evidence for defining and selecting suitable habitats rather than do edaphic factors.
3.3. Current and Future Potential Distributions
The predicted suitable regions of C. japonicum in China under current climate conditions are mainly concentrated in eastern Sichuan, southern Shaanxi, Chongqing, Guizhou, southwestern Henan, Hubei, Hunan, southern Anhui, Zhejiang, Jiangxi, Fujian, northern Guangdong, and northern Guangxi. Among them, the most suitable regions were mainly scattered in southern Shaanxi, Chongqing, northern Guizhou, western Hubei, northwestern Hunan, southern Anhui, and eastern Zhejiang (Figure 2). The current total suitable regions for C. japonicum encompassed approximately 1.69 × 10⁶ km2, among which highly suitable regions comprised approximately 4.53 × 10⁵ km2 (Table 4).
Based on the RCP4.5 climate scenario, the total suitable regions increased by 2.79% in 2050 (Figure 2) and 2.68% in 2070 (Figure 2), while the highly suitable regions decreased by 44.95% and 57.69%, respectively (Table 4). When compared with the current conditions, the prediction shows that C. japonicum gains in suitable regions in southern Gansu, central Shanxi, and southwestern Xinjiang in 2050, amounting to approximately 2.41 × 10⁵ km2. The suitable regions that were lost were equal to approximately 2.36 × 10⁵ km2, and these sites were located in southern Henan, central Hubei, northern Anhui, and northern Jiangxi. By 2070, the regions of suitable habitat gains and losses were almost the same as those in 2050 (Figure 3, Table 5).
Under RCP8.5, the ensemble model estimated that the range of suitable habitat would increase in southwestern Xinjiang, eastern Xizang, southern Gansu, central Sichuan, central Shaanxi, and southern Shanxi by a total of 3.74 × 10⁵ km2 by 2050. The area of lost suitable habitat of ca. 2.78 × 10⁵ km2 was mainly scattered in southern Henan, central Hubei, northern Hunan, northern Anhui, central Jiangsu, and northern Jiangxi. By 2070, suitable habitats will increase relative to the amount in 2050 in southeastern Liaoning, and other areas will remain basically unchanged. The suitable region that experienced an increase was equal to 5.80 × 10⁵ km2, while the suitable region that experienced a loss was equal to approximately 3.84 × 10⁵ km2 (Figure 3, Table 5). When compared with the current conditions, the total suitable regions under the RCP8.5 climate scenario will increase by 8.83% in 2050 and 14.72% in 2070, while the highly suitable regions will decrease by 49.98% and 72.24%, respectively (Table 4). The highly suitable regions in Hunan, Guizhou, Anhui, Zhejiang were almost completely lost by 2070 (Figure 2).
3.4. Centroid Shifts
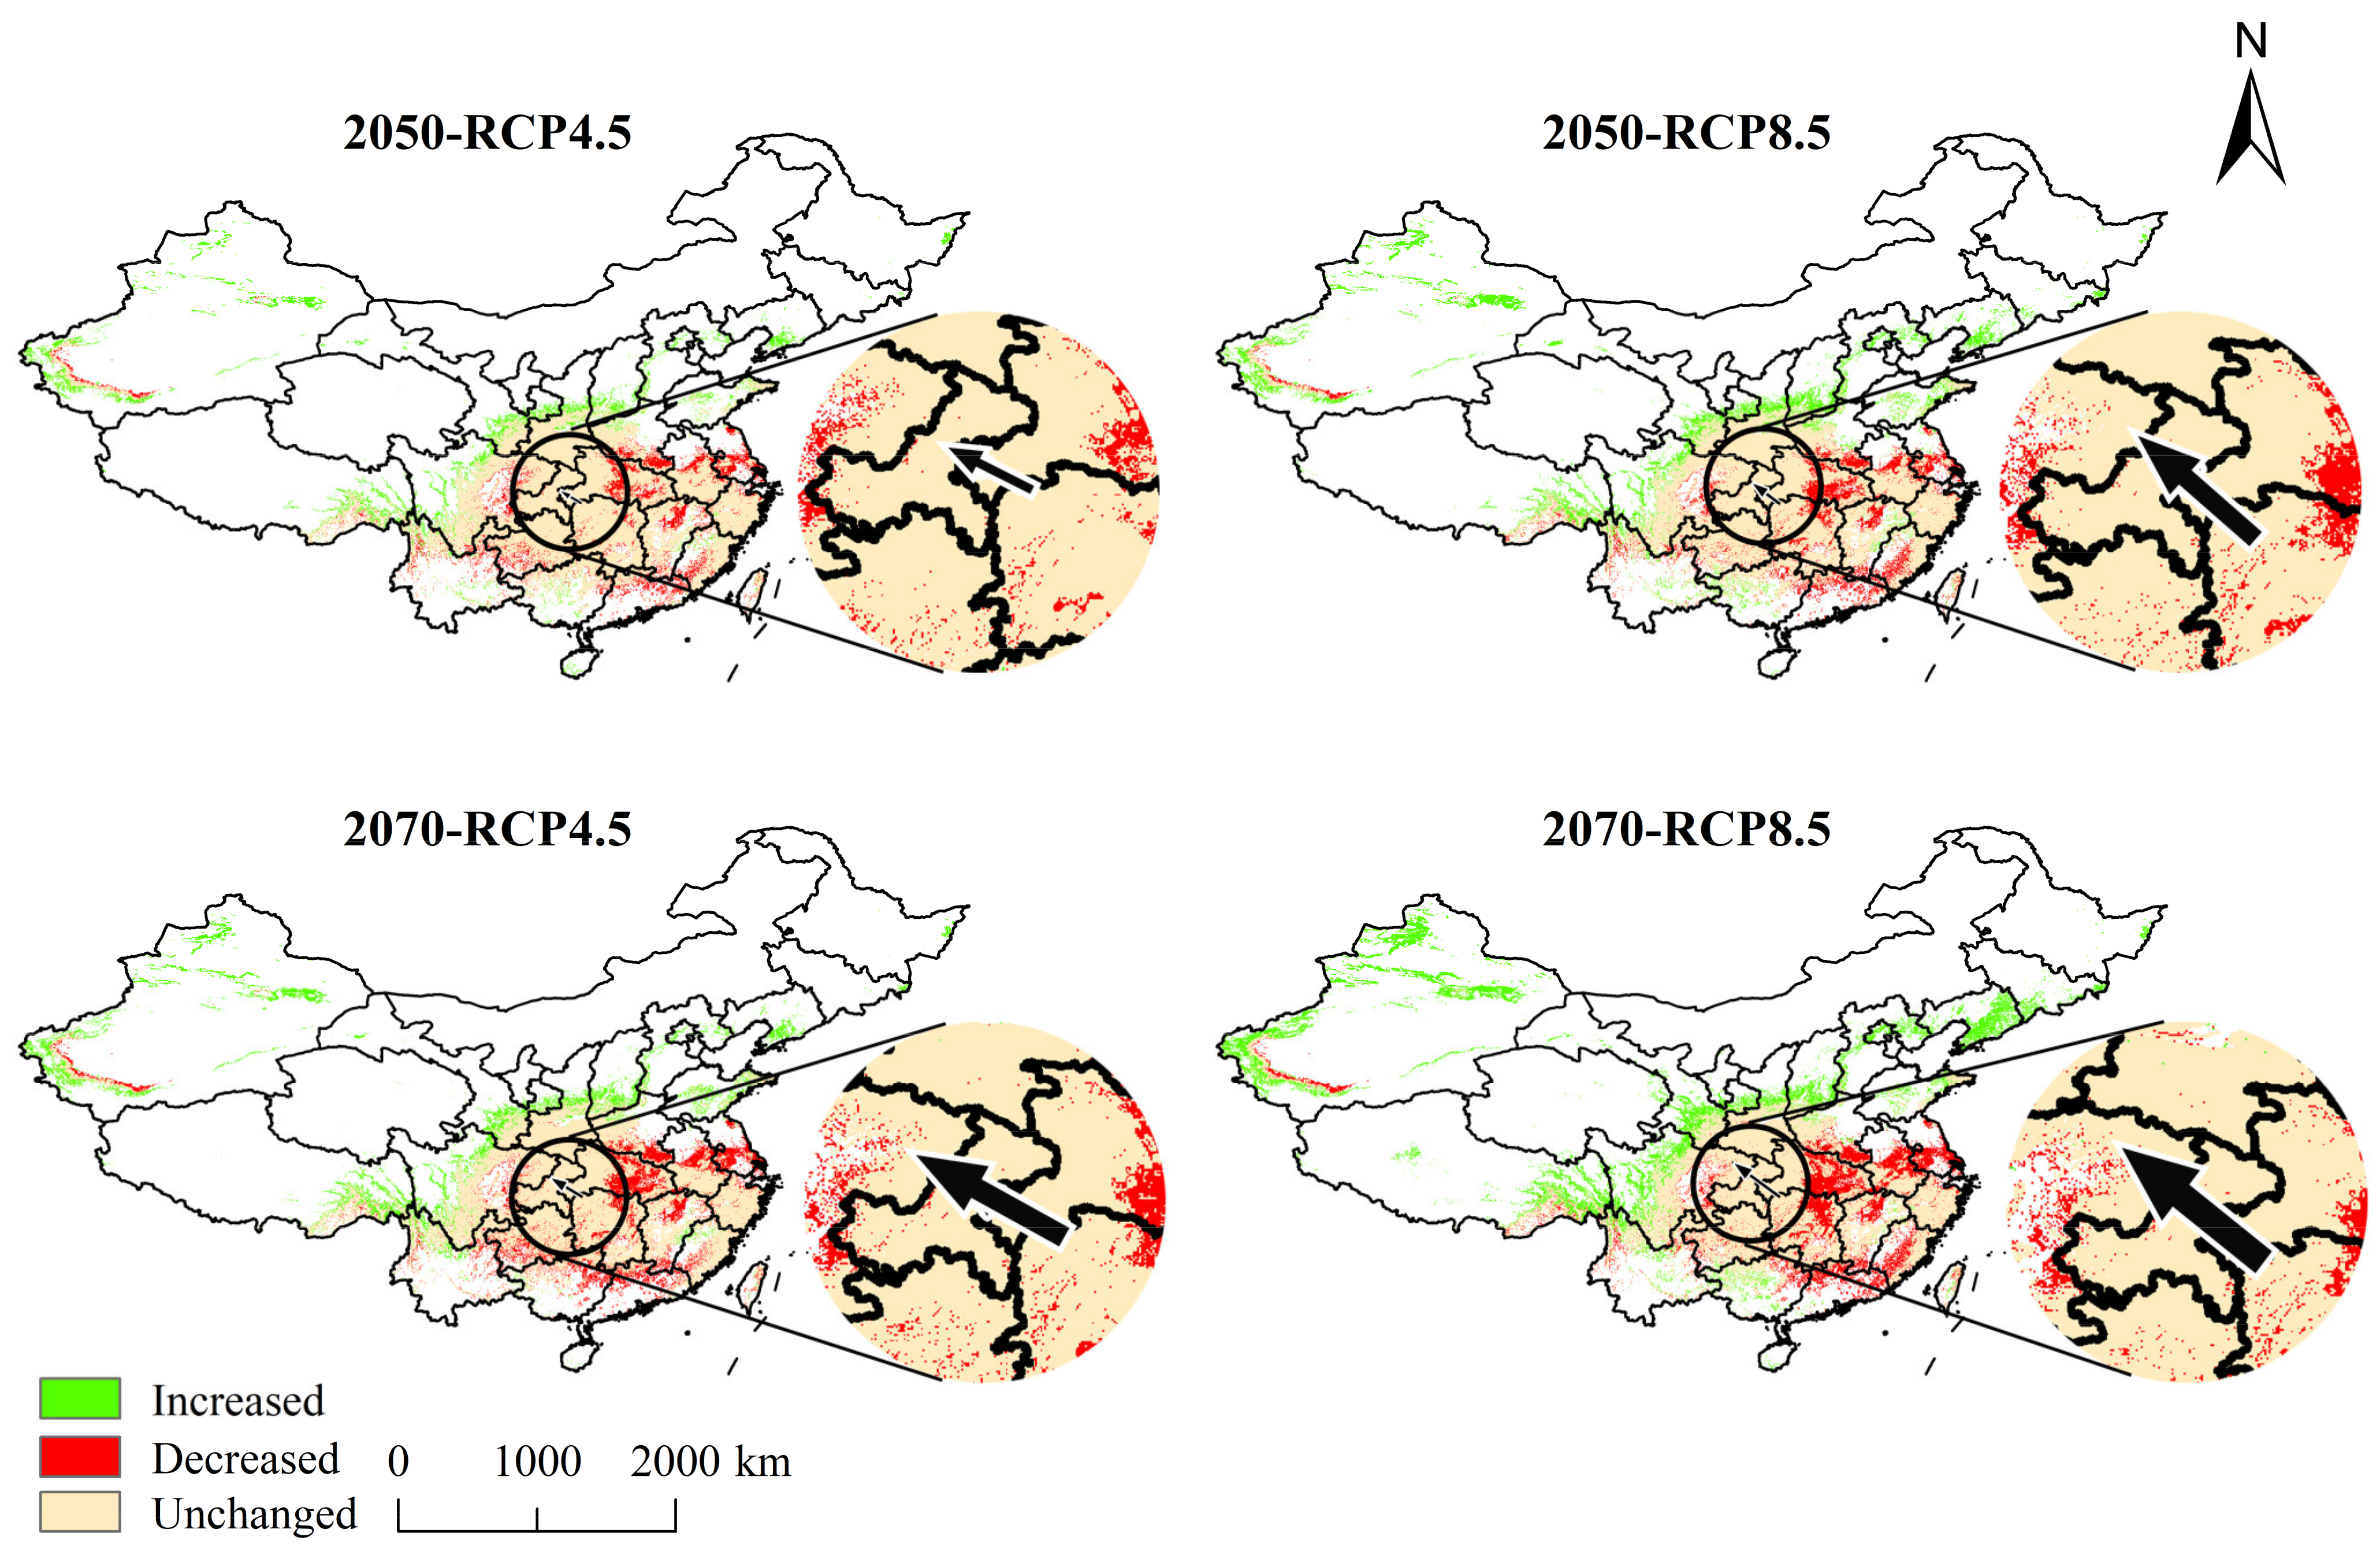
The centroid of the current habitat of C. japonicum was located in the Badagong Mountain Nature Reserve in northwestern Hunan Province (109°55′ E, 29°33′ N). In 2050, the centroid of the suitable habitat was moved to Lichuan, Hubei Province (108°30′ E, 30°24′ N; RCP4.5) and Kaizhou, Chongqing (108°10′ E, 30°55′ N; RCP8.5). By 2070, the centroid of the suitable habitat had migrated to Wanyuan, Sichuan Province (107°53′ E, 30°47′ N; RCP4.5) and Bazhou, Sichuan Province (106°56′ E, 31°46′ N; RCP8.5). Overall, we observed that the centroid shifted towards the northwest under the four future emission trajectories, shifting by a maximum distance of 375.64 km (Figure 3).
4. Discussion
In this study, we used ensemble SDMs to explore current and future habitat suitability for the endangered orchid C. japonicum in China. Our research is one of the few examples assessing the expected impact of climate change on the distribution of orchids. The predictions of our study are helpful for understanding how C. japonicum might respond to future climates, and this information is of great significance to the protection of wild orchid germplasm resources.
Species distribution modelling is currently the most important method for predicting potential species distributions and may guide management actions. In addition, the IUCN recently began using SDMs to determine rankings of threats for the species categorized within the Red List [44,45]. The AUC score is a popular metric for assessing model performance, but if used alone, it is not a useful criterion [46]. Therefore, we also used the TSS score and Kappa score to evaluate the model and used the TSS score to select modelling algorithms, which is the greatest source of uncertainty in SDM research; additionally, we used multiple algorithms for modelling to improve prediction accuracy [36]. Finally, eight model algorithms with a mean TSS value greater than 0.8 were selected to build an ensemble model. Its TSS, Kappa, and AUC values were 0.968, 0.906, and 0.995, respectively, thus indicating that the final ensemble model was reasonably robust. Many studies have adopted bioclimatic factors as all environmental variables when using SDMs to predict the geographical distributions of species and the spread of invasive species [18,47]. However, C. japonicum has strict habitat requirements, is especially sensitive to soil, and prefers to grow in slightly acidic, moist, and humus-rich soils in forests, thickets, and shaded slopes at elevations of 1000–2000 m [48]. Accordingly, in addition to bioclimatic factors, we selected five edaphic factors and two topographic factors in our model. Some studies ignore the redundant information introduced by highly correlated variables in the modelling process [49]. In this study, we used the Spearman correlation coefficient to examine multicollinearity and select variables with smaller VIFs. Even so, our research still has uncertainties in revealing the true distribution of C. japonicum. For example, it lacks information on dispersal limitations, biotic interactions, and artificial disturbance.
According to the results of our ensemble SDM, under the current climatic condition, the distribution of C. japonicum is mainly in the subtropical region south of the Qinling Mountains-Huaihe River line. The highly suitable regions are mostly in the Qinba mountainous area, Wuling mountainous area, Dabie mountainous area, Dalou Mountains, and Tianmu Mountains. The result fits with the report in Flora of China and published literature [50,51]. These regions have a subtropical monsoon climate and hot and rainy summers with warm and less rainy winters [50,52]. Climate is one of the most important factors affecting the geographic distribution of plant biomes and species [53,54]. Among the 13 environmental variables adopted in our ensemble SDM, the precipitation of the warmest quarter (Bio18) and the mean temperature of the driest quarter (Bio9) made the greatest contributions to the distribution model for C. japonicum, indicating that these factors play important roles in its distribution. The precipitation of the warmest quarter will first increase and then decrease, but it will always be higher than the current precipitation, and the mean temperature of the driest quarter will always increase. Surprisingly, edaphic factors contributed little to the predictive performance of the model. One possible reason is that climate is the most important determinant of species occurrence when modelling is carried out in a large geographical area [45,55], while soil properties determine habitat availability at local scales [56].
We compared the differences in the impacts of climate changes on the suitable habitat of C. japonicum between periods 2050 and 2070 and found that most of the changes predicted for 2070 will already be seen in 2050. This is consistent with the results of Puchałka et al. [57], which indicates the problem of climate change may be more urgent than has been shown by studies so far ignored 2050 and only focused on 2070. [58,59,60]. Hence, the results of our research have shown that also for species, the time to take protective measures may be twenty years less than is commonly believed. We recommend that a complete 2050 prediction study should be conducted on other species in the future research.
According to most of the predicting models, the temperature in China will increase significantly in the future, and precipitation will also increase [61]. Considering that C. japonicum likes to grow in warm and humid environments, future climate conditions will become more suitable for this species. Our results show that the total suitable area of C. japonicum will increase under the four future climatic conditions, especially the 2070-RCP8.5, under which the total suitable area will increase by 14.72% compared with the area in contemporary times, reaching 19.37 × 10⁵ km2. However, highly suitable areas of C. japonicum always declined in this study, with reductions of 44.95–72.24% relative to contemporary areas. Under 2070-RCP8.5, almost all the highly suitable areas in the Dabie mountainous area and Tianmu Mountains disappeared, and those in the Wuling mountainous area and Dalou Mountains disappeared completely. Plant-pollinator relationships are disrupted by temperature changes [62]. Erratic rainfall can cause imbalances in the soil moisture, vegetation, and microclimate of forest areas [63], and extreme rainfall can accelerate soil erosion. Furthermore, the incidence of disease outbreaks is accumulated each year due to climate change [64]. These factors pose significant threats to the survival of C. japonicum.
Some species will migrate to high latitudes or high elevations because of global warming [65,66]. Consistently, our prediction showed that C. japonicum changes its distribution in response to future climatic changes. The centroid of the total suitable area of C. japonicum shifted towards the northwest under all future emission trajectories and moved from the Wuling mountainous area to the Qinba mountainous area, which has a higher average elevation and higher latitude. However, the highly suitable area never crossed the Qinba mountainous area, which is the northern boundary of C. japonicum distribution. Simultaneously, the Qinba mountainous area is the most well-preserved place in the highly suitable area of C. japonicum in the future; therefore, it is of great significance to protect its wild germplasm resources.
Because of this species’ precious ornamental and medicinal value, artificial mining is serious. In addition, C. japonicum provides no harvestable reward to its pollinators, which is called deceit pollination. Pollinators might learn to discriminate between nonrewarding and rewarding flowers so that the reproductive success rate of C. japonicum is very low [22,67]. To reduce the extinction risk of C. japonicum, protection measures are urgent. Specifically, it would be useful to establish phenological monitoring to help identify potential mismatches in phenology between C. japonicum and its pollinators. Assisted migration may be another alternative, and this method requires transplanting excess vegetative propagators to newly suitable locations as the climate changes. This approach can not only enhance fruit setting and reproduction but also address the adverse effects of climate change. While carrying out these activities, public awareness and policy activities should be raised to reduce the impacts related to human activities.
5. Conclusions
Assessing the impact of climate change on the distribution of endangered species is important for that species’ protection. According to the ensemble SDM, the precipitation in the warmest quarter, the mean temperature in the driest quarter, the precipitation seasonality, and the slope were defined as the key elements shaping the distribution of C. japonicum. We predicted that total suitable area for C. japonicum will tend to increase under all future climatic conditions; however, the highly suitable areas will all decline. Overall, the distribution of suitable habitat will shift to northwest areas with higher elevations and higher latitudes. The Qinba mountainous area is the best-preserved area of highly suitable habitat for C. japonicum in the future. In addition, most of the changes predicted for 2070 will already be seen in 2050; the problem of climate change may be more urgent than it is believed. This work will be a useful reference in developing management and conservation strategies for C. japonicum.
Author Contributions
Conceptualization, Y.X.; methodology, Y.X.; software, Y.X., Y.H. and H.Z.; validation, M.Y., H.Z. and Y.Z.; formal analysis, Y.H. and H.Z.; resources, X.Y.; data curation, Y.X. and M.Y.; writing—original draft preparation, Y.X.; writing—review and editing, X.Y.; visualization, Y.H. and Y.Z.; supervision, X.Y.; project administration, X.Y. All authors have read and agreed to the published version of the manuscript.
Funding
This research was funded by the National Natural Science Foundation of China (grant number 31672310).
Data Availability Statement
Not applicable.
Acknowledgments
We acknowledge the groups of the Global Biodiversity Information Facility, the Chinese Virtual Herbarium, the Specimen Resources Sharing Platform for Education, the Chinese Field Herbarium, the Harmonized World Soil Database, and WorldClim for their available data in making this simulation possible. We acknowledge the two reviewers for their helpful and constructive comments on our work.
Conflicts of Interest
The authors declare no conflict of interest.
References
- Leadley, P. Biodiversity Scenarios: Projections of 21st Century Change in Biodiversity, and Associated Ecosystem Services: A Technical Report for the Global Biodiversity Outlook 3; Secretariat of the Convention on Biological Diversity: Montreal, CA, Canada, 2010. [Google Scholar]
- Subba, B.; Sen, S.; Ravikanth, G.; Nobis, M.P. Direct modelling of limited migration improves projected distributions of Himalayan amphibians under climate change. Biol. Conserv. 2018, 227, 352–360. [Google Scholar] [CrossRef]
- Wiens, J.J. Climate-related local extinctions are already widespread among plant and animal species. PLoS Biol. 2016, 14, e2001104. [Google Scholar] [CrossRef] [Green Version]
- Luo, Y.B.; Jia, J.S.; Wang, C.L. A general review of the conservation status of Chinese orchids. Biodiv. Sci. 2003, 11, 70–77. [Google Scholar] [CrossRef]
- Swarts, N.D.; Dixon, K.W. Terrestrial orchid conservation in the age of extinction. Ann. Bot. 2009, 104, 543–556. [Google Scholar] [CrossRef] [Green Version]
- Štípková, Z.; Kindlmann, P. Orchid extinction over the last 150 years in the Czech Republic. Diversity 2021, 13, 78. [Google Scholar] [CrossRef]
- Wagensommer, R.P.; Medagli, P.; Turco, A.; Perrino, E.V. IUCN Red List evaluation of the Orchidaceae endemic to Apulia (Italy) and considerations on the application of the IUCN protocol to rare species. Nat. Conserv. Res. 2020, 5 (Suppl. 1), 90–101. [Google Scholar] [CrossRef]
- Rankou, H. Cypripedium Japonicum. In The IUCN Red List of Threatened Species, 4th ed.; International Union for Conservation of Nature: Gland, Switzerland, 2014. [Google Scholar]
- Cribb, P.; Sandison, M.S. A preliminary assessment of the conservation status of Cypripedium species in the wild. Bot. J. Linn. Soc. 1998, 126, 183–190. [Google Scholar] [CrossRef] [Green Version]
- Cribb, P.; Mathew, B. Plate 324. Cypripedium henryi: Orchidaceae. Curtis’s Bot. Mag. 1997, 14, 148–153. [Google Scholar] [CrossRef]
- Qian, X.; Li, Q.J.; Liu, F.; Gong, M.J.; Wang, C.X.; Tian, M. Conservation genetics of an endangered lady’s slipper orchid: Cypripedium japonicum in China. Int. J. Mol. Sci. 2014, 15, 11578–11596. [Google Scholar] [CrossRef] [Green Version]
- Tian, H.Z.; Han, L.X.; Zhang, J.L.; Li, X.L.; Kawahara, T.; Yukawa, T.; López-Pujol, J.; Kumar, P.; Chung, M.G.; Chung, M.Y. Genetic diversity in the endangered terrestrial orchid Cypripedium japonicum in East Asia: Insights into population history and implications for conservation. Sci. Rep. 2018, 8, 6467. [Google Scholar] [CrossRef] [PubMed]
- Xie, Z.W.; Fan, C.S.; Zhu, Z.Y. National Chinese Herbal Medicine Compilation (II), 2nd ed.; People’s Medical Publishing House: Beijing, China, 1978; p. 466. [Google Scholar]
- Elith, J.; Leathwick, J.R. Species distribution models: Ecological explanation and prediction across space and time. Annu. Rev. Ecol. Evol. Syst. 2009, 40, 677–697. [Google Scholar] [CrossRef]
- Zhang, Z.; Xu, S.; Capinha, C.; Weterings, R.; Gao, T. Using species distribution model to predict the impact of climate change on the potential distribution of Japanese whiting Sillago japonica. Ecol. Indic. 2019, 104, 333–340. [Google Scholar] [CrossRef]
- Lin, C.T.; Chiu, C.A. The relic Trochodendron aralioides Siebold & Zucc. (Trochodendraceae) in Taiwan: Ensemble distribution modeling and climate change impacts. Forests 2018, 10, 7. [Google Scholar] [CrossRef] [Green Version]
- Lei, J.; Wu, J.; Guan, Q. The potential effects of future climate change on suitable habitat for the Taiwan partridge (Arborophila crudigularis): An ensemble-based forecasting method. Turk. J. Zool. 2017, 41, 513–521. [Google Scholar] [CrossRef]
- Xu, D.; Zhuo, Z.; Wang, R.; Ye, M.; Pu, B. Modeling the distribution of Zanthoxylum armatum in China with MaxEnt modeling. Glob. Ecol. Conserv. 2019, 19, e00691. [Google Scholar] [CrossRef]
- Uusitalo, R.; Siljander, M.; Culverwell, C.L.; Mutai, N.C.; Forbes, K.M.; Vapalahti, O.; Pellikka, P.K.E. Predictive mapping of mosquito distribution based on environmental and anthropogenic factors in Taita Hills, Kenya. Int. J. Appl. Earth Obs. Geoinf. 2019, 76, 84–92. [Google Scholar] [CrossRef]
- Mathai, J.; Niedballa, J.; Radchuk, V.; Sollmann, R.; Heckmann, I.; Brodie, J.; Struebig, M.; Hearn, A.J.; Ross, J.; Macdonald, D.W.; et al. Identifying refuges for Borneo’s elusive Hose’s civet. Glob. Ecol. Conserv. 2019, 17, e00531. [Google Scholar] [CrossRef]
- Wang, H.H.; Wonkka, C.L.; Treglia, M.L.; Grant, W.E.; Smeins, F.E.; Rogers, W.E. Species distribution modelling for conservation of an endangered endemic orchid. AoB Plants 2015, 7. [Google Scholar] [CrossRef] [Green Version]
- Suetsugu, K.; Fukushima, S. Pollination biology of the endangered orchid Cypripedium japonicum in a fragmented forest of Japan. Plant Species Biol. 2014, 29, 294–299. [Google Scholar] [CrossRef]
- Sun, H.Q.; Cheng, J.; Zhang, F.M.; Luo, Y.B.; Ge, S. Reproductive success of non-rewarding Cypripedium japonicum benefits from low spatial dispersion pattern and asynchronous flowering. Ann. Bot. 2009, 103, 1227–1237. [Google Scholar] [CrossRef] [Green Version]
- Li, Q.; Wang, C.; Tian, M.; Li, C. Variation of phenotypic traits of wild populations of Cypripedium japonicum in Zhejiang Province and its correlation with geographical-soil nutrient factors. J. Plant Resour. Environ. 2012, 21, 45–52. [Google Scholar]
- Hijmans, R.J.; Cameron, S.E.; Parra, J.L.; Jones, P.G.; Jarvis, A. Very high resolution interpolated climate surfaces for global land areas. Int. J. Climatol. 2005, 25, 1965–1978. [Google Scholar] [CrossRef]
- Buri, A.; Cianfrani, C.; Pinto-Figueroa, E.; Yashiro, E.; Spangenberg, J.E.; Adatte, T.; Verrecchia, E.; Guisan, A.; Pradervand, J.-N. Soil factors improve predictions of plant species distribution in a mountain environment. Prog. Phys. Geogr. 2017, 41, 703–722. [Google Scholar] [CrossRef]
- Watanabe, S.; Hajima, T.; Sudo, K.; Nagashima, T.; Takemura, T.; Okajima, H.; Nozawa, T.; Kawase, H.; Abe, M.; Yokohata, T.; et al. MIROC-ESM: Model description and basic results of CMIP5-20c3m experiments. Geosci. Model Dev. Discuss. 2011, 4, 1063–1128. [Google Scholar] [CrossRef] [Green Version]
- Gent, P.R.; Danabasoglu, G.; Donner, L.J.; Holland, M.M.; Hunke, E.C.; Jayne, S.R.; Lawrence, D.M.; Neale, R.B.; Rasch, P.J.; Vertenstein, M.; et al. The Community Climate System Model Version 4. J. Clim. 2011, 24, 4973–4991. [Google Scholar] [CrossRef]
- Tian, Z.; Jiang, D. Evaluation of the performance of low-to high-resolution CCSM4 over East Asia and China. Chin. J. Atmos. Sci. 2013, 37, 171–186. [Google Scholar] [CrossRef]
- Intergovernmental Panel on Climate Change. Climate Change 2013: The Physical Science Basis. Contribution of Working Group I to the Fifth Assessment Report of the Intergovernmental Panel on Climate Change; Cambridge University Press: Cambridge, UK, 2014. [Google Scholar]
- Graham, M.H. Confronting multicollinearity in ecological multiple regression. Ecology 2003, 84, 2809–2815. [Google Scholar] [CrossRef] [Green Version]
- De Marco, P.J.; Nóbrega, C.C. Evaluating collinearity effects on species distribution models: An approach based on virtual species simulation. PLoS ONE 2018, 13, e0202403. [Google Scholar] [CrossRef]
- Mansfield, E.R.; Helms, B.P. Detecting Multicollinearity. Am. Stat. 1982, 36, 158–160. [Google Scholar] [CrossRef]
- R Core Team. R: A Language and Environment for Statistical Computing; R Foundation for Statistical Computing: Vienna, Austria, 2020. [Google Scholar]
- Barbosa, A.M.; O’Hara, R.B. FuzzySim: Applying fuzzy logic to binary similarity indices in ecology. Methods Ecol. Evol. 2015, 6, 853–858. [Google Scholar] [CrossRef]
- Watling, J.I.; Brandt, L.A.; Bucklin, D.N.; Fujisaki, I.; Mazzotti, F.J.; Romañach, S.S.; Speroterra, C. Performance metrics and variance partitioning reveal sources of uncertainty in species distribution models. Ecol. Modell. 2015, 309–310, 48–59. [Google Scholar] [CrossRef]
- Thuiller, W.; Lafourcade, B.; Engler, R.; Araújo, M.B. BIOMOD—A platform for ensemble forecasting of species distributions. Ecography 2009, 32, 369–373. [Google Scholar] [CrossRef]
- Barbet-Massin, M.; Jiguet, F.; Albert, C.H.; Thuiller, W. Selecting pseudo-absences for species distribution models: How, where and how many? Methods Ecol. Evol. 2012, 3, 327–338. [Google Scholar] [CrossRef]
- Cohen, J. A coefficient of agreement for nominal scales. Educ. Psychol. Meas. 1960, 20, 37–46. [Google Scholar] [CrossRef]
- Allouche, O.; Tsoar, A.; Kadmon, R. Assessing the accuracy of species distribution models: Prevalence, kappa and the true skill statistic (TSS). J. Appl. Ecol. 2006, 43, 1223–1232. [Google Scholar] [CrossRef]
- Swets, J.A. Measuring the accuracy of diagnostic systems. Science 1988, 240, 1285. [Google Scholar] [CrossRef] [Green Version]
- Qin, Z.; Zhang, J.E.; Jiang, Y.P.; Wang, R.L.; Wu, R.S. Predicting the potential distribution of Pseudomonas syringae pv. actinidiae in China using ensemble models. Plant Pathol. 2020, 69, 120–131. [Google Scholar] [CrossRef]
- Brown, J.L.; Anderson, B. SDMtoolbox: A python-based GIS toolkit for landscape genetic, biogeographic and species distribution model analyses. Methods Ecol. Evol. 2014, 5, 694–700. [Google Scholar] [CrossRef]
- Cassini, M.H. Ranking threats using species distribution models in the IUCN Red List assessment process. Biodivers. Conserv. 2011, 20, 3689–3692. [Google Scholar] [CrossRef]
- Hamid, M.; Khuroo, A.A.; Charles, B.; Ahmad, R.; Singh, C.P.; Aravind, N.A. Impact of climate change on the distribution range and niche dynamics of Himalayan birch, a typical treeline species in Himalayas. Biodivers. Conserv. 2018, 28, 2345–2370. [Google Scholar] [CrossRef]
- Mainali, K.P.; Warren, D.L.; Dhileepan, K.; McConnachie, A.; Strathie, L.; Hassan, G.; Karki, D.; Shrestha, B.B.; Parmesan, C. Projecting future expansion of invasive species: Comparing and improving methodologies for species distribution modeling. Glob. Chang. Biol. 2015, 21, 4464–4480. [Google Scholar] [CrossRef]
- Shrestha, U.B.; Sharma, K.P.; Devkota, A.; Siwakoti, M.; Shrestha, B.B. Potential impact of climate change on the distribution of six invasive alien plants in Nepal. Ecol. Indic. 2018, 95, 99–107. [Google Scholar] [CrossRef]
- Lang, K.Y.; Chen, X.Q.; Luo, Y.B.; Zhu, G.H. Flora of China; Science Press: Beijing, China, 1999; Volume 17, p. 41. [Google Scholar]
- Arslan, E.S.; Akyol, A.; Örücü, Ö.K.; Sarıkaya, A.G. Distribution of rose hip (Rosa canina L.) under current and future climate conditions. Reg. Environ. Chang. 2020, 20, 107. [Google Scholar] [CrossRef]
- Li, X. Genetic Diversity and Phylogeography of a Rare Endemic Orchid: Cypripedium japonicum Thunb in East Asia. Master’s Thesis, East China Normal University, Shanghai, China, 2014. [Google Scholar]
- Guo, Y.; Bi, S.B.; Zhang, Y.Q.; Huang, J.L. Estimation and analysis for geographic and orographic influences on precipitation distribution on the yangtze plain, middle and lower. Sci. Tech. Eng. 2013, 13, 8555–8560. [Google Scholar] [CrossRef]
- Zhang, K.; Zhang, Y.; Zhou, C.; Meng, J.; Sun, J.; Zhou, T.; Tao, J. Impact of climate factors on future distributions of Paeonia ostii across China estimated by MaxEnt. Ecol. Inform. 2019, 50, 62–67. [Google Scholar] [CrossRef]
- Thuiller, W.; Albert, C.; Araújo, M.B.; Berry, P.M.; Cabeza, M.; Guisan, A.; Hickler, T.; Midgley, G.F.; Paterson, J.; Schurr, F.M.; et al. Predicting global change impacts on plant species’ distributions: Future challenges. Perspect. Plant Ecol. Evol. Syst. 2008, 9, 137–152. [Google Scholar] [CrossRef]
- Woodward, F.I.; Lomas, M.R.; Kelly, C.K. Global climate and the distribution of plant biomes. Philos. Trans. R. Soc. Lond. B Biol. Sci. 2004, 359, 1465–1476. [Google Scholar] [CrossRef] [PubMed] [Green Version]
- Pearson, R.G.; Dawson, T.P. Predicting the impacts of climate change on the distribution of species: Are bioclimate envelope models useful? Glob. Ecol. Biogeogr. 2003, 12, 361–371. [Google Scholar] [CrossRef] [Green Version]
- Scott, J.M.; Heglund, P.; Morrison, M.L. Predicting Species Occurrences: Issues of Accuracy and Scale; Island Press: Washington, DC, USA, 2002. [Google Scholar]
- Puchałka, R.; Dyderski, M.K.; Vítková, M.; Sádlo, J.; Klisz, M.; Netsvetov, M.; Prokopuk, Y.; Matisons, R.; Mionskowski, M.; Wojda, T.; et al. Black locust (Robinia pseudoacacia L.) range contraction and expansion in Europe under changing climate. Glob. Chang. Biol. 2021, 27, 1587–1600. [Google Scholar] [CrossRef]
- Dyderski, M.K.; Paź, S.; Frelich, L.E.; Jagodziński, A.M. How much does climate change threaten European forest tree species distributions? Glob. Chang. Biol. 2018, 24, 1150–1163. [Google Scholar] [CrossRef]
- Duputié, A.; Zimmermann, N.E.; Chuine, I. Where are the wild things? Why we need better data on species distribution. Glob. Ecol. Biogeogr. 2014, 23, 457–467. [Google Scholar] [CrossRef]
- Li, J.; Fan, G.; He, Y. Predicting the current and future distribution of three Coptis herbs in China under climate change conditions, using the MaxEnt model and chemical analysis. Sci. Total. Environ. 2020, 698, 134141. [Google Scholar] [CrossRef] [PubMed]
- Ding, Y.H.; Ren, G.Y.; Shi, G.Y.; Gong, P.; Zheng, X.H.; Zhai, P.M.; Zhang, D.E.; Zhao, Z.C.; Wang, S.W.; Wang, H.J. National assessment report of climate change (I): Climate change in China and its future trend. Adv. Clim. Chang. Res. 2006, 2, 3–8. [Google Scholar]
- Robbirt, K.M.; Roberts, D.L.; Hutchings, M.J.; Davy, A.J. Potential disruption of pollination in a sexually deceptive orchid by climatic change. Curr. Biol. 2014, 24, 2845–2849. [Google Scholar] [CrossRef] [Green Version]
- Bates, B.; Kundzewicz, Z.W.; Wu, S.; Palutikof, J. Climate Change and Water; Intergovernmental Panel on Climate Change Secretariat: Geneva, Switzerland, 2008. [Google Scholar]
- Jeon, C.W.; Kim, D.R.; Gang, G.H.; Kim, B.B.; Kim, N.H.; Nam, S.Y.; Kwak, Y.S. First report of gray mold disease on endangered species Cypripedium japonicum. MycoBiol. 2020, 48, 423–426. [Google Scholar] [CrossRef]
- Root, T.L.; Price, J.T.; Hall, K.R.; Schneider, S.H.; Rosenzweig, C.; Pounds, J.A. Fingerprints of global warming on wild animals and plants. Nature 2003, 421, 57–60. [Google Scholar] [CrossRef] [PubMed]
- Lenoir, J.; Gegout, J.C.; Marquet, P.A.; de Ruffray, P.; Brisse, H. A significant upward shift in plant species optimum elevation during the 20th century. Science 2008, 320, 1768–1771. [Google Scholar] [CrossRef] [PubMed]
- Smithson, A.; Macnair, M.R. Negative frequency-dependent selection by pollinators on artificial flowers without rewards. Evolution 1997, 51, 715–723. [Google Scholar] [CrossRef]
Figure 1.
Occurrence records of Cypripedium japonicum in China. ① Xinjiang; ② Xizang; ③ Qinhai; ④ Gansu; ⑤ Sichuan; ⑥ Yunnan; ⑦ Guizhou; ⑧ Chongqing; ⑨ Shannxi; ⑩ Ningxia; ⑪ Neimenggu; ⑫ Shanxi; ⑬ Henan; ⑭ Hubei; ⑮ Hunan; ⑯ Guangxi; ⑰ Guangdong; ⑱ Jiangxi; ⑲ Fujian; ⑳ Anhui; ㉑ Zhejiang; ㉒ Jiangsu; ㉓ Shandong; ㉔ Hebei; ㉕ Liaoning; ㉖ Jilin; ㉗ Heilongjiang.

Figure 2.
Potentially suitable region of Cypripedium japonicum under current climate and four future climate scenarios: RCP4.5 and RCP8.5 for 2050 and 2070, respectively.
Figure 2.
Potentially suitable region of Cypripedium japonicum under current climate and four future climate scenarios: RCP4.5 and RCP8.5 for 2050 and 2070, respectively.

Figure 3.
Dynamic changes in the potential suitable regions for Cypripedium japonicum under four future climate scenarios. The arrow indicates the magnitude and direction of the predicted change over time.
Figure 3.
Dynamic changes in the potential suitable regions for Cypripedium japonicum under four future climate scenarios. The arrow indicates the magnitude and direction of the predicted change over time.


Table 1.
List of 28 environmental variables used in the model development. The variables selected for analysis are marked with an asterisk (*).
Table 1.
List of 28 environmental variables used in the model development. The variables selected for analysis are marked with an asterisk (*).
| Type | Code | Description | Unit |
|---|---|---|---|
| Bioclimatic factors | Bio01 | Annual mean temperature | °C |
| Bio02 | Mean diurnal range (Mean of monthly (max temp–min temp)) | °C | |
| Bio03 * | Isothermality (Bio02/Bio07) (* 100) | - | |
| Bio04 | Temperature seasonality (standard deviation * 100) | °C | |
| Bio05 | Max temperature of warmest month | °C | |
| Bio06 | Min temperature of coldest month | °C | |
| Bio07 | Temperature annual range (Bio05-Bio06) | °C | |
| Bio08 * | Mean temperature of wettest quarter | °C | |
| Bio09 * | Mean temperature of driest quarter | °C | |
| Bio10 | Mean temperature of warmest quarter | °C | |
| Bio11 | Mean temperature of coldest quarter | °C | |
| Bio12 | Annual precipitation | mm | |
| Bio13 | Precipitation of wettest month | mm | |
| Bio14 | Precipitation of driest month | mm | |
| Bio15 * | Precipitation seasonality (Coefficient of Variation) | 1 | |
| Bio16 | Precipitation of wettest quarter | mm | |
| Bio17 | Precipitation of driest quarter | mm | |
| Bio18 * | Precipitation of warmest quarter | mm | |
| Bio19 * | Precipitation of coldest quarter | mm | |
| Topographic factors | Alt | Altitude | m |
| Aspect * | Aspect | % | |
| Slope * | Slope | ° | |
| Edaphic factors | T_CaCO3 * | Topsoil calcium carbonate | % weight |
| T_Clay * | Topsoil clay fraction | % wt. | |
| T_Gravel * | Topsoil gravel content | % vol. | |
| T_OC * | Topsoil organic carbon | % weight | |
| T_Sand * | Topsoil sand fraction | % wt. | |
| T_PH | Topsoil pH (H2O) | −log(H+) |
Table 2.
Evaluation statistics for each modelling algorithm and the ensemble model.
| Model | TSS | Kappa | ROC |
|---|---|---|---|
| Random forest (RF) | 0.915 | 0.847 | 0.983 |
| Generalized boosting model (GBM) | 0.906 | 0.824 | 0.981 |
| Generalized linear model (GLM) | 0.903 | 0.806 | 0.973 |
| Multiple adaptive regression splines (MARS) | 0.903 | 0.818 | 0.970 |
| Maximum entropy (Maxent) | 0.888 | 0.797 | 0.966 |
| Flexible discriminant analysis (FDA) | 0.866 | 0.784 | 0.965 |
| Artificial neural network (ANN) | 0.823 | 0.692 | 0.933 |
| Classification tree analysis (CTA) | 0.848 | 0.765 | 0.923 |
| Generalized additive model (GAM) | 0.777 | 0.744 | 0.893 |
| Surface range envelop (SRE) | 0.586 | 0.656 | 0.793 |
| Ensemble model | 0.968 | 0.906 | 0.995 |
Table 3.
Mean variable importance and percentage of 13 environmental variables included in the ensemble model for Cypripedium japonicum.
Table 3.
Mean variable importance and percentage of 13 environmental variables included in the ensemble model for Cypripedium japonicum.
| Code | Mean Variable Importance | Percentage |
|---|---|---|
| Bio18 | 0.7347 | 24.00% |
| Bio09 | 0.7161 | 23.39% |
| Bio15 | 0.5841 | 19.08% |
| Slope | 0.3669 | 11.98% |
| Bio03 | 0.3297 | 10.77% |
| Bio19 | 0.1579 | 5.16% |
| Bio08 | 0.0847 | 2.77% |
| T_Clay | 0.0267 | 0.87% |
| Aspect | 0.0156 | 0.51% |
| T_CaCO3 | 0.0153 | 0.50% |
| T_Gravel | 0.0144 | 0.47% |
| T_Sand | 0.0123 | 0.40% |
| T_OC | 0.0033 | 0.11% |
Table 4.
Different classes of potential suitable regions and their percentage change compared to current Cypripedium japonicum under current and four future climate scenarios. Up arrow (↑) means increase, down arrow (↓) means decrease.
Table 4.
Different classes of potential suitable regions and their percentage change compared to current Cypripedium japonicum under current and four future climate scenarios. Up arrow (↑) means increase, down arrow (↓) means decrease.
| Area (×105 km2) and Change (%) | Lowly Suitable | Moderately Suitable | Highly Suitable | Total | |||||
|---|---|---|---|---|---|---|---|---|---|
| Current | 9.66 | 2.70 | 4.53 | 16.89 | |||||
| RCP4.5 | 2050 | 10.84 | ↑12.19% | 4.02 | ↑49.32% | 2.49 | ↓44.95% | 17.36 | ↑2.79% |
| 2070 | 11.19 | ↑15.84% | 4.23 | ↑56.99% | 1.92 | ↓57.69% | 17.34 | ↑2.68% | |
| RCP8.5 | 2050 | 11.66 | ↑20.65% | 4.45 | ↑65.28% | 2.27 | ↓49.98% | 18.38 | ↑8.83% |
| 2070 | 13.63 | ↑41.03% | 4.49 | ↑66.58% | 1.26 | ↓72.24% | 19.37 | ↑14.72% | |
Table 5.
Dynamic changes in the potential suitable regions for Cypripedium japonicum under four future climate scenarios.
Table 5.
Dynamic changes in the potential suitable regions for Cypripedium japonicum under four future climate scenarios.
| Area (×105 km2) | Current-RCP4.5 | Current-RCP8.5 | ||
|---|---|---|---|---|
| 2050 | 2070 | 2050 | 2070 | |
| Increased | 2.41 | 3.24 | 3.74 | 5.80 |
| Decreased | 2.36 | 3.17 | 2.78 | 3.84 |
| Unchanged | 14.53 | 13.72 | 14.11 | 13.05 |
Publisher’s Note: MDPI stays neutral with regard to jurisdictional claims in published maps and institutional affiliations. |
© 2021 by the authors. Licensee MDPI, Basel, Switzerland. This article is an open access article distributed under the terms and conditions of the Creative Commons Attribution (CC BY) license (https://creativecommons.org/licenses/by/4.0/).
Share and Cite
MDPI and ACS Style
Xu, Y.; Huang, Y.; Zhao, H.; Yang, M.; Zhuang, Y.; Ye, X. Modelling the Effects of Climate Change on the Distribution of Endangered Cypripedium japonicum in China. Forests 2021, 12, 429. https://doi.org/10.3390/f12040429
AMA Style
Xu Y, Huang Y, Zhao H, Yang M, Zhuang Y, Ye X. Modelling the Effects of Climate Change on the Distribution of Endangered Cypripedium japonicum in China. Forests. 2021; 12(4):429. https://doi.org/10.3390/f12040429
Chicago/Turabian StyleXu, Yadong, Yi Huang, Huiru Zhao, Meiling Yang, Yuqi Zhuang, and Xinping Ye. 2021. "Modelling the Effects of Climate Change on the Distribution of Endangered Cypripedium japonicum in China" Forests 12, no. 4: 429. https://doi.org/10.3390/f12040429
Note that from the first issue of 2016, this journal uses article numbers instead of page numbers. See further details here.