 Sandra I. Vera-Paz1,2†
 Daniel D. Díaz Contreras Díaz1,2†
 Matthias Jost3
 Stefan Wanke1,3
 Andrés J. Rossado4
 Rebeca Hernández-Gutiérrez1,5
 Gerardo A. Salazar1
 Susana Magallón1
 Eric J. Gouda6
 Ivón M. Ramírez-Morillo7
 Sabina Donadío8
 Carolina Granados Mendoza1,3*
- 1Departamento de Botánica, Instituto de Biología, Universidad Nacional Autónoma de México, Mexico City, Mexico
- 2Posgrado en Ciencias Biológicas, Universidad Nacional Autónoma de México, Mexico City, Mexico
- 3Institut für Botanik, Technische Universität Dresden, Dresden, Germany
- 4Laboratorio de Sistemática de Plantas Vasculares, Facultad de Ciencias, Universidad de la República, Montevideo, Uruguay
- 5Department of Evolution, Ecology, and Organismal Biology, University of California, Riverside, Riverside, CA, United States
- 6Botanical Garden, Utrecht University, Utrecht, Netherlands
- 7Herbario CICY, Centro de Investigación Científica de Yucatán, A.C. (CICY), Yucatán, Mexico
- 8Instituto de Botánica Darwinion (CONICET-ANCEFN), Buenos Aires, Argentina
Full plastome sequences for land plants have become readily accessible thanks to the development of Next Generation Sequencing (NGS) techniques and powerful bioinformatic tools. Despite this vast amount of genomic data, some lineages remain understudied. Full plastome sequences from the highly diverse (>1,500 spp.) subfamily Tillandsioideae (Bromeliaceae, Poales) have been published for only three (i.e., Guzmania, Tillandsia, and Vriesea) out of 22 currently recognized genera. Here, we focus on core Tillandsioideae, a clade within subfamily Tillandsioideae, and explore the contribution of individual plastid markers and data categories to inform deep divergences of a plastome phylogeny. We generated 37 high quality plastome assemblies and performed a comparative analysis in terms of plastome structure, size, gene content and order, GC content, as well as number and type of repeat motifs. Using the obtained phylogenetic context, we reconstructed the evolution of these plastome attributes and assessed if significant shifts on the evolutionary traits’ rates have occurred in the evolution of the core Tillandsioideae. Our results agree with previously published phylogenetic hypotheses based on plastid data, providing stronger statistical support for some recalcitrant nodes. However, phylogenetic discordance with previously published nuclear marker-based hypotheses was found. Several plastid markers that have been consistently used to address phylogenetic relationships within Tillandsioideae were highly informative for the retrieved plastome phylogeny and further loci are here identified as promising additional markers for future studies. New lineage-specific plastome rearrangements were found to support recently adopted taxonomic groups, including large inversions, as well as expansions and contractions of the inverted repeats. Evolutionary trait rate shifts associated with changes in size and GC content of the plastome regions were found across the phylogeny of core Tillandsioideae.
Introduction
Complete plastome sequences for more than 10,300 vascular plant species have been made publicly available at the National Center for Biotechnology Information until March 2022 (NCBI, only verified and circular DNA sequences considered). This wealth of genomic resources has not only greatly improved our knowledge of the plant tree of life and the evolutionary processes that shape plant diversity (e.g., Ruhfel et al., 2014; Li et al., 2021), but also eased the study of patterns of plastome diversity and evolution across plant lineages (e.g., Jansen et al., 2007; Zhu et al., 2016).
Despite the vast number of currently available vascular plant plastomes, most of which belong to flowering plants (Mower and Vickrey, 2018), plastome diversity for certain angiosperm families remains poorly explored. Full plastome sequences from the highly diverse monocot family Bromeliaceae (Poales, 3,714 spp.; Gouda et al., 2018) have been published for only 13 species and one hybrid cultivar (Nashima et al., 2015; Redwan et al., 2015; Poczai and Hyvönen, 2017; Paule et al., 2020; Chávez-Galarza et al., 2021; Möbus et al., 2021; Wu et al., 2022), representing three (Bromelioideae, Puyoideae, and Tillandsioideae) out of the eight Bromeliaceae subfamilies (Givnish et al., 2007). In 2015, two independent research groups published the first Bromeliaceae plastomes, both from pineapple (Ananas comosus, Bromelioideae; Nashima et al., 2015; Redwan et al., 2015), and one year later a third A. comosus plastome was published by Liu et al. (2016). Poczai and Hyvönen (2017) published the Spanish moss (Tillandsia usneoides, Tillandsioideae) plastome, reporting a highly conserved structure, gene content and gene order relative to the plastome of the distantly related A. comosus. Additional plastomes were published for three Bromelioideae species of the Fascicularia-Ochagavia group (i.e., Fascicularia bicolor, Ochagavia carnea, and Ochagavia elegans) and Puya mirabilis (Puyoideae) by Paule et al. (2020). These authors also reported overall conserved structural properties relative to the previously published A. comosus plastomes. However, two expansions of the inverted repeat (IR) at the border of the IR and the large single copy (LSC) were identified for F. bicolor and O. carnea, where the rps3 gene of F. bicolor, and the rps3, rpl14, rpl16, and partial rps8 genes of O. carnea are translocated from the LSC to the IR relative to other Bromelioideae. Chávez-Galarza et al. (2021) and Möbus et al. (2021) published plastomes for Tillandsia landbeckii and for Tillandsia espinosae, Tillandsia malzinei, and Tillandsia purpurea, respectively, reporting similar structural and gene content properties to the previously published T. usneoides plastome. A recent phylogenetic study by Wu et al. (2022) focusing on the order Poales, contributed four additional Bromeliaceae plastomes, belonging to the subfamilies Bromelioideae (Cryptanthus acaulis and Neoregelia sp.) and Tillandsioideae (Guzmania conifera and Vriesea × poelmanii), but no further comparison to other previously published Bromeliaceae plastomes was provided.
The present study focuses on core Tillandsioideae, a clade within subfamily Tillandsioideae from which over 1,500 spp. have been described (Gouda et al., 2018). Classification of subfamily Tillandsioideae was significantly restructured in the taxonomic revision of Barfuss et al. (2016), where monophyletic units, identified on a molecular phylogeny, were circumscribed by synapomorphic combinations of diagnostic morphological characters, including sepal symmetry; corolla morphology; petal connation/conglutination; presence/absence of petal appendages; filaments connation and adnation to petals; pollen type; ovary position; stigma type; presence/absence of ovule appendages and, when present, their size relative to the ovary; and seed appendage type. The 22 currently recognized genera (including Waltillia; Leme et al., 2017) are classified into four tribes: Catopsideae (18 spp. and 1 genus), Glomeropitcairnieae (2 spp. and 1 genus), Tillandsieae (1,094 spp. and 8 genera), and Vrieseeae, the latter further divided in subtribes Vrieseinae (299 spp. and 4 genera) and Cipuropsidinae (117 spp. and 8 genera; Barfuss et al., 2016; species numbers according to Gouda et al., 2018). As recovered by Barfuss et al. (2016), tribes Catopsideae (Catopsis) and Glomeropitcairnieae (Glomeropitcairnia) conform the non-core Tillandsioideae clade, whereas the core Tillandsioideae clade is integrated by tribes Tillandsieae and Vrieseeae, and includes the genera Alcantarea (46 spp.), Barfussia (5 spp.), Cipuropsis (3 spp.), Goudaea (2 spp.), Gregbrownia (4 spp.), Guzmania (217 spp.), Jagrantia (1 sp.), Josemania (5 spp.), Lemeltonia (7 spp.), Lutheria (4 spp.), Mezobromelia (6 spp.), Pseudalcantarea (3 spp.), Racinaea (83 spp.), Stigmatodon (20 spp.), Tillandsia (770 spp.), Vriesea (231 spp.), Wallisia (5 spp.), Waltillia (2 spp.), Werauhia (96 spp.), and Zizkaea (1 sp.). Additional species and genera complexes were recognized by Barfuss et al. (2016), but formal taxonomic changes for these groups await for key taxa to be sampled (e.g., the Cipuropsis-Mezobromelia complex) or increased phylogenetic support to be achieved (e.g., Tillandsia biflora complex).
Tillandsioideae phylogenetics, and in general in Bromeliaceae, has heavily relied on Sanger sequenced data, either from plastid, nuclear-ribosomal, or nuclear low copy loci that have been employed from deep to shallow taxonomic levels (Terry et al., 1997; Barfuss et al., 2005, 2016; Granados Mendoza, 2008; Chew et al., 2010; Versieux et al., 2012; Donadío, 2013; Castello et al., 2016; Pinzón et al., 2016; Leme et al., 2017; Kessous et al., 2020; Donadío et al., in press). Recent studies have applied with great success Next Generation Sequencing (NGS) strategies to Tillandsioideae phylogenetics. Machado et al. (2020) used genome skimming to mine plastid protein-coding genes and the low copy nuclear phyC gene for a comprehensive sample of tribe Vrieseeae and a representation of tribe Tillandsieae. Then, Loiseau et al. (2021) expanded the plastid genomic dataset of Machado et al. (2020), by mining additional nuclear and mitochondrial loci for an increased taxon sampling. Lastly, Yardeni et al. (2022) explored the utility of two nuclear target capture kits to resolve phylogenetic relationships in Bromeliaceae, including 56 species of the subfamily Tillandsioideae.
Bromeliaceae are known for their low substitution rates compared to other Poales (Smith and Donoghue, 2008). Therefore, phylogenetic resolution and support in core Tillandsioideae could benefit from the inclusion of NGS based data, as demonstrated by the studies of Machado et al. (2020); Loiseau et al. (2021), and Yardeni et al. (2022). To our knowledge, no study has explored plastome diversity and evolution on a representative taxon sampling of the core Tillandsioideae, since full plastome sequences are only available for three (i.e., Guzmania, Tillandsia, and Vriesea) of the 22 currently recognized genera of the entire subfamily.
In the present study, we generate high quality plastome assemblies and perform a comparative analysis in terms of plastome structure, size, gene content and order, GC content, as well as number and type of repeat motifs. Additionally, we explore the contribution of individual plastid markers for resolving deeper-level divergences in the obtained plastome-based phylogenetic framework of the core Tillandsioideae and assess the phylogenetic informativeness (PI) of plastid data categories, such as coding and non-coding loci. Based on the retrieved phylogenetic context, we reconstruct the evolution of selected plastome attributes and determine if significant shifts on their evolutionary rates have occurred during the evolution of the core Tillandsioideae.
Materials and methods
Taxon sampling
Plastomes of 35 species of Tillandsioideae were newly sequenced and assembled for this study. The sampling was expanded with genome skimming data publicly available at the NCBI Sequence Read Archive (SRA), resulting in two additional, complete, and newly assembled Tillandsioideae plastomes (Supplementary Material 1). Species were selected to best represent main lineages within core Tillandsioideae, including 14 out of 20 of its currently recognized genera. Tribe Tillandsieae was represented by species of the genera Barfussia (1 sp.), Guzmania (1 sp.), Lemeltonia (1 sp.), Pseudalcantarea (2 spp.), Racinaea (1 sp.), Tillandsia (21 spp.), and Wallisia (1 sp.). Sampling within genus Tillandsia included representatives of the subgenera Aerobia (1 sp.), Anoplophytum (1 sp.), Diaphoranthema (1 spp.), Phytarrhiza (1 sp.), Pseudovriesea (2 spp.), Tillandsia (7 spp.), and Viridantha (1 sp.), as well as the species complexes of Tillandsia australis (1 sp.), T. biflora (2 spp.), Tillandsia disticha (1 sp.), Tillandsia gardneri (1 sp.), T. purpurea (1 sp.), and Tillandsia sphaerocephala (1 sp.). Tribe Vrieseeae subtribe Cipuropsidinae was represented by one species for each of the genera Goudaea, Lutheria, Mezobromelia, Werauhia, and Zizkaea, whereas tribe Vrieseeae subtribe Vrieseinae was represented by the genera Alcantarea (1 sp.), and Vriesea s.s. (2 spp., sensu Machado et al., 2020). Catopsis sessiliflora of tribe Catopsideae (non-core Tillandsioideae) was used to root the phylogenetic tree, following phylogenetic relationships reported by Barfuss et al. (2016). The six non-sampled core Tillandsioideae genera include Andean Gregbrownia, Josemania from Costa Rica, Panama, Colombia, Ecuador and Peru, Cipuropsis from the northern Andes to Venezuela, Trinidad, and the Guianas, Jagrantia from Central America to Colombia, and Brazilian Stigmatodon, and Waltillia (Barfuss et al., 2016; Leme et al., 2017). Taxonomy follows Barfuss et al. (2016) and Gouda et al. (2018).
DNA extraction
Genomic DNA was extracted from silica-gel dried leaf tissue using the DNeasy Plant Pro Kit (Qiagen) or a standard CTAB method following Doyle and Doyle (1987), the latter modified to include a treatment with RNase A (Qiagen, 100 mg/ml) and proteinase K (Thermo Scientific,™ 1 mg/ml). DNA concentration was quantified with a Qubit™ fluorometer v.3.0 (Invitrogen,™ Thermo Fisher Scientific), using the Qubit™ dsDNA BR Assay Kit (Invitrogen,™ Thermo Fisher Scientific). DNA purity was assessed with a Nanodrop 2000 spectrophotometer (Thermo Scientific™), ensuring 260/280 ratios ≥1. The molecular weight of the genomic DNA was evaluated in 1% agarose test gels, run for 50 min at 85 V and 500 mA.
DNA library preparation, enrichment, and sequencing
Herein newly sequenced plastomes were generated from raw data derived from a Hyb-Seq project that uses the universal probe kit for angiosperms of Buddenhagen et al. (2016), modified to include additional sequences of Bromeliaceae representatives. Library preparation, enrichment and sequencing was performed by Daicel Arbor Biosciences1 as follows. Samples were quantified via a spectrofluorimetric assay with PicoGreen (ThermoFisher Scientific). Genomic DNA was sheared with a Qsonica Q800 ultrasonicator to produce insert lengths of approximately 300–800 nt. Library preparation followed a proprietary modification by Daicel Arbor Biosciences of the KAPA HyperPrep kit (Roche). Custom unique dual-index combinations were added to each sample via 6–10 cycles of PCR amplification. The indexed libraries were quantified with both a spectrofluorimetric assay and a quantitative PCR assay using a KAPA Library Quantification Kit (Roche). Capture pools were prepared from 200 ng of 12 or 13 libraries per reaction and each capture pool was reduced to 7 μL by vacuum centrifugation. Capture was performed following the myBaits v.5 protocol2 with an overnight hybridization and washes at 60°C. Post-capture, the reactions were amplified for 12 cycles and were quantified with spectrofluorimetric and quantitative PCR assays. The captures were pooled in approximately equimolar ratios based on the number of libraries in each capture. A second equimolar pool of non-captured libraries was prepared. The captured and non-captured pools were combined at a 70:30 ratio. Samples were sequenced on the Illumina NovaSeq 6000 platform on S4 PE150 lanes to approximately 2 Gbp per library.
Plastome assembly and annotation
Two de novo assembly strategies were applied for a subset of samples (i.e., Pseudalcantarea macropetala, Tillandsia imperialis, Tillandsia utriculata, and Vriesea sucrei) in order to validate our methods. In the first strategy, paired reads of each accession were de novo assembled in CLC Genomics Workbench v.11.0,3 allowing for automatic word and bubble size, as well as an auto-detection of paired distances. Reads were mapped back to the contigs and the resulting read mapping files were visualized in Tablet v.1.21.02.08 (Milne et al., 2013) to evaluate correctness of the assembly, contig coverage and to detect potential mis-assemblies. Contigs of possible plastome origin were mined out of the full assembly via a custom BLAST in Geneious Prime® 2021.2.2,4 with a max E-value = 1e−10 and a word size of 28, using a database (Supplementary Material 2) consisting of 47 complete angiosperm plastomes, including A. comosus (KR336549.1) and T. usneoides (KY293680.1), publicly available in GenBank. Further scaffolding was performed in Geneious Prime®.
The de novo assembler GetOrganelle v.1.7.5 (Jin et al., 2020) was used as our second assembly strategy, applying a K-mer gradient (-k 21,45,65,85,105) appropriate for 150 bp long paired data, up to 20 maximum extension runs, an automatically estimated word size and the default seed database (embplant_pt) to filter plastid-like reads. The generated plastomes were visualized in Bandage (Wick et al., 2015) and LSC, small single copy (SSC), and IR coverage was extracted from each corresponding graph segment. Of the two naturally existing isomeric plastome sequences (due to different orientations of the single copy regions; Palmer, 1983; Walker et al., 2015) we selected the one matching the published A. comosus (KR336549.1) plastid genome for downstream analyses. Once results from both assembly strategies were cross-validated, assemblies of the remaining samples were only performed with GetOrganelle as described above.
Annotations from A. comosus (KR336549.1) and T. usneoides (KY293680.1) were first automatically transferred to the target species T. utriculata (the type species of genus Tillandsia) and then manually inspected in Geneious Prime®. The annotated and curated plastome sequence of T. utriculata was subsequently used as reference to automatically transfer annotations to the remaining plastomes, which were also manually curated. The tRNAscan-SE web server5 (Lowe and Chan, 2016; Chan and Lowe, 2019) was used with default settings to confirm and, where necessary, adjust the predicted tRNA gene borders during automatic annotation. Newly sequenced and assembled plastomes can be found in GenBank under the accession numbers ON398129–ON398163, whereas newly assembled plastomes from NCBI SRA data can be found in the Third Party Annotation Section of GenBank under the accession numbers TPA: BK061352-BK061353.
Plastomes comparison and repeat regions analyses
All assembled plastomes were compared for several attributes, including gene number, gene content, gene order, GC content, as well as overall, LSC, SSC, and IR size, and general structure in Geneious Prime® 2022.0.2 using standard tools. Major inversions detected during manual curation of the alignment referred in the next section were confirmed with the LASTZ plugin v.1.02.00 of Geneious Prime® using C. sessiliflora as target sequence and default settings. The MIcroSAtellite identification tool v.2.1 (MISA-web; Beier et al., 2017) was used for the detection of Simple Sequence Repeats (SSR), assuming a minimum number of repetitions of 10 for mononucleotide repeats, of six for dinucleotide repeats, and of five for tri-, tetra-, penta-, and hexanucleotide repeats, and 100 as maximum length of sequence between two SSRs to register as compound SSR. Tandem repeats were detected with Tandem Repeats Finder v.4.09.1 (Benson, 1999), applying default parameters. Both SSR and tandem repeat detection were performed on complete plastomes, distinguishing repeat motifs present in the IR regions, LSC and SSC.
Tree reconstruction
Complete plastomes were aligned with MAFFT v.7.487 (Katoh and Standley, 2013) and subsequently trimmed to only include one of the two IR copies for each species in the final alignment. The alignment was partitioned by protein-coding genes, tRNAs genes, rRNAs genes, introns, and intergenic spacers (IGS). Inversions were identified by eyeballing and included: (1) a large inversion (28,343 bp) found in the two Vriesea species spanning genes psbD to accD and a portion of each of the two flanking IGS; (2) a smaller inversion (2,222 bp) present in the two representatives of the T. biflora complex including the accD gene and partial rbcL-accD and accD-psaI IGS; and (3) several minor inversions (<200 bp) distributed across the alignment. Poorly aligned and divergent regions were identified with Gblocks (Castresana, 2000), setting the allowed gap positions parameter to the option “all.” Inversions and poorly aligned regions were excluded from further analyses using the -E command of RAxML v.8.2.10 (Stamatakis, 2014), which generates modified matrix and partition files. Phylogenetic inference was performed on this modified partitioned matrix under Maximum Likelihood (ML) in the IQ-TREE web server6 with an edge-linked partition model, and an automatic selection of the best-fit substitution model for the partitions. Node support was estimated based on 1,000 replicates of the ultrafast bootstrap approximation (UFBoot).
Estimation of phylogenetic informativeness
A PI (Townsend, 2007) analysis was carried out to assess the contribution of different plastid markers and data partitions in resolving the retrieved plastid phylogenetic relationships within core Tillandsioideae. The PI method (Townsend, 2007) quantifies the likelihood that a character changes at a certain point of a tree, remaining subsequently unchanged. This is estimated by comparing evolutionary changes across sites against an ideal change rate based on an ultrametric tree, where branches are proportional to evolutionary units. The tree resulting from the analysis detailed in the previous section was transformed to ultrametric with the function chronos of the R v.4.1.2 (R Core Team, 2021) package ape (Paradis and Schliep, 2019), setting the model of substitution rate variation among branches to be relaxed and the smoothing parameter lambda = 0. An arbitrary time scale from 0 at the tree tips to 100 at the root, and not from 0 to 1, was applied to avoid generating an ultrameric tree with branches of size close to zero that can cause problems in downstream analyses. Site substitution rates and net PI profiles of each locus were calculated in TAPIR7 using individual alignments corresponding to each data partition, along with the ultrametric tree. Maximum PI values and the time at which these values were reached were extracted to compare the phylogenetic utility of loci and data categories to inform the retrieved plastome phylogeny.
Ancestral state reconstruction of plastome attributes
Ancestral state reconstruction was performed for 20 continuous plastome attributes in R (R Core Team, 2021). The studied attributes included size, GC content, as well as number of SSR and tandem repeats per one kb, considering both the entire plastome and each of its regions (i.e., LSC, SSC, and IR). For the repeat motifs, distinction was also made between coding and non-coding regions. Ancestral states and their 95% confidence intervals at the nodes of the ultrametric Tillandsioideae tree were estimated under a ML framework with the functions fastAnc of the package phytools v.1.0-1 (Revell, 2012). The attributes were mapped on the ultrametric tree with the function contMap of phytools.
Additionally, we evaluated the presence of evolutionary rate shifts through time and among lineages of the analyzed plastome attributes. For this, we transformed attribute values to logarithmic scale to normalize their distribution. We implemented a Bayesian Analysis of Macroevolutionary Mixtures (BAMM v.2.5.0; Rabosky, 2014), which estimates phenotypic evolutionary rate under a compound Poisson process throughout the phylogeny. Using reversible-jump Markov Chain Monte Carlo (rjMCMC), BAMM evaluates different models that vary in the number of shifts in the evolutionary rate of a phenotypic trait or attribute. As opposed to diversification rate shifts, modeling of phenotypic evolutionary rate shifts in BAMM8 does not require accounting for incomplete taxon sampling. In this case, BAMM considers trait data to estimate and evaluate the potential shifts in the rate of evolution of the target phenotypic trait across the provided phylogeny. Furthermore, our taxon sampling was designed to best represent the main lineages of the Core Tillandsioideae and, although additional plastome diversity might still to be uncovered, our study includes nearly all the existing full plastomes for the focal group. Therefore, our analyses include a dense representation of the known plastome diversity to date. Prior settings suitable for our data set were first explored with the R package BAMMtools (Rabosky, 2014). BAMM analyses were performed with the selected priors and run for 20 million generations. Chain convergence was examined with the package coda (Plummer et al., 2006) and an Effective Sample Size (ESS) of the MCMC ≥200 was ensured. BAMM output was analyzed with BAMMtools in R to extract the number and probability of shifts in the evolutionary rate for each plastome attribute. When a shift or set of shifts was detected, a Maximum a posteriori probability (MAP) configuration was generated to visualize the number and location of the shifts.
Results
Tillandsioideae plastomes attributes
The newly assembled Tillandsioideae plastomes have an average coverage of 92.22×, ranging from 19.93× in Barfussia laxissima to 185.46× in T. utriculata. The plastomes are quadripartite and consist of one LSC and one SSC that are separated by two copies of an IR (Figure 1A and Supplementary Material 4). The average size of these plastomes is 156,606.5 bp, with Tillandsia gymnobotrya having the largest plastome (159,182 bp) and P. macropetala the smallest (143,799 bp). Average size of the LSC is 86,478.1 bp and ranges from 84,649 bp in Lemeltonia narthecioides to 98,667 bp in Pseudalcantarea viridiflora, whereas the average size of the SSC is 18,138.54 bp, with Tillandsia achyrostachys and Tillandsia ixioides having the smallest (16,946 bp) and the largest (18,655 bp) SSC, respectively. The smallest IR regions belong to P. macropetala (13,492 bp) and the largest to T. achyrostachys (27,957 bp), with 25,994.97 bp being the average size (Table 1 and Supplementary Material 5).
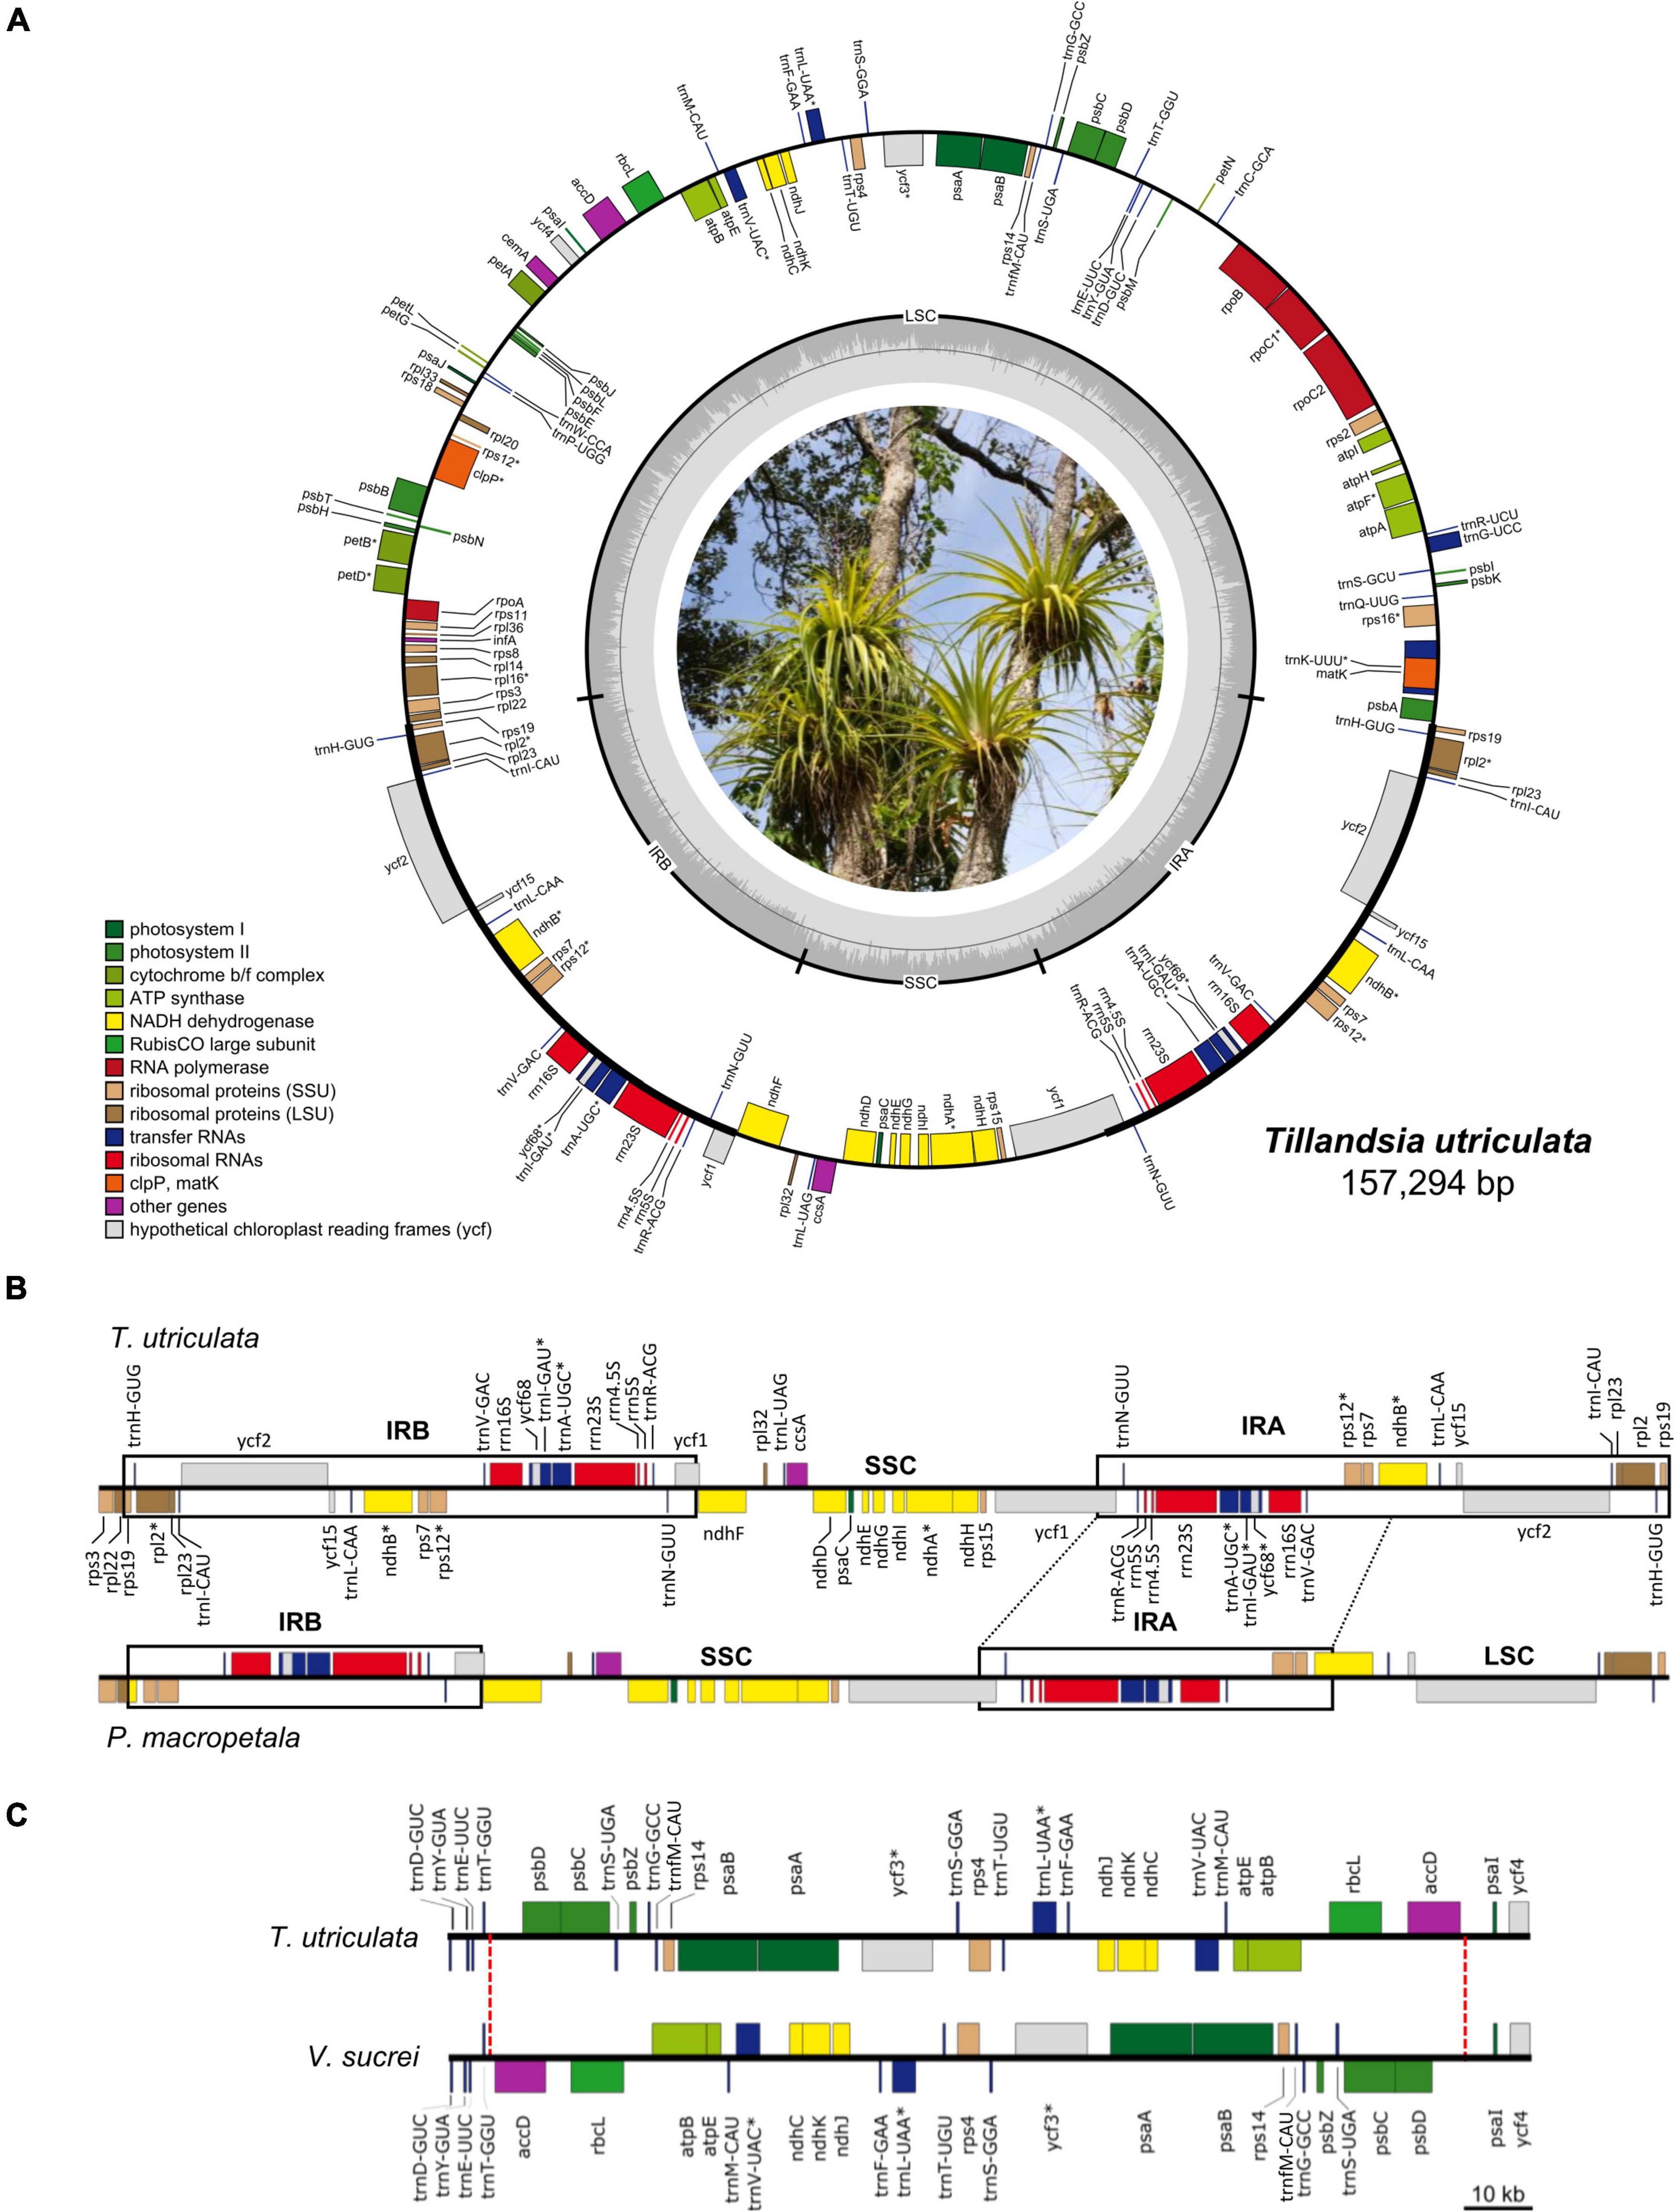
Figure 1. (A) Circular representation of the Tillandsia utriculata plastome (Photo credit: Juan Pablo Pinzón). Genes are color coded according to their functional category and GC content across the plastome is denoted by the innermost gray circle, with the 50% threshold of GC content marked by a thin gray line. Genes that are transcribed counter-clockwise and clockwise are displayed to the outside and the inside of the outer circle, respectively. Genes with introns are denoted by an asterisk (*). (B) Comparison of the IRB-SSC-IRA region between T. utriculata and Pseudalcantarea macropetala, the latter showing a marked IR reduction and associated LSC expansion. One partial (ndhB) and eight full (rpl2, rpl23, rps19, trnH-GUG, trnI-CAU, trnL-CAA, ycf15, and ycf2) genes are translocated from IR to the LSC region in Pseudalcantarea compared to other Tillandsioideae species. (C) Comparison of a portion of the LSC of T. utriculata and Vriesea sucrei. Vriesea species present a large inversion spanning from the partial trnT-accD IGS to the partial psbD-psaI IGS (27,080 bp in V. sucrei). The red dashed lines mark the boundaries of the inversion.
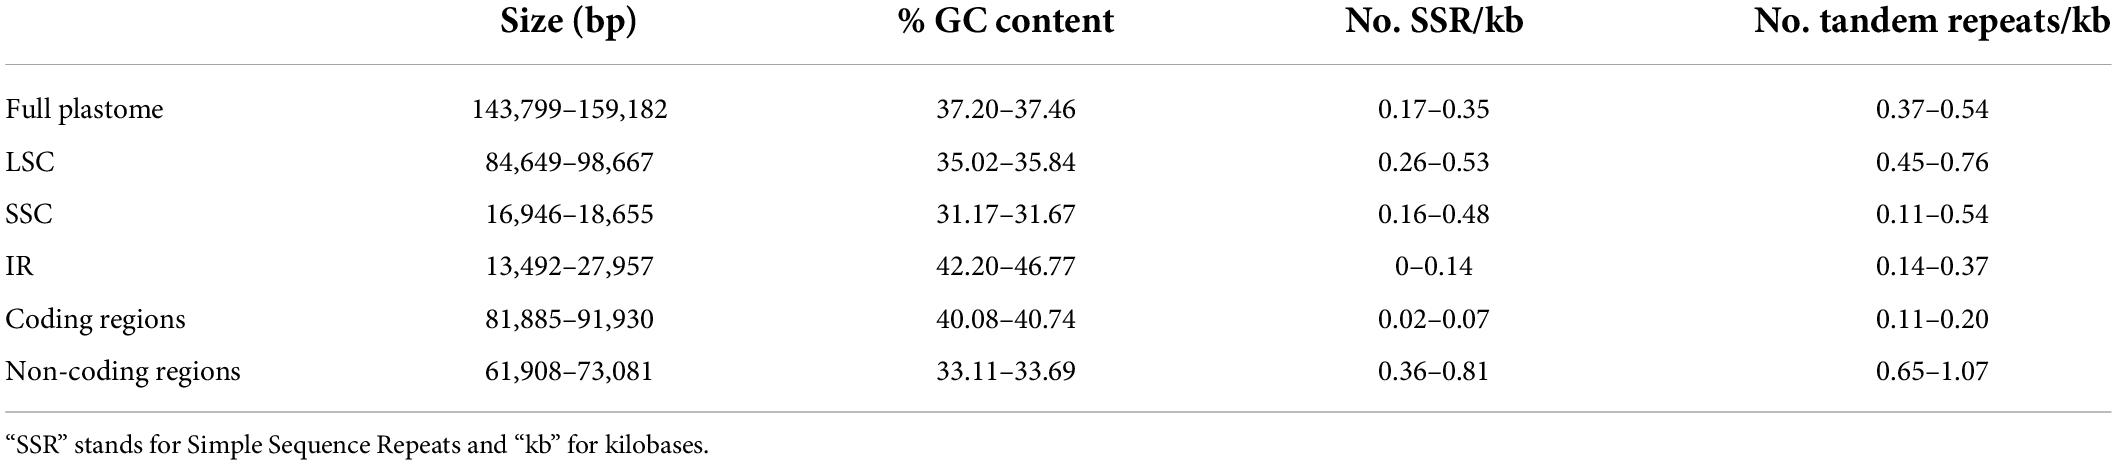
Table 1. Minimum and maximum values for the studied Tillandsioideae plastome attributes.
Gene content is identical in all the studied Tillandsioideae plastomes and includes 115 unique coding genes, of which 81 are protein-coding genes, 30 tRNA genes, and four rRNA genes (Table 2 and Supplementary Material 4). Each IR contains eight complete (rps19, rpl2, rpl23, ycf2, ycf15, ndhB, rps7, and ycf68) and two partial (rps12 and ycf1) protein-coding genes, eight tRNA genes (trnH-GUG, trnI-CAU, trnL-CAA, trnV-GAC, trnI-GAU, trnA-UGC, trnR-ACG, and trnN-GUU) and the four rRNA genes, except for the two Pseudalcantarea species that have shorter IRs, thereby having the rps19, trnH-GUG, rpl2, rpl23, trnI-CAU, ycf2, ycf15, and trnL-CAA genes and a truncated ndhB in the LSC instead (Figure 1B).
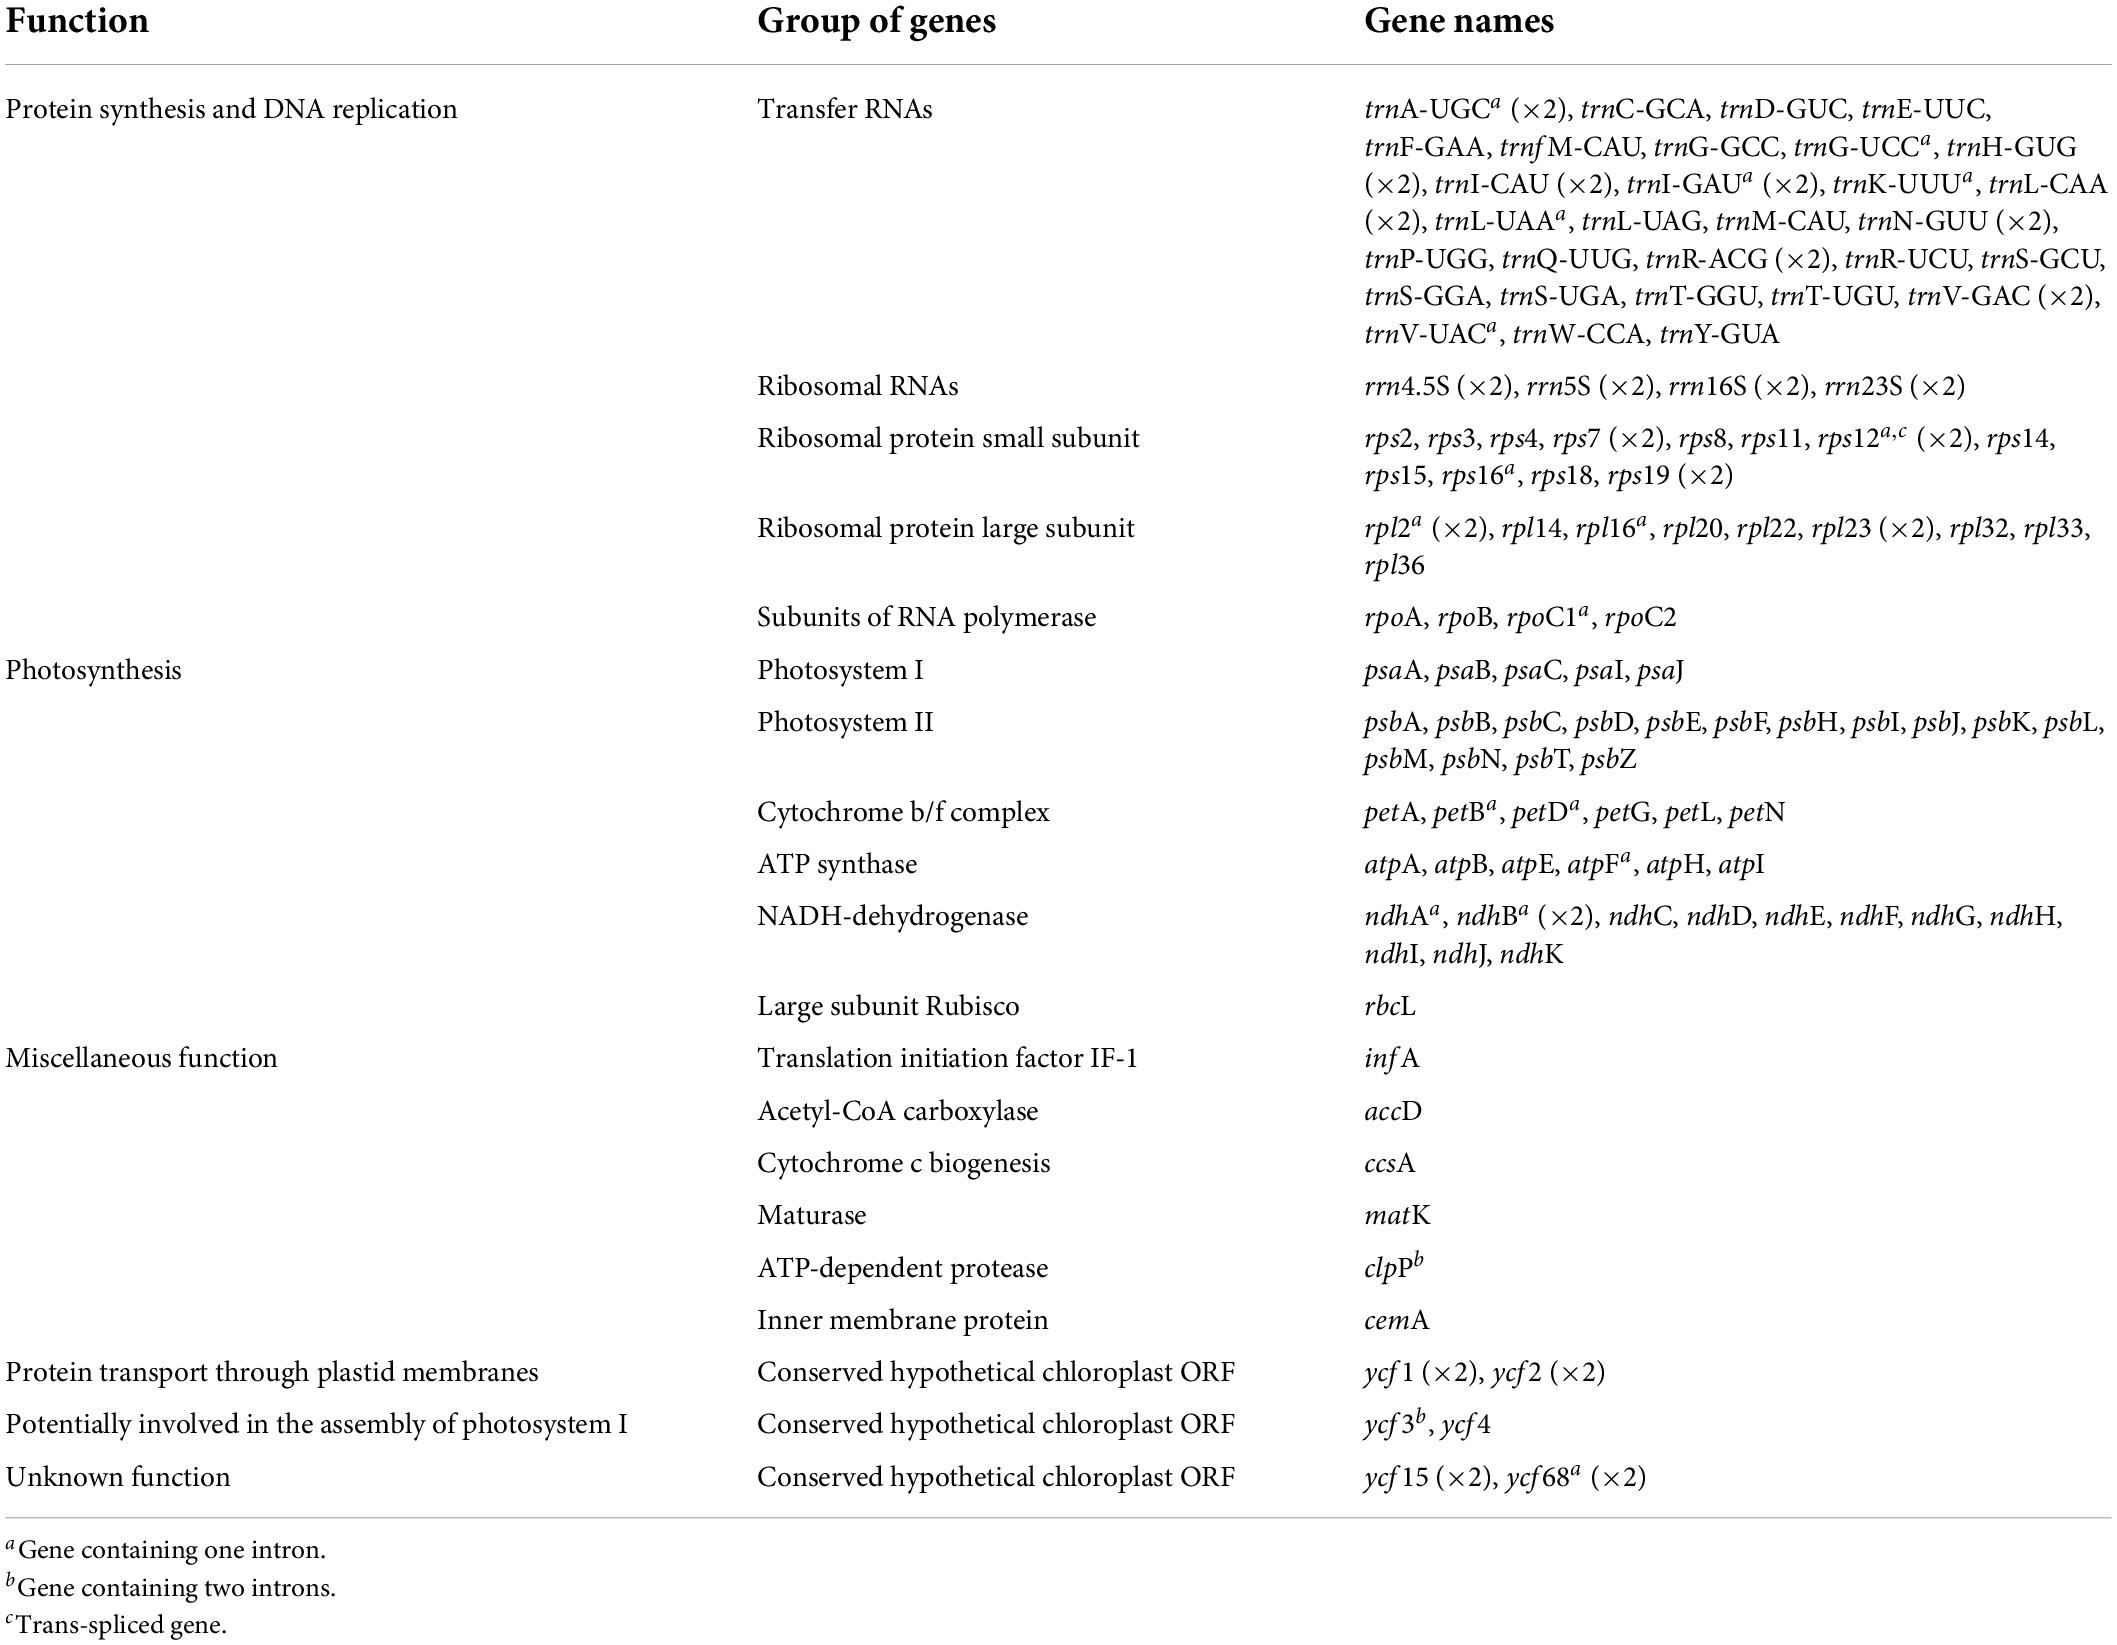
Table 2. Genes present in the plastome of species of core Tillandsioideae.
Gene order is highly conserved and changes in gene order were only found in the Pseudalcantarea and Vriesea representatives. In Pseudalcantarea, gene order change is caused by their shorter IR that spans from the partial ycf1 gene to the partial ndhB gene, instead of up to the rps19 gene as in all the remaining species, as a result, gene order in the LSC-IRb border differs from all other species (Figure 1B and Supplementary Material 4). Gene order changes in Vriesea derive from a large inversion of the region between the accD and psbD genes, which inverts the order of a total of 24 genes relative to the remaining species (Figure 1C and Supplementary Material 4). An additional large inversion shared by the two T. biflora complex representatives was detected spanning the accD gene and portion of the flanking IGS (Supplementary Material 4), however, since this inversion involves only one gene, the general gene order is not affected.
Coding regions, including protein-coding, tRNA and rRNA genes, accounted on average for 90,993.27 bp, ranging from 81,885 bp in P. viridiflora to 91,930 bp in T. gymnobotrya, whereas non-coding regions ranged from 61,908 to 73,081 bp in P. macropetala and Lutheria splendens, respectively (average 65,613.32 bp). The GC content of full plastomes ranged from 37.20% in C. sessiliflora to 37.46% in Alcantarea odorata, with an average of 37.34%. Catopsis sessiliflora presented the highest (0.35) number of SSRs per 1k bp in the complete plastome and Wallisia cyanea the lowest (0.17; average 0.25), whereas T. ixioides and W. cyanea had the highest (0.54) and lowest (0.37; average 0.45) number of tandem repeats per 1k bp in the complete plastome, respectively. Further details on the variation of the GC content, number of SSR and tandem repeats per 1k bp of the LSC, SSC, and the IR can be found the Table 1 and Supplementary Material 5.
Phylogenetic relationships of the core Tillandsioideae
The alignment of the full plastomes resulted in a 168,047 bp long matrix. After the exclusion of one IR copy, small and large inversions, as well as ambiguously aligned regions for a total of 65,434 excluded sites, the final matrix used for phylogenetic inference comprised 102,613 aligned sites, including 54,560 bp corresponding to exons of protein-coding genes, 1,575 bp to exons of tRNA genes, 4,525 bp to rRNA genes, 12,774 bp to introns and 29,179 bp to IGS.
Below is a description of the retrieved phylogenetic relationships that were all strongly supported (BS ≥90), except those stated below (Figure 2A). Our ML analysis retrieved tribes Vrieseeae and Tillandsieae as monophyletic. Within tribe Vrieseeae, two sister clades corresponding to subtribes Vrieseinae and Cipuropsidinae were recovered. Subtribe Vrieseinae includes the monophyletic Vriesea sister to Alcantarea, whereas subtribe Cipuropsidinae is further divided in two clades, the first of which includes Lutheria sister to Werauhia and the second including Goudaea, Zizkaea, and Mezobromelia as successive sisters. In Tribe Tillandsieae, Guzmania is recovered as sister to a clade including all the remaining species, which is further divided into two clades. The first clade includes Barfussia, Lemeltonia, Wallisia, and Racinaea as successive sisters and the second clade (BS = 57) is further divided in two lineages. The first of these lineages (BS = 45) includes the monophyletic Pseudalcantarea as sister to a monophyletic Tillandsia subgenus Tillandsia. Within this subgenus, T. malzinei is recovered as sister to clade K (sensu Barfuss et al., 2016), which is further divided into the clades K.1 and K.2 (sensu Granados Mendoza et al., 2017). Clade K.1 includes T. gymnobotrya as sister to the clade integrated by Tillandsia punctulata and T. achyrostachys (BS = 70), whereas clade K.2 includes T. utriculata as sister to the clade of Tillandsia schiedeana and Tillandsia brachycaulos. The second lineage includes the remaining Tillandsia species (BS = 35) divided in two clades. In the first of these clades (BS = 50) the T. disticha complex is sister to a monophyletic T. subgenus Pseudovriesea, whereas in the second clade the [T. purpurea complex + T. subgenus Viridantha] clade (BS = 83) is sister to a clade containing the [T. australis + T. sphaerocephala complexes] clade as sister to a lineage including [T. biflora + T. gardneri complexes] clade, and subgenera Anoplophytum, Diaphoranthema, Aerobia, and Phytarrhiza as successive sisters (Figure 2A).
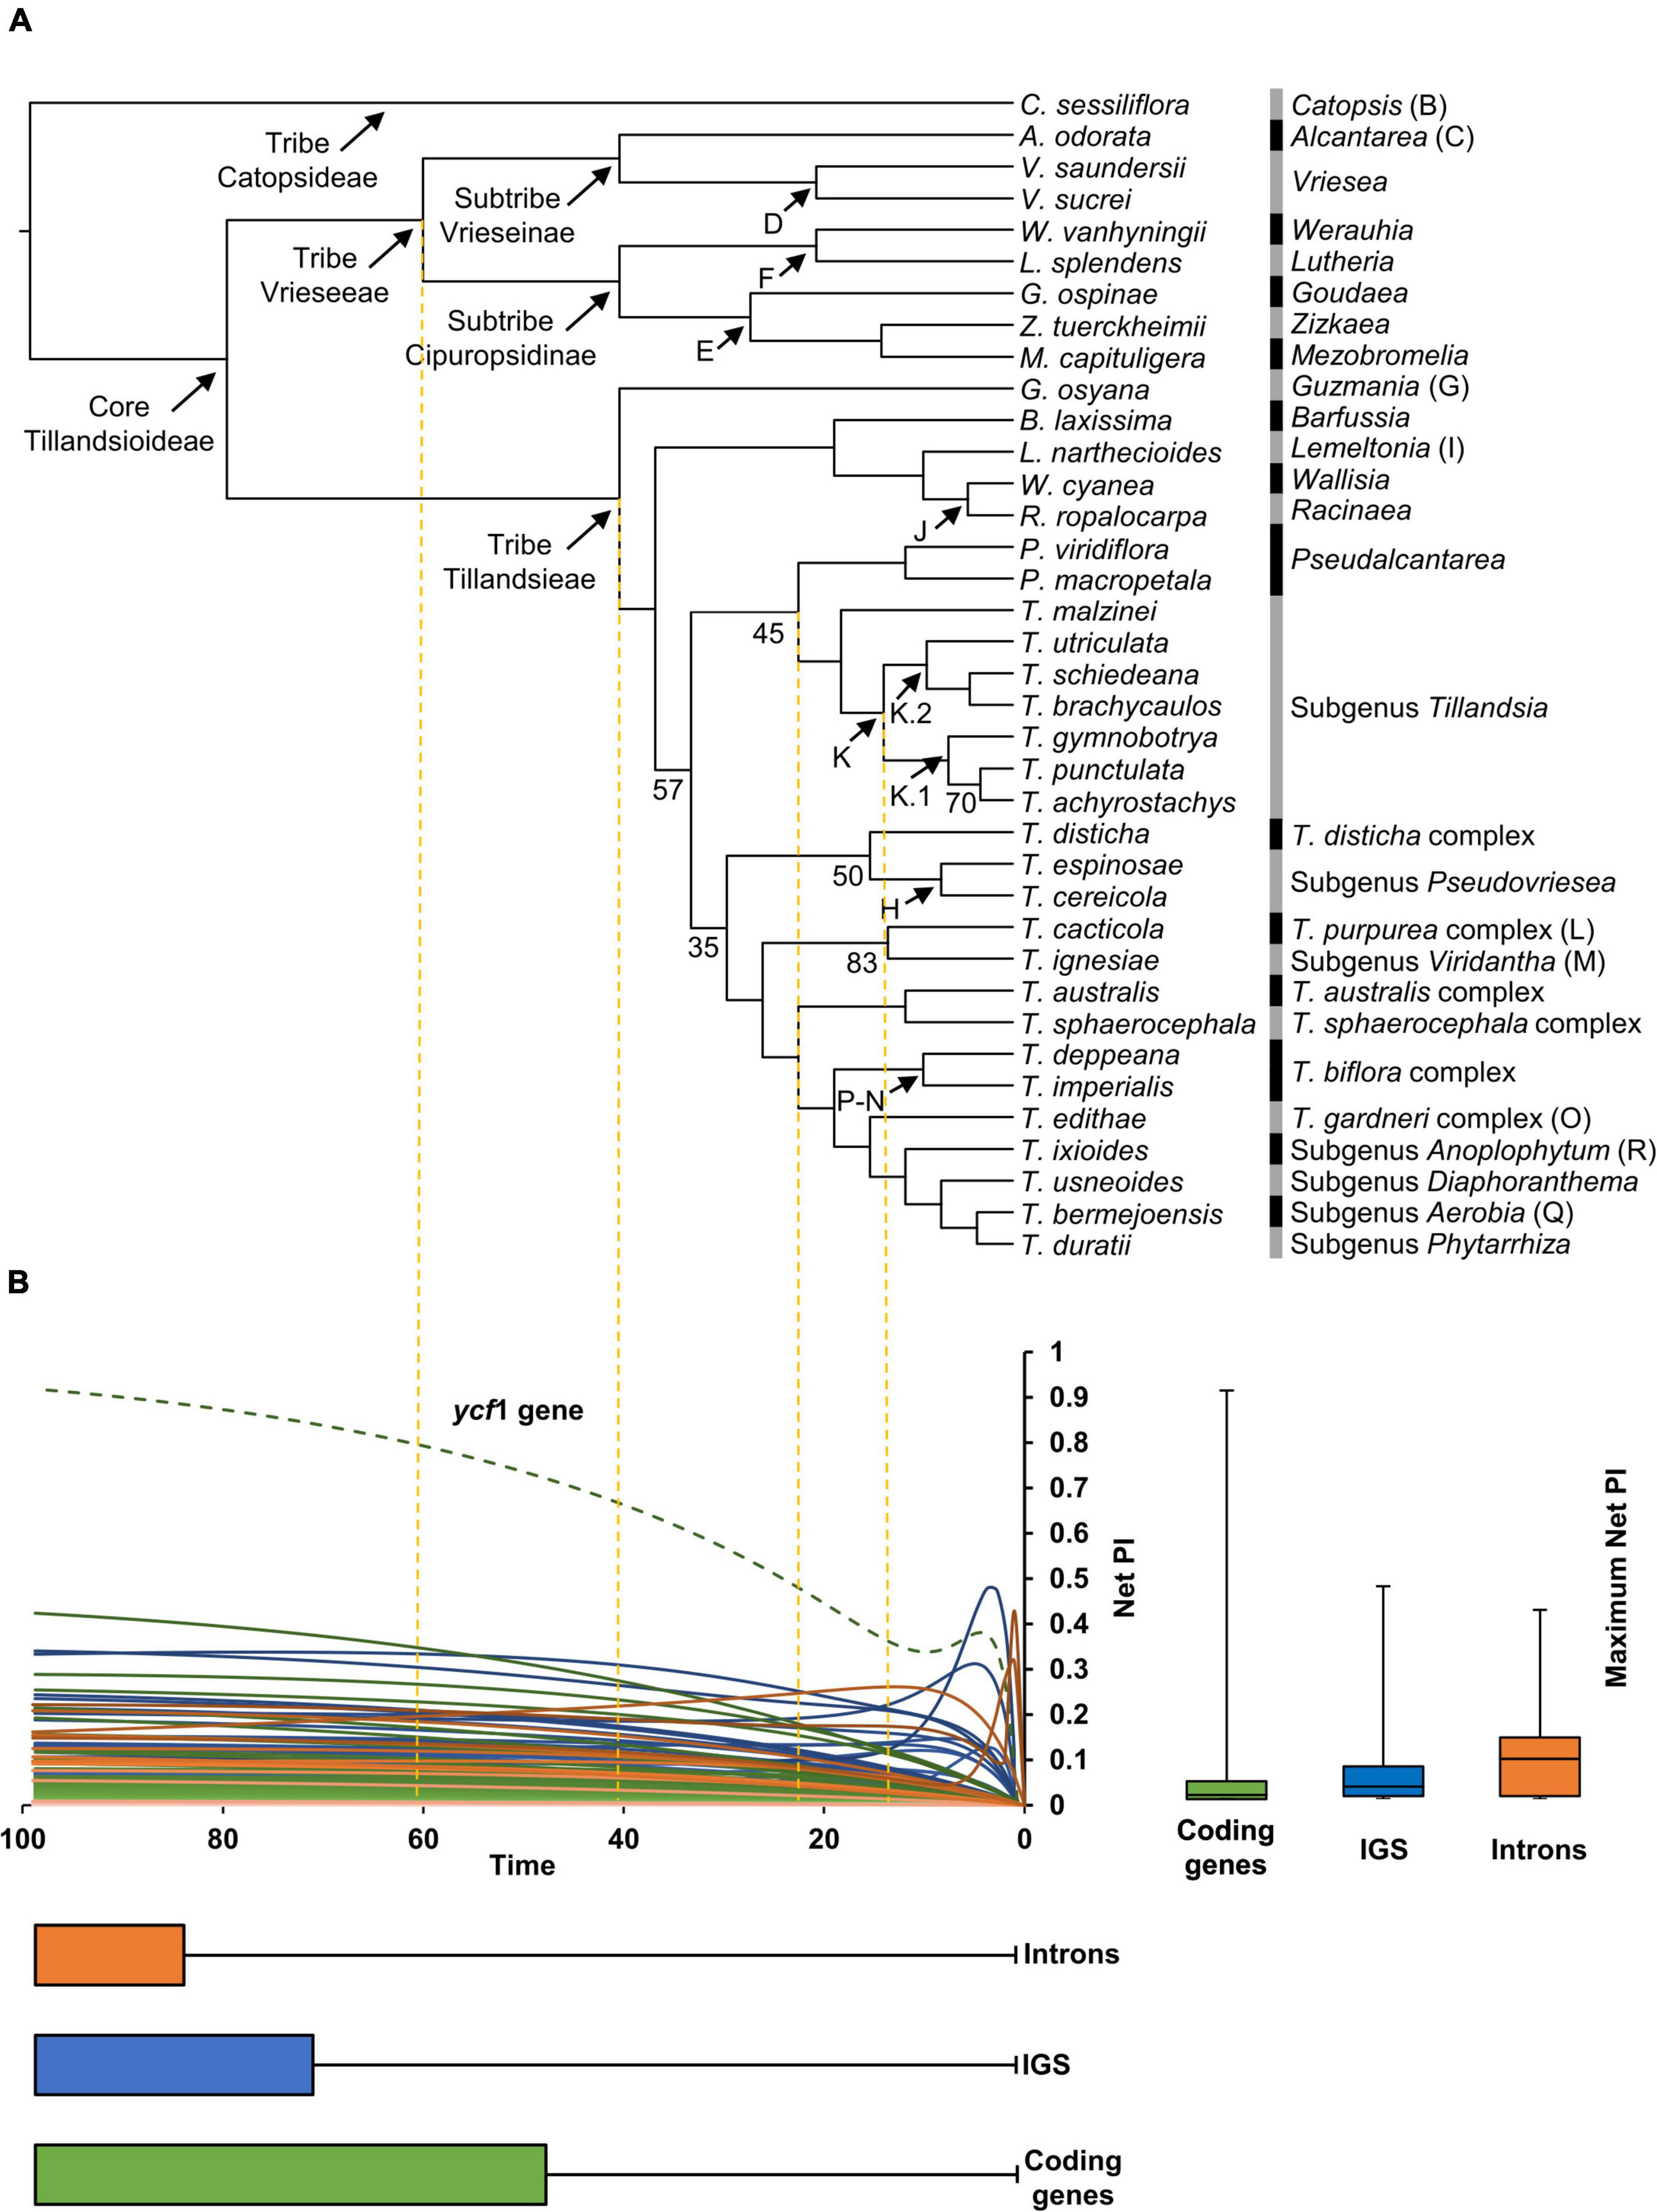
Figure 2. (A) Phylogenetic relationships obtained from the IQ-TREE ML analysis with branch lengths converted to ultrametric. Clade names and letters identifying genera, subgenera and species complexes follow Barfuss et al. (2016) and Granados Mendoza et al. (2017). Support values are shown below the branches for nodes with BS <85%. (B) Net phylogenetic informativeness (PI) profiles of plastid coding genes (green), intergenic spacers (blue), and introns (orange). The green dashed curve corresponds to the ycf1 gene, which surpassed by far the PI of any other marker. Distribution of loci’s maximum net PI values and time at which these values were reached is shown with quantiles 2 and 3 to the right and below the PI profiles, respectively. Whiskers denote maximum and minimum values. The arbitrary time scale of the PI profiles matches the one of the ultrametric tree in (A).
Phylogenetic utility of plastid markers and data categories
In general, PI profiles showed curves that steadily increased reaching their maximum net PI toward time 100. Some IGS and introns showed steep increases corresponding to shallow divergences followed by more gradual decreases toward time 100. A few introns and the ycf1 gene presented spikes toward time 0, corresponding to sites with unusually high substitution rates compared to the remaining sites in the alignments (Figure 2B). Median of maximum net PI was higher for introns, followed by IGS and coding genes (9.1 × 10⁻², 2.8 × 10⁻², and 9.4 × 10⁻³, respectively), with the ycf1 gene as outlier with 0.92 of maximum net PI. Twenty-two coding regions, including six exons of protein-coding genes, 14 exons of tRNA genes and two rRNA genes, had zero maximum net PI. Among informative coding regions, net PI ranged from 3.42 × 10–46 in the petG gene to 0.92 in the ycf1 gene. The psbF-psbE, rpl23-rpl2, and rrn4.5S-rrn23S IGS had zero maximum net PI, while maximum net PI of informative IGS ranged from 5.27 × 10–129 in the trnL-ccsA IGS to 0.48 in the psaC-ndhE IGS. Only the second intron of the trnI-GAU gene had zero maximum net PI. Maximum net PI of the remaining introns ranged from 2.92 × 10⁻³ in the ycf68 intron to 0.42 in the rpl16 intron. Most loci reached their maximum net PI toward the root, with a median value of 99 for the three data categories. When considering the three data categories together, the 15 most informative loci are: ycf1 gene, psaC-ndhE IGS, rpl16 intron, rpoC2 gene, psbE-petL IGS, trnS-trnG IGS, clpP intron 1, rpl32-trnL IGS, ndhF gene, atpF intron, matK gene, petN-psbM IGS, rpoB-trnC IGS, trnT-psbD IGS, and rpoB gene (Figure 2B and Supplementary Material 3).
Ancestral state reconstruction and detection of rate shifts of plastome attributes
The crown node of core Tillandsioideae was reconstructed with a plastome size of 157,138.08 bp (95% CI = 152,990.92–161,285.24 bp), and sizes of LSC, SSC and IR regions of 86,271.32 bp (95% CI = 82,517.65–90,024.99 bp), 18,228.11 bp (95% CI = 17,634.68–18,821.55 bp), and 26,319.32 bp (95% CI = 22,392.93–30,245.70 bp), respectively. A total GC content of 37.34% (95% CI = 37.26–37.43%) was reconstructed for the root node, whereas reconstructed total number of SSR and tandem repeats per 1 kb were 0.26 (95% CI = 0.21–0.30) and 0.45 (95% CI = 0.37–0.53), respectively. Ancestral state reconstruction, variance, and 95% confidence intervals for the 20 studied plastome attributes for each node of the Tillandsioideae tree can be found in the Supplementary Material 6.
Shifts in evolutionary rate were detected in seven out of 20 attributes (Figure 3). A single evolutionary rate shift was detected for several attributes, including plastome size (PP = 0.99; Figure 3A), LSC size (PP = 0.54; Figure 3B), GC content of the LSC (PP = 0.98; Figure 3E; the three attributes shifting at the Pseudalcantarea clade), SSC size (PP = 0.57; Figure 3C; at the K.1 clade), and number of tandem repeats in the SSC (PP = 0.18; not illustrated; at Tribe Tillandsieae clade). GC content of the IR had two evolutionary rate shifts (PP = 0.93; Figure 3F) at the Pseudalcantarea and K.1 clades, whereas IR size had three evolutionary rate shifts (PP = 0.74; Figure 3D) at the Pseudalcantarea and K.1 clades, as well as a clade including T. biflora and T. gardneri complexes, and the subgenera Anoplophytum, Diaphoranthema, Aerobia, and Phytarrhiza.
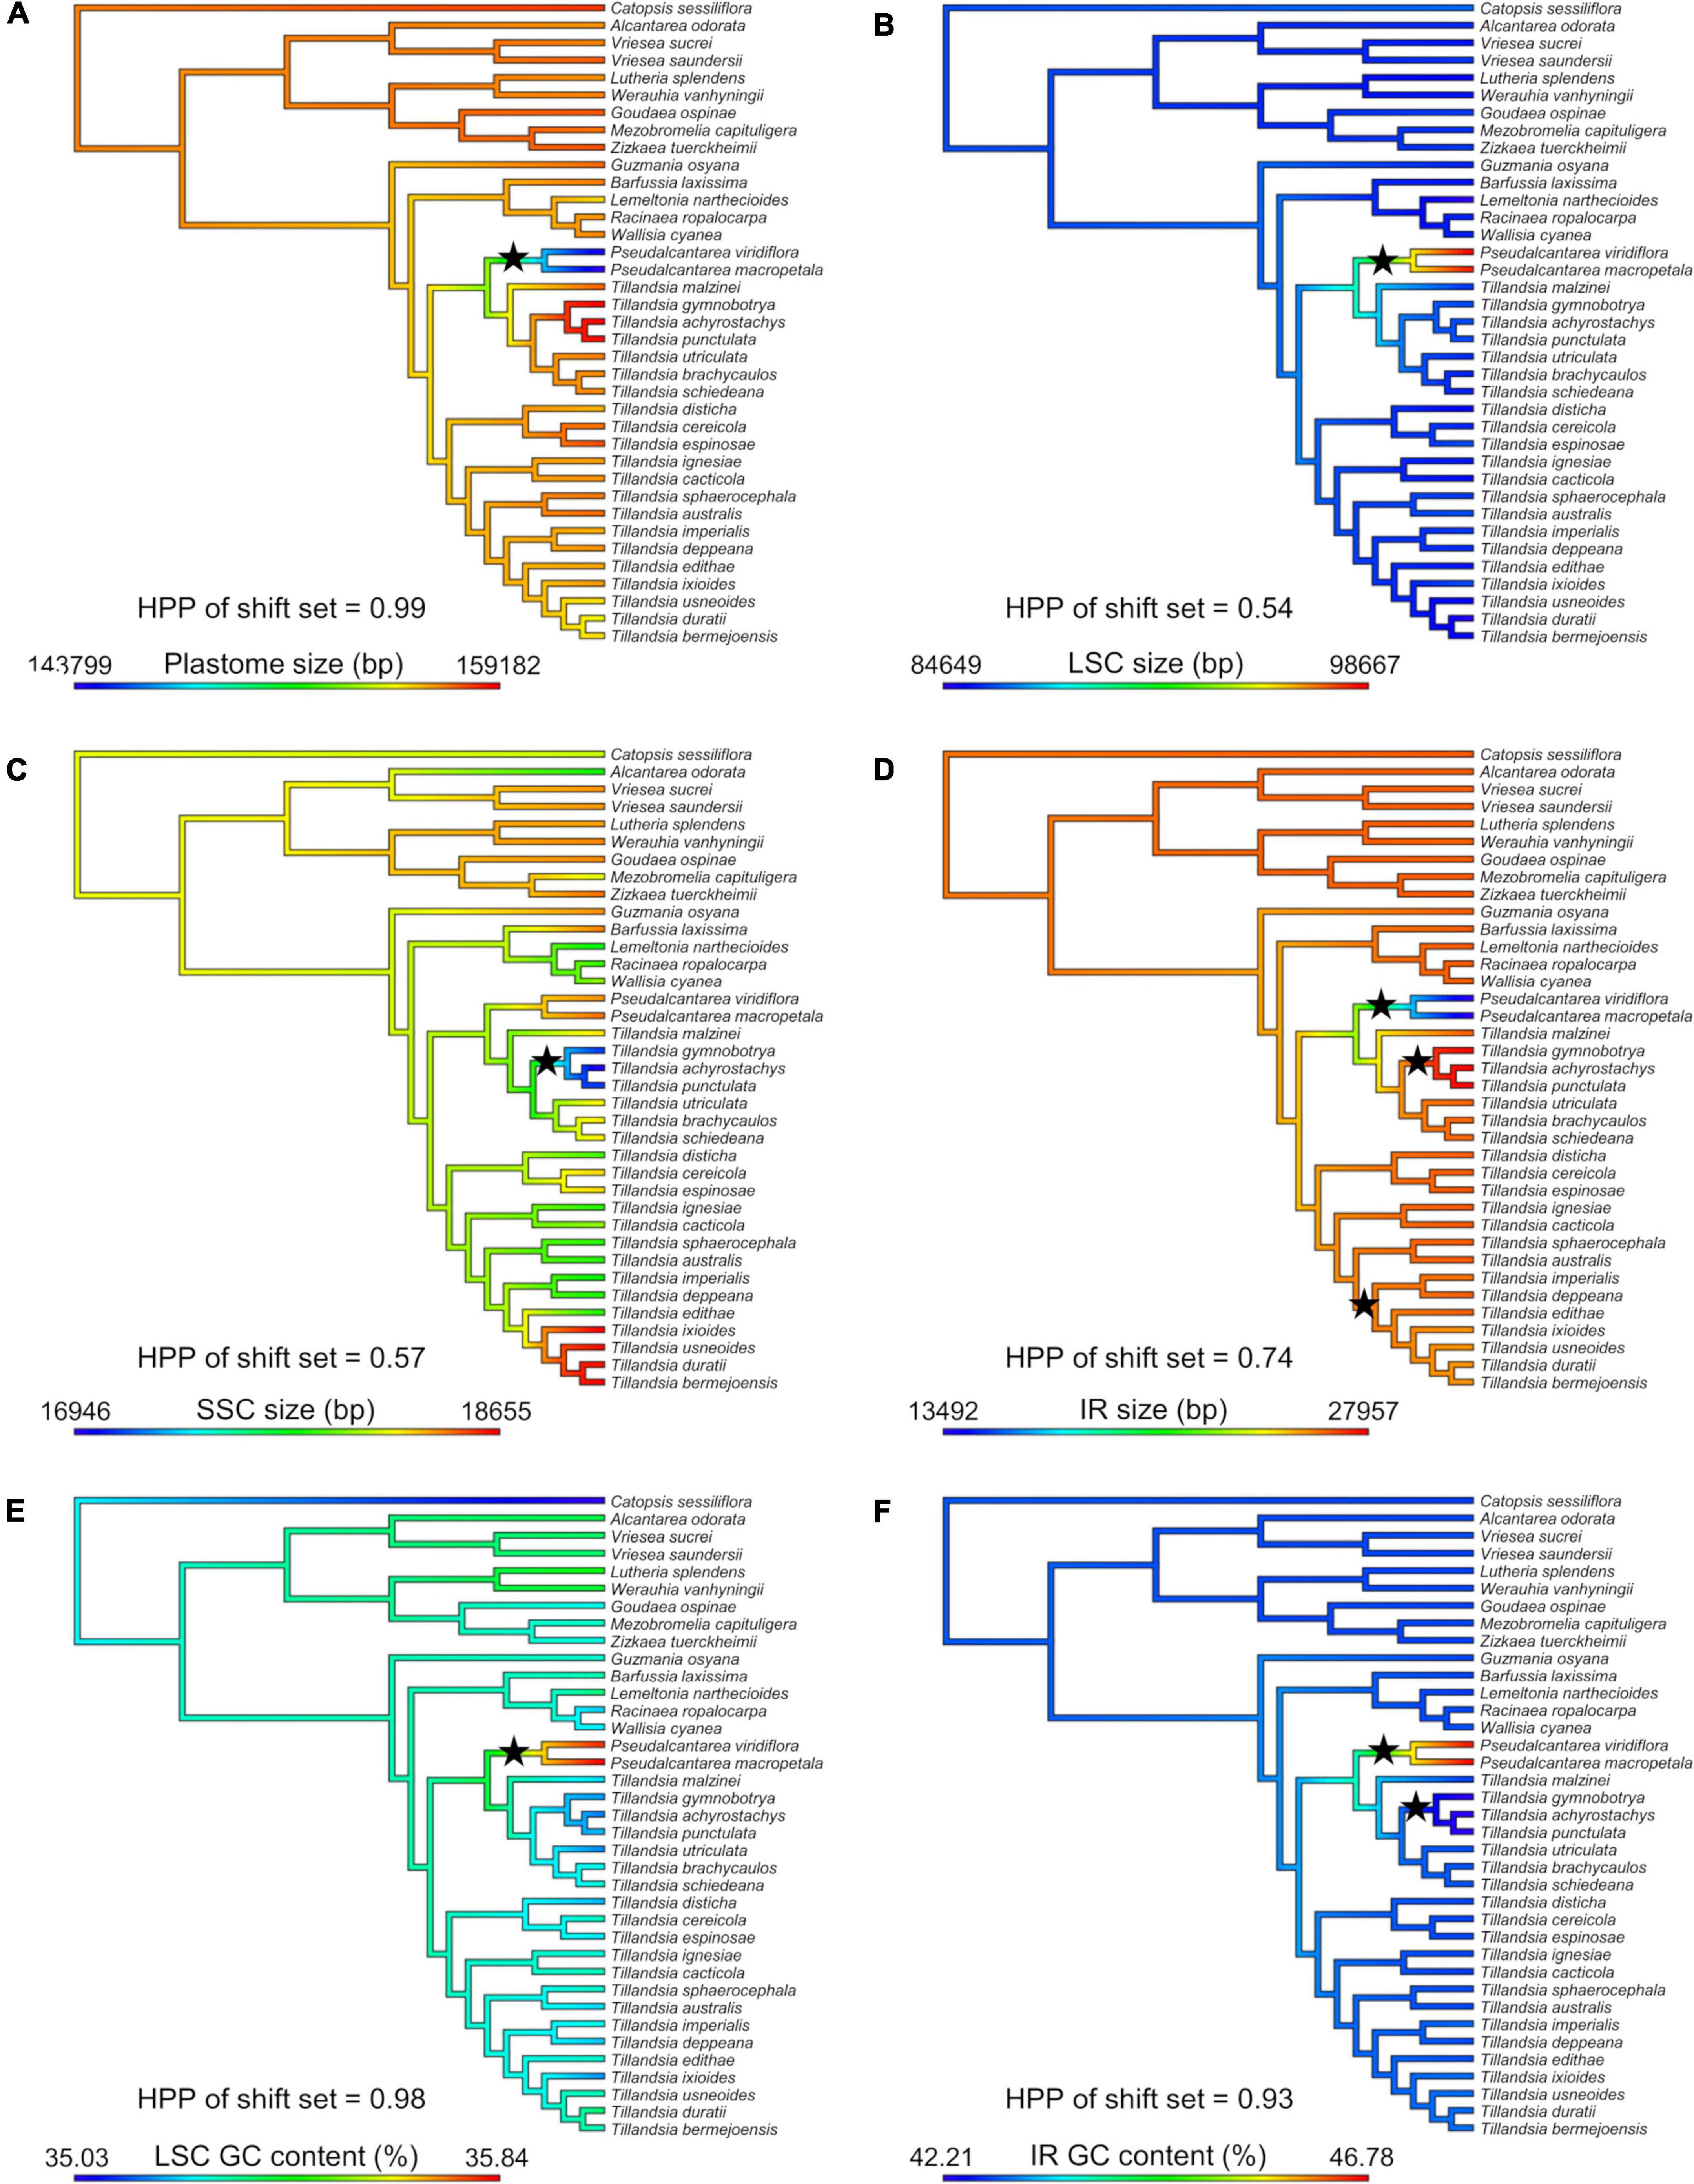
Figure 3. Evolution of six plastome attributes where evolutionary rate shift sets were detected by BAMM with PP ≥0.5. Ancestral state reconstruction was inferred under a Maximum Likelihood (ML) framework and mapped on the Tillandsioideae phylogeny. (A) Plastome size. (B) LSC size. (C) SSC size. (D) IR size. (E) LSC GC content. (F) IR GC content. LSC, large single copy; SSC, small single copy; IR, inverted repeat; bp, base pairs; HPP, highest posterior probability. Black stars indicate the location of detected evolutionary rate shifts.
Discussion
New lineage-specific plastome rearrangements support recently adopted taxonomic groups
Our study results in 34 new, complete plastomes for Tillandsioideae species (plastomes for three of the herein sampled species were already available in Genbank), significantly enriching Bromeliaceae genomic resources (Supplementary Material 4, 5A). Compared to the previously published Tillandsioideae plastomes, nine of the herein studied species have smaller plastomes, the lower bound being the plastomes of the two Pseudalcantarea species (143,799 and 144,169 bp). Range of the previously reported size for the LSC, SSC, and IR in Tillandsioideae was similarly expanded by our results, being remarkable the considerably smaller IR regions (13,544 to 13,492 bp) and larger LSC region (98,341 and 98,667 bp) of the two Pseudalcantarea species (Supplementary Material 5A). Variation of plastome size in land plants has been attributed to several reasons, including expansions and contractions of the IR or loss of one of the copies, gene loss or pseudogenization (frequently involving the ndh gene group), intron loss, IGS size variation, and differences in the abundance of repetitive sequences (Ruhlman et al., 2015; Mower and Vickrey, 2018). As discussed below, expansions and contractions of the IR seem to play a major role for the observed plastome size differences in Tillandsioideae, but gene pseudogenization, IGS size variation, and differences in the abundance of short repetitive sequences also play a role, although to a lesser extent.
To our knowledge, besides the two Pseudalcantarea species herein studied, there is no other Bromeliaceae report with this noticeable IR reduction and associated LSC expansion. In fact, the IR size of the Pseudalcantarea species is smaller than the typical range reported for land plants (15–30 kb; Zhu et al., 2016). Despite these structural differences, gene content is identical across the analyzed Tillandsioideae plastomes (Table 2 and Supplementary Material 4) since the genes that are absent in the IR region of the Pseudalcantarea plastomes (but present in the IR of all other Tillandsioideae species) are instead translocated into the LSC region and thus expanding its size (Figure 1B). Large IR contractions (>10,000 bp) are less frequent than IR expansions in autotrophic vascular plants (Mower and Vickrey, 2018) and, to our knowledge and when excluding complete losses of one IR, large IR contractions are only known from Austrobaileyales (Hansen et al., 2007; Gruenstaeudl et al., 2017). As currently circumscribed, Pseudalcantarea includes the two species here sampled plus Pseudalcantarea grandis. Confirming the monophyly of Pseudalcantarea (as currently circumscribed) and assessing whether P. grandis shares the IR reduction and associated LSC expansion is central for recognizing this feature as a molecular synapomorphy for this lineage.
Overall gene content and order are highly conserved across Bromeliaceae, a single difference was observed between our gene annotations and those of previous studies. The ycf68 gene has been previously annotated only for the MD-2 A. comosus commercial hybrid (Redwan et al., 2015) and A. comosus var. erectifolius (Liu et al., 2022), but not in other Bromeliaceae. However, we found that this gene corresponds to an open reading frame in all Tillandsioideae studied species, embedded in the trnI-GAU intron, and is composed of two exons and an intron (Figure 1A and Supplementary Material 4), as first annotated by Redwan et al. (2015).
Three potential pseudogenes were identified, including the ycf1 and ycf15 genes, in all studied species, and the ndhB gene only in Pseudalcantarea. The ycf1 gene is truncated at the IRb-SSC border and has also been annotated as a pseudogene in A. comosus, T. espinosae, T. landbeckii, T. malzinei, T. purpurea, and T. usneoides (Nashima et al., 2015; Poczai and Hyvönen, 2017; Chávez-Galarza et al., 2021; Möbus et al., 2021), as well as other monocots such as Typha latifolia (Poales), Zingiber spectabile, and Musa textilis (Zingiberales; Poczai and Hyvönen, 2017). The second pseudogene, ycf15, presented premature stop codons, as found in other Bromeliaceae (Nashima et al., 2015; Poczai and Hyvönen, 2017; Möbus et al., 2021). However, as discussed by Poczai and Hyvönen (2017) and thoroughly studied by Shi C. et al. (2013), even from intact ycf15 gene copies, known from several asterids, Magnolia (Magnoliales), Piper (Piperales), and Camellia (Ericales), it has not been possible to confirm if this gene is able to encode a protein.
In Pseudalcantarea the ndhB gene is truncated at the LSC-IRb border. As mentioned above, the ndhB is one of six core protein-coding genes of the angiosperms’ IR. Pseudogenization of one of the two generally present copies of the ndhB gene in species of Pseudalcantarea could be influencing this gene’s dosage and affecting its overall transcription levels. Even in the highly contracted IR of Illicium and Schisandra (Austrobaileyales), the ndhB gene remains intact (Gruenstaeudl et al., 2017). Experiments with tobacco plants with fully inactivated ndhB genes showed enhanced growth retardation and decline in photosynthesis under humidity stress (Horváth et al., 2000). Pseudalcantarea is composed of three mesomorphic, bat-pollinated species restricted to humid montane forest of Mexico (Aguilar-Rodríguez et al., 2014, 2019, Göttlinger et al., 2019). The reduced ndhB gene dosage of Pseudalcantarea species might explain the restriction of this lineage to highly humid environments and be related to its low taxic diversity, since its physiological constrains might have impeded the dispersion of this lineage to less suitable environments.
Among Bromeliaceae, Vriesea is the first genus reported to have an inversion of significant size (27,080–27,120 bp), which is located at the LSC and spans from the accD gene to the psbD gene, including parts of the two flanking IGS (Figure 1C and Supplementary Material 4). The breaking point toward the accD gene is near the trnT-GGU gene, whereas the breaking point toward the psbD gene is close to a SSR and a tandem repeat, which agrees with previous observations that breaking points of inversions are frequently flanked by tRNA genes and shorth repeat sequences (Wicke et al., 2011). Previous studies focused on the systematics of this genus (Machado et al., 2020) did not report this inversion, most probably because they retrieved only a partial plastome for Vriesea marceloi and, for other species, the authors exclusively extracted individual genes. Wu et al. (2022) also did not report this inversion for the V. × poelmanii hybrid, although after analyzing their sequence we can confirm that the inversion is present. Exploring the presence of this large inversion in other species of Vriesea, as well as in species of the closely related genus Stigmatodon (Machado et al., 2020), can help determine whether this inversion represents a molecular synapomorphy for Vriesea only or for the Vriesea + Stigmatodon lineage.
We found that the accD gene and part of each of its flanking IGS is inverted in the studied T. biflora complex representatives relative to all other studied Tillandsioideae plastomes (Supplementary Material 4). Further comparison to other previously published Bromeliaceae plastomes revealed that the inversion seems to be restricted to the T. biflora species complex. Harris et al. (2013) studied the evolution of the accD gene in Poales and found that this gene is present in Tillandsia secunda (T. subgenus Tillandsia), as well as in representatives of Typhaceae, Cyperaceae, Juncaceae, Eriocaulaceae, Xyridaceae, and Flagellariaceae. However, Harris et al. (2013) also found that the accD has been lost in representatives of Restionaceae, Joinvilleaceae, and Poaceae, and pseudogenized in Poaceae, suggesting a certain degree of lability of the gene in this order. Considering that the T. biflora complex is a highly speciose lineage including over 136 species (Barfuss et al., 2016), a more representative taxon sampling within this species complex would be necessary to confirm or refute this inversion as a synapomorphy for the group.
Three plastomes from species that were already available in GenBank, including T. espinosae, T. malzinei (Möbus et al., 2021), and T. usneoides (Poczai and Hyvönen, 2017), were here newly sequenced and assembled. A few differences were found compared to the previously published plastomes of T. espinosae (7 bp), and T. malzinei (85 bp). However, over 5,564 sites were different between the two plastome sequences of T. usneoides. These numerous differences are evenly distributed across the plastomes and could be attributed to the species’ ample geographic distribution, which essentially equals the distribution range of the genus Tillandsia (south of United States to central Argentina), potentially promoting increased infraspecific genetic variability.
Performance of full plastomes in resolving core Tillandsioideae phylogeny
Analysis of complete plastome sequences contributed to the resolution of most, but not all, recalcitrant relationships within core Tillandsioideae. Our results are in general consistent with the phylogenetic relationships recovered by previous studies using plastid data (Barfuss et al., 2016; Machado et al., 2020; Loiseau et al., 2021), albeit in discordance with the phylogenetic relationships retrieved by Loiseau et al. (2021) based on nuclear data, where subtribe Cipuropsidinae (tribe Vrieseeae) is recovered as sister to tribe Tillandsieae (vs. sister to subtribe Vrieseinae), and Werauhia is retrieved as sister to the remaining genera of subtribe Cipuropsidinae (vs. sister to Lutheria). Genus level phylogenetic relationships obtained by Yardeni et al. (2022) from the analysis of their nuclear dataset are mostly in agreement with our results, except for the position of Racinaea which is recovered nested within Tillandsia by these authors. Despite the differences in taxon samplings across studies, the consistently retrieved strongly supported phylogenetic discordance between plastid and nuclear data sources suggest that evolutionary processes, such as hybridization or lineage sorting, could have shaped the evolution of the core Tillandsioideae. This is in line with the results of Loiseau et al. (2021), who documented widespread intra and intergeneric hybridization, both within and among tribes of Tillandsioideae, which might at least partially explain the discordance between plastid and nuclear data sources. Future studies using increased taxon samplings and including both uniparentally and biparentally inherited molecular sources of data could address the potential sources of the observed phylogenetic discordance.
Below is a discussion of the herein retrieved phylogenetic relationships relative to the study of Barfuss et al. (2016), which remains to date the more comprehensive phylogenetic study of the Tillandsioideae. However, it is important to notice that our taxon sampling is considerably limited, albeit representative, compared with Barfuss et al. (2016). All genera, subgenera and species complexes including more than one sampled species in the present study were recovered as monophyletic, except Tillandsia, as T. subgenus Tillandsia was recovered sister to genus Pseudalcantarea (BS = 45). The phylogenetic position of Pseudalcantarea within tribe Tillandsieae remains unsolved as backbone relationships were weakly supported by our and previous studies (e.g., Barfuss et al., 2016). Future studies providing higher resolution for these recalcitrant relationships could confirm or refute Barfuss et al.’s (2016) proposal of keeping Pseudalcantarea as a segregated genus of Tillandsia.
Some previously identified, but weakly supported groups by Barfuss et al. (2016) received increased statistical support in our study, including the clade [Zizkaea + Mezobromelia] (BS = 93 vs. 61), the clade [Barfussia + Lemeltonia + Wallisia + Racinaea] (BS = 96 vs. 62), the clade comprising T. biflora and T. gardneri species complexes plus subgenera Anoplophytum, Diaphoranthema, Aerobia, and Phytarrhiza (BS = 100 vs. 58), and the clade of T. biflora species complex (BS = 100 vs. 65). Although some backbone relationships within genus Tillandsia remain weakly supported in our analysis, our study recovered subgenera Anoplophytum and Diaphoranthema as successive sisters of the clade including subgenera Aerobia and Phytarrhiza as highly supported (BS = 100), which were not resolved in Barfuss et al. (2016; Figure 2A). The overall congruence of our results and those previously published based on plastid information, along with the increased statistical support for previously identified weakly supported clades, suggest full plastomes as a valuable source of data for phylogenetic studies in Tillandsioideae. Future studies using full plastomes and denser taxon sampling will test if the herein recovered highly supported clades hold true when the taxon sampling is increased. Resolution for recalcitrant phylogenetic relationships within tribe Tillandsieae could benefit from the inclusion of NGS based nuclear data, however, as already pointed out by Loiseau et al. (2021), phylogenomic discordance between plastid and nuclear data is expected to emerge.
Old and new highly informative plastid loci
We explored the PI of all loci included in our final plastid matrix, which comprised all coding regions, introns and IGS (Figure 2B and Supplementary Material 3), except for those placed within the large inversion detected in the LSC of Vriesea, which also contains the smaller inversion detected for the T. biflora species complex. Our decision to exclude this large inversion, as well as other detected minor inversions, was because sites within these inversions are not homologous across the herein studied species. As a result, we excluded 15 protein-coding genes, eight tRNA genes, and 22 IGS prior to the phylogenetic analysis. However, other studies not including Vriesea or T. biflora species or only including these two taxa separately, could make use of the herein excluded plastid loci and potentially improve phylogenetic resolution. Four of the excluded loci, that are present within the large inversion (i.e., rbcL gene, atpB-rbcL IGS, trnL-trnF IGS, and trnL intron), have been employed in a previous phylogenetic study including Vriesea species and other Tillandsioideae (Barfuss et al., 2005). However, these markers were sequenced with Sanger, hence the non-homology of these regions could not have been detected (assuming the inversion is shared across Vriesea species).
Several other Sanger sequenced markers have been employed in previous molecular phylogenetic studies of the Tillandsioideae, including the ndhF and ycf1 genes, the rpl32-trnL and trnK-rps16 IGS, the rps16 intron, and the trnK-matK-trnK, rpoB-trnC-petN, trnD-trnY-trnE-trnT, and trnH-rps19-psbA regions (Terry et al., 1997; Barfuss et al., 2005, 2016; Granados Mendoza, 2008; Chew et al., 2010; Versieux et al., 2012; Donadío, 2013; Castello et al., 2016; Pinzón et al., 2016; Leme et al., 2017; Kessous et al., 2020; Donadío et al., in press). Among these markers, the ycf1 gene far exceeds the PI of any other analyzed loci (Figure 2B and Supplementary Material 3). The high phylogenetic utility of the ycf1 gene has been widely recognized in several vascular plant lineages (e.g., Chase et al., 2009; Gernandt et al., 2009; Neubig et al., 2009, 2012; Parks et al., 2009; Drew and Sytsma, 2013; Shi S. et al., 2013; Arévalo et al., 2015), generally surpassing the utility of other plastid markers and, in some cases, nuclear loci (Granados Mendoza et al., 2020).
Other previously used markers in Tillandsioideae were here recovered as highly informative, including the rpoB-trnC-petN region, matK-trnK region, rpl32-trnL IGS and ndhF gene, which were recovered among the 15 most informative loci. The trnD-trnY-trnE-trnT region, trnK-rps16 IGS, trnH-rps19-psbA region, and rps16 intron rank 22nd, 25th, 32nd, and 35th, out of 217 analyzed loci. Our results not only suggest that plastid marker selection in Tillandsioideae has been in general appropriate, but also identify other loci, i.e., psaC-ndhE IGS, rpl16 intron, rpoC2 gene, psbE-petL IGS, trnS-trnG IGS, and clpP intron 1, as additional promising markers for future Sanger based studies of the Tillandsioideae (Supplementary Material 3), some of them already known for their utility in angiosperm phylogenetic studies (e.g., Shaw et al., 2007).
Overall, PI of non-coding regions (i.e., introns and IGS) was higher than that of coding genes (Figure 2B), which is in agreement with a general trend since coding regions are known to have low rates of nucleotide substitution (Clegg et al., 1994). However, it is noteworthy that the trnI-GAU intron and the psbF-psbE, rpl23-rpl2, and rrn4.5S-rrn23S IGS had PI close to zero (Supplementary Material 3). The trnI-GAU gene and the four rRNA genes are part of a highly conserved core gene set shared in plant and algae IRs (Zhu et al., 2016). As a result, the non-coding trnI-GAU intron and rrn4.5S-rrn23S IGS could also be affected by the reduced substitution rates. Similarly, the rpl23 and rpl2 genes form part of a set of protein-coding genes (also including the rps12-3′, rps7, ndhB, and ycf2) that were ancestrally present in the angiosperms’ IR and that are known to present low sequence divergence (Zhu et al., 2016), suggesting that low substitution rates can also affect their IGS. The fact that most loci reached their maximum net PI toward the root (median = 0.99), coincides with the lack of statistical support at shallower nodes within tribe Tillandsieae (Figure 2 and Supplementary Material 3). Also, the trend followed by most of the analyzed plastid loci of reaching their maximum net PI toward the root indicates that plastid markers could be more informative for deeper phylogenetic divergences, for instance, for informing phylogenetic relationships among Bromeliaceae subfamilies. The lack of statistical support for shallower divergences retrieved by the analyses of full plastomes points toward the need of future studies that analyze more variable molecular markers such as low- or single-copy nuclear genes.
Evolution of plastome attributes and traits’ rates shifts
Ten evolutionary shifts in the rate of evolution were detected in seven plastome attributes, corresponding to seven evolutionary rate shift sets. The following discussion focuses on evolutionary rate shifts sets with posterior probability ≥0.50 (Figure 3). The node subtending the two Pseudalcantarea representatives allocated 5 of the 10 shifts, including plastome, LSC and IR sizes, as well as GC content of the LSC and IR regions. As mentioned above, Pseudalcantarea plastomes showed an important IR contraction and associated LSC expansion, with one partial (ndhB) and eight full copy (rpl2, rpl23, rps19, trnH-GUG, trnI-CAU, trnL-CAA, ycf15, and ycf2) genes translocated from IR to the LSC region. Most translocated genes in Pseudalcantarea are involved in protein synthesis, DNA replication, protein transport through plastid membranes or have an undefined function (Table 2). The only translocated gene involved in photosynthesis is the ndhB gene, although, it was only partially translocated into the LSC region. IRs have been proposed as stabilizing regions and are the most conserved regions of the plastomes, with reduced rates of synonymous nucleotide substitutions and evolving up to 3.7 times slower than the single copy regions. Conversely, the LSC is thought to evolve more rapidly and to be the least conserved of the plastome regions (Wolfe et al., 1987; Ravi et al., 2008; Zhu et al., 2016). Perry and Wolfe (2002) reported for IR-lacking legumes that the translocation of “ancestral” IR genes into the single copy region derived on an increment on substitution rates of the genes, and this trend was confirmed by a recent and ample study on vascular plants (Zhu et al., 2016). Future studies could address if substitution rate and, potentially GC content, of the genes translocated into the LSC in Pseudalcantarea also experience increased substitution rates compared to those present in the IR regions of all other Tillandsioideae species. Notably, as found by Gruenstaeudl et al. (2017) in Austrobaileyales, the border of the contracted IR and the LSC is at the ndhB gene, the same as in Pseudalcantarea, although the gene copy is not truncated in Austrobaileyales. Future transcriptome studies might help elucidate the effects on expression of the translocated genes in Pseudalcantarea as gene dosage might be altered compared to other Tillandsioideae lineages. Furthermore, a denser taxon sampling could help addressing if the detected evolutionary plastome traits’ rate shifts of Pseudalcantarea are associated to diversification rate shifts (e.g., low speciation and/or high extinction rates) of this lineage.
Three additional shifts were allocated at the K.1 clade, which is one of the main clades of Tillandsia subgenus Tillandsia, including size of the SSC and IR and GC content of the IR. The three sampled species of clade K.1 (i.e., T. gymnobotrya, T. punctulata, and T. achyrostachys) have expanded IRs at the IR-SSC borders resulting in the translocation of a portion of the ycf1 gene/pseudogene from the SSC to the IR and the associated SSC region reduction. Translocations from single copy regions into the IR have already been reported in Bromeliaceae for the genera Fascicularia and Ochagavia by Paule et al. (2020), however, in their case translocation occurred from the LSC into the IR and not from the SSC as in clade K.1. Paule et al. (2020) findings and our results suggest that IR expansions and contractions could have played a key role in plastome evolution in Bromeliaceae. The study of yet unexplored lineages and species could reveal additional cases of gene translocation from and to the IR.
Li et al. (2016) found that genes translocated from the single copy regions to the IR regions in ferns showed a two- to three-fold deceleration in their substitution rates and that the GC content of the third codon position and of the non-coding regions was significantly increased. This pattern was also confirmed for other vascular plant lineages by Zhu et al. (2016). However, in clade K.1 the translocation is associated to a decrement in the GC content of the IR (Supplementary Material 6), rather than an increment as in ferns. A possible explanation for this could be the differences in time after these shifts occurred. The two more closely related fern lineages involved in the translocation, Polypodiales and Gleicheniales, diverged at least 275 mya (Li et al., 2016), allowing enough time for achieving the “normal” behavior of the IR after the translocation. To our knowledge, there is no study specifically dating the origin and diversification of clade K.1. However, a crown age of less than 10 mya has been proposed for Tillandsioideae (Givnish et al., 2014) and of 6.6 mya for Tillandsia subgenus Tillandsia (Möbus et al., 2021), suggesting that clade K.1 is an extremely young lineage and that the copy-dependent repair phenomenon maintaining the generally observed IR GC content bias could still be at an early stage. A previous study reported that the clade K.1 is composed of at least 35 spp. distributed in North and Central America (Granados Mendoza et al., 2017), however, this clade is thought to be highly diverse. Future studies could test if the detected evolutionary rate shifts of plastome attributes could be associated to increased diversification rates of clade K.1.
An additional evolutionary rate shift was detected for the size of the IR located at a diverse clade including the T. biflora complex (136 spp.), T. gardneri complex (17 spp.), and subgenera Anoplophytum (33 spp.), Diaphoranthema (30 spp.), Aerobia (50 spp.) and Phytarrhiza (11 spp.; Barfuss et al., 2016) as successive sisters. The three representatives of the T. biflora and T. gardneri complexes present the typical IR-SSC border shared among most Tillandsioideae species, however, all representatives of the subgenera Anoplophytum, Diaphoranthema, Aerobia, and Phytarrhiza have experienced an IR contraction at the border with the SSC. As explained above for the K.1 clade, this case of IR reduction also involves a portion of the ycf1 gene and potential pseudogene suggesting this as a labile region promoting IR expansions and contractions.
Conclusion
Analysis of full plastomes provided increased statistical support for several previously identified, weakly supported clades within core Tillandsioideae. Strongly supported relationships herein obtained agreed in general with previously published phylogenetic contexts based on plastid data, but phylogenetic discordance was detected relative to previous nuclear based studies. The use of nuclear NGS data could aid in resolving recalcitrant relationships of the group, however, phylogenetic discordance is expected to emerge due to widespread intra- and intergeneric hybridization in the subfamily. Overall, selection of plastid markers for phylogenetic inference of the core Tillandsioideae has been adequate, yet new highly informative plastid loci are here proposed for Sanger based studies. Tillandsioideae plastome structure is overall conserved, but new plastome rearrangements were discovered and found to support recently defined taxonomic groups. Future studies including expanded taxon samplings could confirm or refute these structural changes as molecular synapomorphies for the involved lineages. Furthermore, as discovered in this study, new plastome structural changes may arise from yet unexplored taxa. Here, IR expansions and contractions, as well as large inversions were found to play a role on the evolution of core Tillandsioideae plastomes. Studies with a wider taxonomic scope could help address how frequent these structural changes in Bromeliaceae are. Evolutionary rate shifts of plastome attributes were found associated to lineages with both high and low diversity. Future studies could formally test if the herein detected evolutionary rate shifts of plastome attributes are associated to significant changes in diversification rate across the core Tillandsioideae.
Data availability statement
The data presented in the study are deposited in the National Center for Biotechnology Information (https://www.ncbi.nlm.nih.gov/) repository under the accession numbers ON398129–ON398163 and BK061352–BK061353.
Author contributions
CGM, SV-P, DD, and SW conceived and designed the study. CGM, SV-P, DD, SW, GS, AR, EG, IR-M, and SD designed the taxon sampling and collected or provided the samples. SV-P, DD, and CGM performed the laboratory work. SV-P, DD, MJ, and CGM performed the bioinformatic process. CGM, SV-P, DD, MJ, and RH-G designed and performed the analyses. CGM, SV-P, DD, MJ, and AR drafted the manuscript. SW, RH-G, GS, SM, EG, IR-M, and SD proofread and approved the final manuscript. All authors contributed to the article and approved the submitted version.
Funding
Funding for this research was provided by UNAM–DGAPA–PAPIIT project IA202319, “Investigación Científica Básica, Consejo Nacional de Ciencia y Tecnología (CONACYT)” project 286249 (both to CGM), “Fronteras de la Ciencia-CONACYT” project 2016-01-1867 (to SM). CGM thanks the Dresden Junior Fellowship and the Eleonore Trefftz Programme of “Technische Universität Dresden” (TU Dresden) for two grants as visiting professor in 2018 and 2021. ERASMUS+ funding was granted to TU Dresden to support training mobility between “Instituto de Biología,” UNAM (IB-UNAM) and TU Dresden. SV-P and DD received a master scholarship from CONACYT (750269 and 756019, respectively).
Acknowledgments
SV-P and DD thank “Programa de Posgrado en Ciencias Biológicas” (UNAM). We sincerely thank the Leonardo-Office Saxony team for facilitating all the administration and information needed to complete the ERASMUS+ training mobilities. We thank Lidia I. Cabrera Martínez of “Laboratorio de Biología Molecular,” part of “Laboratorio Nacional de Biodiversidad” (LANABIO), IB-UNAM for assistance with laboratory work. We also thank Oscar Pérez Flores and Lena Frenzke for their help collecting some accessions. We sincerely thank the two reviewers for their useful comments that greatly improved out manuscript.
Conflict of Interest
The authors declare that the research was conducted in the absence of any commercial or financial relationships that could be construed as a potential conflict of interest.
Publisher’s note
All claims expressed in this article are solely those of the authors and do not necessarily represent those of their affiliated organizations, or those of the publisher, the editors and the reviewers. Any product that may be evaluated in this article, or claim that may be made by its manufacturer, is not guaranteed or endorsed by the publisher.
Supplementary material
The Supplementary Material for this article can be found online at: https://www.frontiersin.org/articles/10.3389/fpls.2022.924922/full#supplementary-material
Supplementary Material 1 Taxon sampling and voucher information including collector, and collection number (herbarium code as in http://sweetgum.nybg.org/science/ih/).
Supplementary Material 2 Database of 47 complete plant plastomes used to mine contigs of possible plastome origin in our first de novo assembly strategy.
Supplementary Material 3 (A) Maximum net phylogenetic informativeness (PI) and the time at which it was reached for each analyzed locus. Loci were sorted by the net PI from high to low informativeness. Loci highlighted in green have been used in previous phylogenetic studies of Tillandsioideae. Net PI of regions was calculated by adding the PI values of each individual locus involved. (B) Raw phylogenetic informativeness profile data for each analyzed partition.
Supplementary Material 4 Circular representation of the plastome of all studied species. Genes are color coded according to their functional category and GC content across the plastome is denoted by the innermost gray circle, with the 50% threshold of GC content marked by a thin gray line. Genes that are transcribed counter-clockwise and clockwise are displayed to the outside and the inside of the outer circle, respectively.
Supplementary Material 5 (A) Plastome, LSC, SSC, and IR size comparison between previously published and herein generated plastomes. (B) Raw values for the 20 studied plastome attributes, including maximum and minimum values, for the complete taxon sampling.
Supplementary Material 6 Reconstructed ancestral state node values, including their variance, as well as lower and upper 95% CI, for the 20 studied plastome attributes on the Tillandsioideae phylogeny.
Supplementary Material 7 BAMM results for six plastome attributes where evolutionary rate shift sets were detected with PP ≥ 0.5. Branch colors reflect the rate of the trait evolution.
Footnotes
- ^ https://arborbiosci.com/
- ^ https://arborbiosci.com/mybaits-v5-chemistry/
- ^ https://digitalinsights.qiagen.com
- ^ https://www.geneious.com/
- ^ http://lowelab.ucsc.edu/tRNAscan-SE/
- ^ http://iqtree.cibiv.univie.ac.at/
- ^ https://github.com/faircloth-lab/tapir
- ^ http://bamm-project.org/quickstart.html#phenotypic-evolution
References
Aguilar-Rodríguez, P. A., Krömer, T., Tschapka, M., García-Franco, J. G., Escobedo-Sarti, J., and MacSwiney, G. M. C. (2019). Bat pollination in Bromeliaceae. Plant Ecol. Divers. 12, 1–19. doi: 10.1080/17550874.2019.1566409
Aguilar-Rodríguez, P. A., MacSwiney, G. M. C., Krömer, T., García-Franco, J. G., Knauer, A., and Kessler, M. (2014). First record of bat-pollination in the species-rich genus Tillandsia (Bromeliaceae). Ann. Bot. 113, 1047–1055. doi: 10.1093/aob/mcu031
Arévalo, R., Carnevali Fernández-Concha, G., and Cameron, K. M. (2015). Three new species of Mormolyca (Orchidaceae: Maxillariinae) with an updated molecular phylogenetic analysis. Syst. Bot. 40, 692–705.
Barfuss, M. H. J., Samuel, R., Till, W., and Stuessy, T. F. (2005). Phylogenetic relationships in subfamily Tillandsioideae (Bromeliaceae) based on DNA sequence data from seven plastid regions. Am. J. Bot. 92, 337–351. doi: 10.3732/ajb.92.2.337
Barfuss, M. H. J., Till, W., Leme, E. M. C., Pinzon, J. P., Manzanares, J. M., Halbritter, H., et al. (2016). Taxonomic revision of Bromeliaceae subfam. Tillandsioideae based on a multi-locus DNA sequence phylogeny and morphology. Phytotaxa 279:97. doi: 10.11646/phytotaxa.279.1.1
Beier, S., Thiel, T., Münch, T., Scholz, U., and Mascher, M. (2017). MISA-web: a web server for microsatellite prediction. Bioinformatics 33, 2583–2585. doi: 10.1093/bioinformatics/btx198
Benson, G. (1999). Tandem repeats finder: a program to analyze DNA sequences. Nucleic Acids Res. 27, 573–580. doi: 10.1093/nar/27.2.573
Buddenhagen, C., Lemmon, A. R., Lemmon, E. M., Bruhl, J., Cappa, J., Clement, W. L., et al. (2016). Anchored phylogenomics of angiosperms I: assessing the robustness of phylogenetic estimates. bioRxiv[Preprint]. doi: 10.1101/086298
Castello, L. V., Barfuss, M. H. J., Till, W., Galetto, L., and Chiapella, J. O. (2016). Disentangling the Tillandsia capillaris complex: phylogenetic relationships and taxon boundaries in Andean populations. Bot. J. Linn. Soc. 181, 391–414. doi: 10.1111/boj.12400
Castresana, J. (2000). Selection of conserved blocks from multiple alignments for their use in phylogenetic analysis. Mol. Biol. Evol. 17, 540–552. doi: 10.1093/oxfordjournals.molbev.a026334
Chan, P. P., and Lowe, T. M. (2019). “tRNAscan-SE: searching for tRNA genes in genomic sequences,” in Gene Prediction: Methods and Protocols, ed. M. Kollmar (New York, NY: Springer), 1–14. doi: 10.1007/978-1-4939-9173-0_1
Chase, M. W., Williams, N. H., de Faria, A. D., Neubig, K. M., Amaral, M., do, C. E., et al. (2009). Floral convergence in Oncidiinae (Cymbidieae; Orchidaceae): an expanded concept of Gomesa and a new genus Nohawilliamsia. Ann. Bot. 104, 387–402. doi: 10.1093/aob/mcp067
Chávez-Galarza, J. C., Cardenas-Ninasivincha, S., Contreras, R., Ferro-Mauricio, R., and Huanca-Mamani, W. (2021). Chloroplast genome of Tillandsia landbeckii Phil. (Bromeliaceae) a species adapted to the hyper-arid conditions of the Atacama and Peruvian desert. Mitochondrial DNA B Resour. 6, 3375–3377. doi: 10.1080/23802359.2021.1997122
Chew, T., De Luna, E., and Gonzalez, D. (2010). Phylogenetic relationships of the pseudobulbous Tillandsia species (Bromeliaceae) inferred from cladistic analyses of ITS 2, 5.8S ribosomal RNA gene, and ETS sequences. Syst. Bot. 35, 86–95.
Clegg, M. T., Gaut, B. S., Learn, G. H., and Morton, B. R. (1994). Rates and patterns of chloroplast DNA evolution. Proc. Natl. Acad. Sci. U. S. A. 91, 6795–6801.
Donadío, S. (2013). Filogenia de Tillandsia subgen. Diaphoranthema y evolución de la autogamia y la poliembrionía. Doctoral thesis. Buenos Aires: Universidad de Buenos Aires.
Donadío, S., Till, W., Pozner, R., Barfuss, M. H. J., Giussani, L. M., and Starr, J. R. (in press). Phylogenetic relationships and evolutionary trends in Tillandsia subgenus Diaphoranthema and xerophytic species of subgenus Phytarrhiza (Bromeliaceae, Tillandsioideae). Bot. J. Linn. Soc. doi: 10.1093/botlinnean/boac020
Doyle, J. J., and Doyle, J. L. (1987). A rapid DNA isolation procedure for small quantities of fresh leaf tissue. Phytochem. Bull. 19, 11–15.
Drew, B. T., and Sytsma, K. J. (2013). The South American radiation of Lepechinia (Lamiaceae): phylogenetics, divergence times and evolution of dioecy. Bot. J. Linn. Soc. 171, 171–190. doi: 10.1111/j.1095-8339.2012.01325.x
Gernandt, D. S., Hernández-León, S., Salgado-Hernández, E., and Pérez de la Rosa, P. (2009). Phylogenetic relationships of Pinus subsection Ponderosae inferred from rapidly evolving cpDNA regions. Syst. Bot. 34, 481–491.
Givnish, T. J., Barfuss, M. H. J., Ee, B. V., Riina, R., Schulte, K., Horres, R., et al. (2014). Adaptive radiation, correlated and contingent evolution, and net species diversification in Bromeliaceae. Mol. Phylogenet. Evol. 71, 55–78. doi: 10.1016/j.ympev.2013.10.010
Givnish, T. J., Millam, K. C., Berry, P. E., and Sytsma, K. J. (2007). Phylogeny, adaptive radiation, and historical biogeography of Bromeliaceae inferred from ndhF sequence data. Aliso 23, 3–26.
Göttlinger, T., Schwerdtfeger, M., Tiedge, K., and Lohaus, G. (2019). What do nectarivorous bats like? Nectar composition in Bromeliaceae with special emphasis on bat-pollinated species. Front. Plant Sci. 10:205. doi: 10.3389/fpls.2019.00205
Gouda, E. J., Butcher, D., and Gouda, C. S. (2018). Encyclopaedia of Bromeliads, Version 4. Available online at: https://bromeliad.nl/encyclopedia/ [accessed on July 02, 2022].
Granados Mendoza, C. (2008). Sistemática del complejo Tillandsia macdougallii (Bromeliaceae). Master thesis. Mexico City: Universidad Nacional Autónoma de México.
Granados Mendoza, C., Granados-Aguilar, X., Donadío, S., Salazar, G. A., Flores-Cruz, M., Hágsater, E., et al. (2017). Geographic structure in two highly diverse lineages of Tillandsia (Bromeliaceae). Botany 95, 641–651. doi: 10.1139/cjb-2016-0250
Granados Mendoza, C., Jost, M., Hágsater, E., Magallón, S., van den Berg, C., Lemmon, E. M., et al. (2020). Target nuclear and off-target plastid hybrid enrichment data inform a range of evolutionary depths in the orchid genus Epidendrum. Front. Plant Sci. 10:1761. doi: 10.3389/fpls.2019.01761
Gruenstaeudl, M., Nauheimer, L., and Borsch, T. (2017). Plastid genome structure and phylogenomics of Nymphaeales: conserved gene order and new insights into relationships. Plant Syst. Evol. 303, 1251–1270. doi: 10.1007/s00606-017-1436-5
Hansen, D. R., Dastidar, S. G., Cai, Z., Penaflor, C., Kuehl, J. V., Boore, J. L., et al. (2007). Phylogenetic and evolutionary implications of complete chloroplast genome sequences of four early-diverging angiosperms: Buxus (Buxaceae), Chloranthus (Chloranthaceae), Dioscorea (Dioscoreaceae), and Illicium (Schisandraceae). Mol. Phylogenet. Evol. 45, 547–563. doi: 10.1016/j.ympev.2007.06.004
Harris, M. E., Meyer, G., Vandergon, T., and Vandergon, V. O. (2013). Loss of the Acetyl-CoA Carboxylase (accD) gene in Poales. Plant Mol. Biol. Rep. 31, 21–31. doi: 10.1007/s11105-012-0461-3
Horváth, E. M., Peter, S. O., Joët, T., Rumeau, D., Cournac, L., Horváth, G. V., et al. (2000). Targeted inactivation of the plastid ndhB gene in tobacco results in an enhanced sensitivity of photosynthesis to moderate stomatal closure. Plant Physiol. 123, 1337–1350. doi: 10.1104/pp.123.4.1337
Jansen, R. K., Cai, Z., Raubeson, L. A., Daniell, H., dePamphilis, C. W., Leebens-Mack, J., et al. (2007). Analysis of 81 genes from 64 plastid genomes resolves relationships in angiosperms and identifies genome-scale evolutionary patterns. Proc. Natl. Acad. Sci. U. S. A. 104, 19369–19374. doi: 10.1073/pnas.0709121104
Jin, J.-J., Yu, W.-B., Yang, J.-B., Song, Y., dePamphilis, C. W., Yi, T.-S., et al. (2020). GetOrganelle: a fast and versatile toolkit for accurate de novo assembly of organelle genomes. Genome Biol. 21:241. doi: 10.1186/s13059-020-02154-5
Katoh, K., and Standley, D. M. (2013). MAFFT Multiple Sequence Alignment Software Version 7: improvements in performance and usability. Mol. Biol. Evol. 30, 772–780. doi: 10.1093/molbev/mst010
Kessous, I. M., Neves, B., Couto, D. R., Paixão-Souza, B., Pederneiras, L. C., Moura, R. L., et al. (2020). Historical biogeography of a Brazilian lineage of Tillandsioideae (subtribe Vrieseinae, Bromeliaceae): the Paranaean Sea hypothesized as the main vicariant event. Bot. J. Linn. Soc. 192, 625–641. doi: 10.1093/botlinnean/boz038
Leme, E., Halbritter, H., and Barfuss, M. (2017). Waltillia, a new monotypic genus in Tillandsioideae (Bromeliaceae) arises from a rediscovered, allegedly extinct species from Brazil. Phytotaxa 299, 1–35. doi: 10.11646/phytotaxa.299.1.1
Li, F.-W., Kuo, L.-Y., Pryer, K. M., and Rothfels, C. J. (2016). Genes translocated into the plastid inverted repeat show decelerated substitution rates and elevated GC Content. Genome Biol. Evol. 8, 2452–2458. doi: 10.1093/gbe/evw167
Li, H.-T., Luo, Y., Gan, L., Ma, P.-F., Gao, L.-M., Yang, J.-B., et al. (2021). Plastid phylogenomic insights into relationships of all flowering plant families. BMC Biol. 19:232. doi: 10.1186/s12915-021-01166-2
Liu, C., Zhang, W., and He, Y. (2022). The complete chloroplast genome of Ananas comosus var. erectifolius (L.B. Smith) Coppens & Leal. Mitochondrial DNA B Resour. 7, 431–433. doi: 10.1080/23802359.2022.2039081
Liu, J., Niu, Y.-F., Liu, S.-H., and Ni, S.-B. (2016). The complete pineapple (Ananas comosus; Bromeliaceae) varieties F153 chloroplast genome sequence. Mitochondrial DNA B Resour. 1, 390–391. doi: 10.1080/23802359.2016.1174084
Loiseau, O., Mota Machado, T., Paris, M., Koubínová, D., Dexter, K. G., Versieux, L. M., et al. (2021). Genome skimming reveals widespread hybridization in a Neotropical flowering plant radiation. Front. Ecol. Evol. 9:668281. doi: 10.3389/fevo.2021.668281
Lowe, T. M., and Chan, P. P. (2016). tRNAscan-SE On-line: integrating search and context for analysis of transfer RNA genes. Nucleic Acids Res. 44, W54–W57. doi: 10.1093/nar/gkw413
Machado, T. M., Loiseau, O., Paris, M., Weigand, A., Versieux, L. M., Stehmann, J. R., et al. (2020). Systematics of Vriesea (Bromeliaceae): phylogenetic relationships based on nuclear gene and partial plastome sequences. Bot. J. Linn. Soc. 192, 656–674. doi: 10.1093/botlinnean/boz102
Milne, I., Stephen, G., Bayer, M., Cock, P. J. A., Pritchard, L., Cardle, L., et al. (2013). Using Tablet for visual exploration of second-generation sequencing data. Brief. Bioinformatics 14, 193–202. doi: 10.1093/bib/bbs012
Möbus, J., Kiefer, C., Quandt, D., Barfuss, M. H., and Koch, M. A. (2021). Setting the evolutionary timeline: Tillandsia landbeckii in the Chilean Atacama Desert. Plant Syst. Evol. 307:39. doi: 10.1007/s00606-021-01760-5
Mower, J. P., and Vickrey, T. L. (2018). “Chapter Nine - Structural diversity among plastid genomes of land plants,” in Advances in Botanical Research, eds S.-M. Chaw and R. K. Jansen (Cambridge, MA: Academic Press), 263–292. doi: 10.1016/bs.abr.2017.11.013
Nashima, K., Terakami, S., Nishitani, C., Kunihisa, M., Shoda, M., Takeuchi, M., et al. (2015). Complete chloroplast genome sequence of pineapple (Ananas comosus). Tree Genet. Genomes 11:60. doi: 10.1007/s11295-015-0892-8
Neubig, K. M., Whitten, W. M., Carlsward, B. S., Blanco, M. A., Endara, L., Williams, N. H., et al. (2009). Phylogenetic utility of ycf1 in orchids: a plastid gene more variable than matK. Plant Syst. Evol. 277, 75–84. doi: 10.1007/s00606-008-0105-0
Neubig, K. M., Whitten, W. M., Williams, N. H., Blanco, M. A., Endara, L., Burleigh, J. G., et al. (2012). Generic recircumscriptions of Oncidiinae (Orchidaceae: Cymbidieae) based on maximum likelihood analysis of combined DNA datasets. Bot. J. Linn. Soc. 168, 117–146. doi: 10.1111/j.1095-8339.2011.01194.x
Palmer, J. D. (1983). Chloroplast DNA exists in two orientations. Nature 301, 92–93. doi: 10.1038/301092a0
Paradis, E., and Schliep, K. (2019). ape 5.0: an environment for modern phylogenetics and evolutionary analyses in R. Bioinformatics 35, 526–528. doi: 10.1093/bioinformatics/bty633
Parks, M., Cronn, R., and Liston, A. (2009). Increasing phylogenetic resolution at low taxonomic levels using massively parallel sequencing of chloroplast genomes. BMC Biol. 7:84. doi: 10.1186/1741-7007-7-84
Paule, J., Schmickl, R., Fér, T., Matuszak-Renger, S., Halbritter, H., and Zizka, G. (2020). Phylogenomic insights into the Fascicularia-Ochagavia group (Bromelioideae, Bromeliaceae). Bot. J. Linn. Soc. 192, 642–655. doi: 10.1093/botlinnean/boz085
Perry, A. S., and Wolfe, K. H. (2002). Nucleotide substitution rates in legume chloroplast DNA depend on the presence of the inverted repeat. J. Mol. Evol. 55, 501–508. doi: 10.1007/s00239-002-2333-y
Pinzón, J. P., Ramírez-Morillo, I. M., Carnevali, G., Barfuss, M. H. J., Till, W., Tun, J., et al. (2016). Phylogenetics and evolution of the Tillandsia utriculata complex (Bromeliaceae, Tillandsioideae) inferred from three plastid DNA markers and the ETS of the nuclear ribosomal DNA. Bot. J. Linn. Soc. 181, 362–390. doi: 10.1111/boj.12425
Plummer, M., Best, N., Cowles, K., and Vines, K. (2006). CODA: convergence diagnosis and output analysis for MCMC. R News 6, 7–11.
Poczai, P., and Hyvönen, J. (2017). The complete chloroplast genome sequence of the CAM epiphyte Spanish moss (Tillandsia usneoides, Bromeliaceae) and its comparative analysis. PLoS One 12:e0187199. doi: 10.1371/journal.pone.0187199
R Core Team (2021). R: A Language and Environment for Statistical Computing. Vienna: R Foundation for Statistical Computing.
Rabosky, D. L. (2014). Automatic detection of key innovations, rate shifts, and diversity-dependence on phylogenetic trees. PLoS One 9:e89543. doi: 10.1371/journal.pone.0089543
Ravi, V., Khurana, J. P., Tyagi, A. K., and Khurana, P. (2008). An update on chloroplast genomes. Plant Syst. Evol. 271, 101–122.
Redwan, R. M., Saidin, A., and Kumar, S. V. (2015). Complete chloroplast genome sequence of MD-2 pineapple and its comparative analysis among nine other plants from the subclass Commelinidae. BMC Plant Biol. 15:196. doi: 10.1186/s12870-015-0587-1
Revell, L. J. (2012). phytools: an R package for phylogenetic comparative biology (and other things). Methods Ecol. Evol. 3, 217–223. doi: 10.1111/j.2041-210X.2011.00169.x
Ruhfel, B. R., Gitzendanner, M. A., Soltis, P. S., Soltis, D. E., and Burleigh, J. G. (2014). From algae to angiosperms–inferring the phylogeny of green plants (Viridiplantae) from 360 plastid genomes. BMC Evol. Biol. 14:23. doi: 10.1186/1471-2148-14-23
Ruhlman, T. A., Chang, W.-J., Chen, J. J., Huang, Y.-T., Chan, M.-T., Zhang, J., et al. (2015). NDH expression marks major transitions in plant evolution and reveals coordinate intracellular gene loss. BMC Plant Biol. 15:100. doi: 10.1186/s12870-015-0484-7
Shaw, J., Lickey, E. B., Schilling, E. E., and Small, R. L. (2007). Comparison of whole chloroplast genome sequences to choose noncoding regions for phylogenetic studies in angiosperms: the tortoise and the hare III. Am. J. Bot. 94, 275–288. doi: 10.3732/ajb.94.3.275
Shi, C., Liu, Y., Huang, H., Xia, E.-H., Zhang, H.-B., and Gao, L.-Z. (2013). Contradiction between plastid gene transcription and function due to complex posttranscriptional splicing: an exemplary study of ycf15 function and evolution in angiosperms. PLoS One 8:e59620. doi: 10.1371/journal.pone.0059620
Shi, S., Li, J., Sun, J., Yu, J., and Zhou, S. (2013). Phylogeny and classification of Prunus sensu lato (Rosaceae). J. Integr. Plant Biol. 55, 1069–1079. doi: 10.1111/jipb.12095
Smith, S. A., and Donoghue, M. J. (2008). Rates of molecular evolution ere linked to life history in flowering plants. Science 322, 86–89. doi: 10.1126/science.1163197
Stamatakis, A. (2014). RAxML version 8: a tool for phylogenetic analysis and post-analysis of large phylogenies. Bioinformatics 30, 1312–1313. doi: 10.1093/bioinformatics/btu033
Terry, R. G., Brown, G. K., and Olmstead, R. G. (1997). Phylogenetic relationships in subfamily Tillandsioideae (Bromeliaceae) using ndhF sequences. Syst. Bot. 22, 333–345. doi: 10.2307/2419461
Townsend, J. P. (2007). Profiling phylogenetic informativeness. Syst. Biol. 56, 222–231. doi: 10.1080/10635150701311362
Versieux, L. M., Barbará, T., Wanderley, M., das, G. L., Calvente, A., Fay, M. F., et al. (2012). Molecular phylogenetics of the Brazilian giant bromeliads (Alcantarea, Bromeliaceae): implications for morphological evolution and biogeography. Mol. Phylogenet. Evol. 64, 177–189. doi: 10.1016/j.ympev.2012.03.015
Walker, J. F., Jansen, R. K., Zanis, M. J., and Emery, N. C. (2015). Sources of inversion variation in the small single copy (SSC) region of chloroplast genomes. Am. J. Bot. 102, 1751–1752. doi: 10.3732/ajb.1500299
Wick, R. R., Schultz, M. B., Zobel, J., and Holt, K. E. (2015). Bandage: interactive visualization of de novo genome assemblies. Bioinformatics 31, 3350–3352. doi: 10.1093/bioinformatics/btv383
Wicke, S., Schneeweiss, G. M., dePamphilis, C. W., Müller, K. F., and Quandt, D. (2011). The evolution of the plastid chromosome in land plants: gene content, gene order, gene function. Plant Mol. Biol. 76, 273–297. doi: 10.1007/s11103-011-9762-4
Wolfe, K. H., Li, W. H., and Sharp, P. M. (1987). Rates of nucleotide substitution vary greatly among plant mitochondrial, chloroplast, and nuclear DNAs. Proc. Natl. Acad. Sci. 84, 9054–9058. doi: 10.1073/pnas.84.24.9054
Wu, H., Yang, J.-B., Liu, J.-X., Li, D.-Z., and Ma, P.-F. (2022). Organelle phylogenomics and extensive conflicting phylogenetic signals in the monocot order poales. Front. Plant Sci. 12:824672. doi: 10.3389/fpls.2021.824672
Yardeni, G., Viruel, J., Paris, M., Hess, J., Groot Crego, C., de La Harpe, M., et al. (2022). Taxon-specific or universal? Using target capture to study the evolutionary history of rapid radiations. Mol. Ecol. Resour. 22, 927–945. doi: 10.1111/1755-0998.13523
Keywords: ancestral state reconstruction, evolutionary rate shifts, gene translocation, inverted repeats (IRs), inversions, plastome, phylogenetic informativeness
Citation: Vera-Paz SI, Díaz Contreras Díaz DD, Jost M, Wanke S, Rossado AJ, Hernández-Gutiérrez R, Salazar GA, Magallón S, Gouda EJ, Ramírez-Morillo IM, Donadío S and Granados Mendoza C (2022) New plastome structural rearrangements discovered in core Tillandsioideae (Bromeliaceae) support recently adopted taxonomy. Front. Plant Sci. 13:924922. doi: 10.3389/fpls.2022.924922
Received: 20 April 2022; Accepted: 30 June 2022;
Published: 01 August 2022.
Edited by:
Shu-Miaw Chaw, Biodiversity Research Center, Academia Sinica, TaiwanReviewed by:
Veronica Aydos Thode, Federal University of Rio Grande do Sul, BrazilSusanne Renner, Washington University in St. Louis, United States
Copyright © 2022 Vera-Paz, Díaz Contreras Díaz, Jost, Wanke, Rossado, Hernández-Gutiérrez, Salazar, Magallón, Gouda, Ramírez-Morillo, Donadío and Granados Mendoza. This is an open-access article distributed under the terms of the Creative Commons Attribution License (CC BY). The use, distribution or reproduction in other forums is permitted, provided the original author(s) and the copyright owner(s) are credited and that the original publication in this journal is cited, in accordance with accepted academic practice. No use, distribution or reproduction is permitted which does not comply with these terms.
*Correspondence: Carolina Granados Mendoza, carolina.granados@ib.unam.mx
†These authors have contributed equally to this work and share first authorship