 Lili Guo1
 Yuying Li1Chenjie Zhang1Zhanying Wang2
 John E. Carlson3
 Weinlun Yin4
 Xiuxin Zhang5*
 Xiaogai Hou5*
- 1College of Tree Peony, Henan University of Science and Technology, Luoyang, Henan, China
- 2Department of Horticulture, Luoyang Academy of Agricultural and Forestry Sciences, Luoyang, Henan, China
- 3Department of Ecosystem Science and Management, Pennsylvania State University, University Park, PA, United States
- 4College of Biological Sciences and Technology, Beijing Forestry University, Beijing, China
- 5Center of Peony, Institute of Vegetables and Flowers, Chinese Academy of Agricultural Science, Beijing, China
As a candidate national flower of China, tree peony has extremely high ornamental, medicinal and oil value. However, the short florescence and rarity of early-flowering and late-flowering varieties restrict further improvement of the economic value of tree peony. Specific miRNAs and their target genes engaged in tree peony floral florescence, development and senescence remain unknown. This report presents the integrated analysis of the miRNAome, transcriptome and degradome of tree peony petals collected from blooming, initial flowering, full blooming and decay stages in early-flowering variety Paeonia ostii ‘Fengdan’, an early-flowering mutant line of Paeonia ostii ‘Fengdan’ and late-flowering variety Paeonia suffruticosa ‘Lianhe’. Transcriptome analysis revealed a transcript (‘psu.G.00014095’) which was annotated as a xyloglucan endotransglycosylase/hydrolase precursor XTH-25 and found to be differentially expressed across flower developmental stages in Paeonia ostii ‘Fengdan’ and Paeonia suffruticosa ‘Lianhe’. The miRNA-mRNA modules were presented significant enrichment in various pathways such as plant hormone signal transduction, indole alkaloid biosynthesis, arachidonic acid metabolism, folate biosynthesis, fatty acid elongation, and the MAPK signaling pathway. Multiple miRNA-mRNA-TF modules demonstrated the potential functions of MYB-related, bHLH, Trihelix, NAC, GRAS and HD-ZIP TF families in floral florescence, development, and senescence of tree peony. Comparative spatio-temporal expression investigation of eight floral-favored miRNA-target modules suggested that transcript ‘psu.T.00024044’ and microRNA mtr-miR166g-5p are involved in the floral florescence, development and senescence associated agronomic traits of tree peony. The results might accelerate the understanding of the potential regulation mechanism in regards to floral florescence, development and abscission, and supply guidance for tree peony breeding of varieties with later and longer florescence characteristics.
1 Introduction
Tree peony (Paeonia suffruticosa Andr.) is a perennial deciduous shrub of Paeoniaceae. All kinds of tree peony species are endemic to China (Wang et al., 2019). Tree peony, famous for ‘the king of flowers’, is big, colorful, fragrant, graceful and elegant, symbolizing wealth and prosperity, and is renowned as a symbol of Chinese civilization (Yang et al., 2020). The poem ‘Only peony is the true color of the country, which moves the capital when they are blossoming’, vividly describes the people’s deep love for peony flowers in the Tang Dynasty. These days, tree peonies are cultivated all over the world, and people’s enthusiasm to cultivate and plant tree peonies is still increasing (Hong et al., 2017).
Research on ornamental characters of tree peony has made continuous progress from identification and cultivation of varieties to improved cultivation technology. There are already more than 2,000 ornamental varieties of tree peony in China (Luo et al., 2021). However, the flowering time of tree peony is still quite short and convergent. Under natural conditions, it takes only 50-60 days from budding to fading; the flowering period is 3-5 days for a single flower and 10-15 days for a colony of plants. Most tree peony varieties are middle-flowering varieties, with the proportion of early-flowering and late-flowering varieties being quite few (Li et al., 2011). In addition, due to the lack of research on the genetic basis and molecular regulation mechanism of flowering in tree peony, it is difficult to improve the breeding and cultivation techniques to meet the demand for prolonging of flowering time of tree peony. These are all important factors restricting the improvement of tree peony ornamental value and the further development of international markets (Kamenetsky et al., 2003). Florescence has thus been one of the key ornamental traits that limit the improving of the economic value of tree peony, and the theoretical and technical research needed to solve this problem has become a key focus in both the public and scientific horticulture communities.
In efforts to prolong the ornamental period of tree peony, studies have been carried out from such aspects as early and late flowering hybrid breeding and growth regulator regulation. However, conventional breeding of woody perennials in tree peony is time-consuming and labor-intensive making it difficult to quickly meet the market demand for new varieties. Although high-density genetic maps and QTL identification are now being reported, the low breeding efficiency greatly currently remains a limiting factor in the selection and breeding process of tree peony varieties (Cai et al., 2015; Li et al., 2019; Zhang et al., 2019). It should thus be of great value to construct the transcriptional regulatory network for blooming, to reveal the regulation basis of early and late blooming, and explore the application of genetic regulation factors for accelerating the breeding of tree peony varieties with extra-early, late, and long-lasting flowers.
MicroRNAs (miRNA) are short (21-24 nucleotide) RNAs originated from noncoding RNAs root in the expression of miRNA genes (MIR genes) (Basso et al., 2019). MiRNAs have become crucial modulator of gene expression, primarily by means of the cleavage/inhibit of target genes translation during or after transcription (Xie et al., 2020). MiRNAs regulate almost all the crucial biological processes of the plants’ life cycle, such as growth and development (Li et al., 2019), flowering (Spanudakis and Jackson, 2014), ripening (Guo et al., 2018), postharvest senescence (Pei et al., 2013; Chen et al., 2020), and plant-environment interactions (Basso et al., 2019). MiRNAs can rapidly reprogram the expression patterns of downstream genes that strictly regulate agronomic trait, for instance, florescence (Wang et al., 2009). Previous studies have emphasized the significance of miRNAs involved in floral transition and flowering regulation (Waheed and Zeng, 2020). Studies of miR156, miR172, miR390, miR159, miR169, and miR399 have shown that they are key factors affecting flowering time (Waheed and Zeng, 2020).
Integrated analysis of the miRNAome, transcriptome, and degradome analyses can enhance the understanding of the genome wide co-expression patterns of miRNA-mRNA pairs and links the biological interactions of miRNA-target modules (Liu et al., 2020a; Wang et al., 2021). Integrated miRNA, transcriptome, and degradome-seq analysis of miRNA-mRNA involved in flowering of pepper (Shu et al., 2021), floral development and abscission of yellow lupine (Glazinska et al., 2019), female sterility of pomegranate (Chen et al., 2020), male sterility of rice (Sun et al., 2021), flower development across capsicum species (Lopez-Ortiz et al., 2021), stamen development in moso bamboo (Cheng et al., 2019), flowering induction in Lilium×formolongi (Zhang et al., 2021), floral transition in Magnolia×soulangeana ‘Changchun’ (Sun et al., 2021) has provided evidence demonstrated of regulatory pathways and gene networks of miRNAs and their targets associated with flowering. Moreover, studies have shown that miR319-TCP, miR156-SPL, miR159-MYB, miR172-AP2 and miR399-PHO2 nodes play important roles in floral transition (Waheed and Zeng, 2020).
Prediction of miRNAs in tree peony have been reported, including miRNAs in response to copper stress (Jin et al., 2015), involved in bud dormancy release (Zhang et al., 2018), seed fatty acid synthesis (Yin et al., 2018), flower spot formation (Zhao et al., 2019), petal variegation (Shi et al., 2019), flower development (Han et al., 2020), and brassinolide treatment on flowering (Zhang et al., 2022). In herbaceous peony, miRNAs involved in response to stress from high temperature (Hao et al., 2017) and Botrytis cinerea infection (Zhao et al., 2015), as well as lateral branch formation (Liu et al., 2020) have been predicted. In addition, miR156e-3p of herbaceous peony has been proved to enhance anthocyanin accumulation in lateral branches of transgenic Arabidopsis thaliana (Zhao et al., 2017). However, currently, miRNAome analysis during reproductive growth, has not yet been applied to the elucidation of miRNA-mRNA module regulatory networks specific to the trait of flowering among tree peony varieties with contrasting flowering times.
In this study, we identified and determined the critical miRNA and their MIR genes using miRNAome analysis combined with transcriptome, degradome and qRT-PCR verification during flower development stages in three tree peony varieties with different flowering times. This research might enlighten the composition of post-transcriptional networks in tree peony floral florescence, development and abscission, and facilitate innovations for breeding programs aiming to prolong the flowering period.
2 Materials and methods
2.1 Materials preparation
Early-flowering variety Paeonia ostii ‘Fengdan’ (FD), an early-flowering mutant line of Paeonia ostii ‘Fengdan’ (MU), and late-flowering variety Paeonia suffruticosa ‘Lianhe’ (LH) were selected as the experiment materials. FD, MU, and LH used in this study were 13-years-old plants with single and white flowers. Fresh petals were collected at 9:00-10:00 am on different days at blooming stage (BS), initial flowering stage (IF), full bloom stage (FB), and decay stage (DE), respectively. Abbreviations of sample and library names were presented in Table 1. Three biological replicates are different flowers on different stems of the same plant at each developmental stage for each variety respectively. For each flower, all the petals were sampled and pooled prior to freezing by liquid nitrogen. The sampled petals were stored in the freezer (-80°C) for RNA extraction.
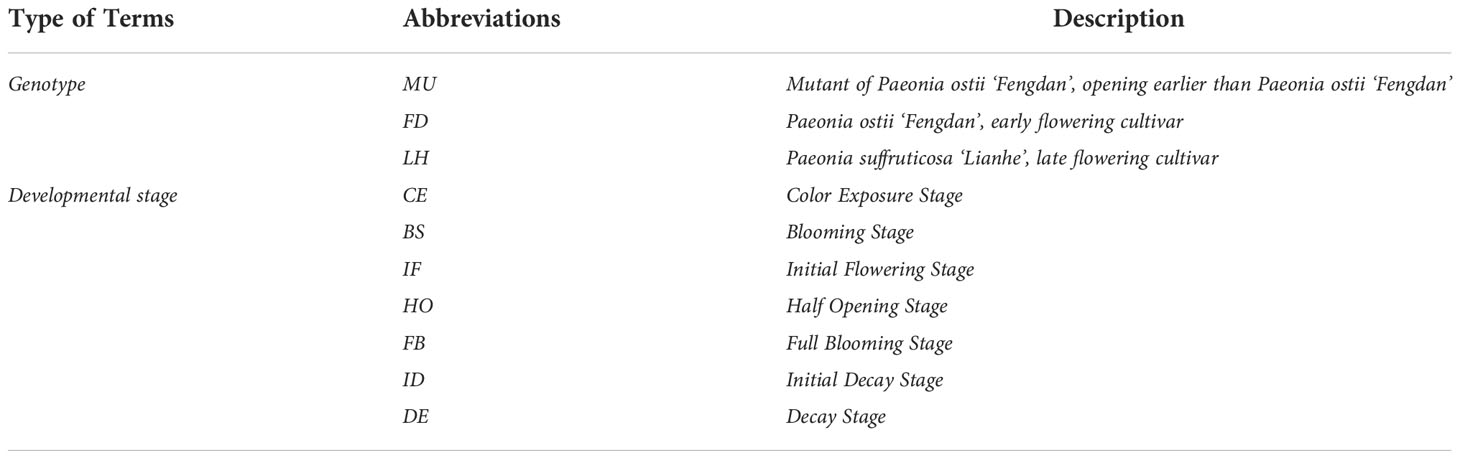
Table 1 Summary of the abbreviations used for sample names and library names.
2.2 RNA isolation, library construction and sequencing
In total, 36 libraries were prepared for miRNAome and transcriptome analysis separately (Table S1). Approximately 200 mg petals were used for total RNA extraction. Total RNA integrity was initially assessed by denaturing agarose gel electrophoresis, then confirmed by Bioanalyzer 2100 (Agilent, CA, USA). Total RNA amount and purity quantification were performed on NanoDrop ND-1000 (NanoDrop, Wilmington, DE, USA). Total RNA with a concentration>100 ng/μL, RNA integrity number >7.0, OD260/280>1.8 and amount>50 μg were used for library construction. Petals from four flower development stages of each variety were mixed prior to the degradome library construction. That is, a total of 3 degradome libraries were constructed for degradome sequencing. Kits and reagents used for RNA isolation, purification, quantification, and libraries construction are listed in Table S2. Transcriptome sequencing was performed by the 2×150 bp paired-end sequencing (PE150) on Illumina Novaseq™ 6000. miRNAome and degradome sequencing were performed by the 1×50 bp single-end sequencing on Illumina Hiseq2500. Libraries construction and sequencing were performed at LC-BIO (Hangzhou, China) according to the vendor’s recommended protocol.
2.3 Data processing of miRNAome, transcriptome, and degradome
2.3.1 Data processing of miRNAome
Raw data filtering was processed using ACGT101-miR (LC Sciences, Houston, Texas, USA). Sequences with a length of 18-26 nt were mapped to the genome of tree peony (https://ftp.cngb.org/pub/CNSA/data1/CNP0000281/CNS0044072/CNA0002540/) (Lv et al., 2020) and miRBase 22.0 (http://www.mirbase.org/). Sequences mapped to miRBase 22.0 were characterized as known miRNA. Sequences unmapped to miRBase 22.0 and matched to tree peony genome were identified as candidate novel miRNAs. Secondary structure prediction of miRNA was performed by RNAfold (http://rna.tbi.univie.ac.at/cgi-bin/RNAWebSuite/RNAfold.cgi). Sequences possess stem-loop structure and satisfy the requirement of miRNA prediction (Axtell and Meyers, 2018) were considered as real miRNAs of tree peony. Differentially expressed miRNA (DEM) analysis based on normalized (Li et al., 2016) deep-sequencing counts was performed by ANOVA with the criterion of P ≤ 0.05. DEM target genes prediction was performed by PsRobot 1.2 to characterize the miRNA binding sites.
2.3.2 Data processing of transcriptome
Raw data filtering was conducted by FASTP (https://github.com/OpenGene/fastp) to remove reads containing adaptor contamination, low quality bases and undetermined bases. FastQC (http://www.bioinformatics.babraham.ac.uk/projects/fastqc/, 0.11.9) and FASTP was used for sequences quality verification. HISAT2 (https://ccb.jhu.edu/software/hisat2) was used for the reads mapping to the reference genome of tree peony (Lv et al., 2020). Reads were assembled by StringTie (http://ccb.jhu.edu/software/stringtie/ ) (Version: stringtie-1.3.4d.Linux_x86_64). Data merging was conducted using gffcompare http://ccb.jhu.edu/software/stringtie/gffcompare.shtml). Transcripts’ expression levels were estimated by StringTie according to FPKM method (FPKM=[total_exon_fragments/mapped_reads(millions)×exon_length(kB)]). Identification of DEGs with fold change>2 or <0.5 and P value<0.05 were performed using edgeR (https://bioconductor.org/packages/release/bioc/html/edgeR.html). GO and KEGG pathway investigation were performed by DAVID (https://david.ncifcrf.gov/). TFs were investigated by iTALK (v1.2) software596. WGCNA was performed according to Langfelder and Horvath (2008).
2.3.3 Data processing of degradome
Degradome data processing was performed by program ACGT10-DEG (LC Sciences, Houston, Texas, USA) using software package CleaveLand4 according the following command: degradome and transcriptome data alignment and generate a degradome density file, miRNAs and transcriptome alignment to parse miRNA-mRNA potential target site, cross-referencing to the degradome data to demonstrate the slicing site.
2.4 miRNAs and targets expression assay
In total, eight miRNA-target pairs associated with floral florescence, development and senescence were randomly selected for quantitative real-time PCR (qRT-PCR) analysis. Fresh petals of FD, MU and LH were collected at developmental stages (BS, IF, FB, DE) respectively. For each developmental stage, petals from three different flowers on different stems of the same plant were sampled individually. Total RNA extraction, miRNA extraction, cDNA synthesis for mRNA and miRNA were performed according to the instructions of manufacturers. Kits information for total RNA/miRNA extraction and cDNA synthesis are shown in Table S2. The EF1-α and U6 were used as the reference for mRNA and tailing reaction miRNA analysis separately. Primer sequences for qRT-PCR assay are listed in Table S3. qRT-PCR analysis for miRNA and targets were both performed on a BIORAD CFX96 machine. Three technical replicates per reaction were conducted in the qRT-PCR analyses to ensure statistical validity. The relative quantity was calculated on the basis of 2−ΔΔCT method (Livak and Schmittgen, 2001).
3 Results
3.1 Morphological comparison of flowering time in three tree peony varieties
The date when 80% of flowers reached color exposure (CE), blooming stage (BS), initial flowering (IF), half opening (HO), full blooming (FB), initial decay (ID), and decay (DE) stages were investigated in FD, MU, and LH in 2020 and 2021 respectively (Figure 1A). The flower duration time (date from CE to DE) of 80% flowers of FD, MU, LH were also investigated. FD is an early flower variety, while LH is a late flowering variety. MU was a mutant of FD, which blossomed seven days earlier than FD in 2020, and nine days earlier than FD in 2021. Flowering time of FD was 16 days earlier than LH in 2020, and 10 days earlier than LH in 2021. Flowering time of MU was 23 and 19 days earlier than LH in 2020 and 2021, respectively. In addition, floral florescence per plant was 16-17 days for FD, 13-15 days for MU, and 11-12 days for LH, which demonstrated that FD possesses the longest blooming time (Figures 1B, C).
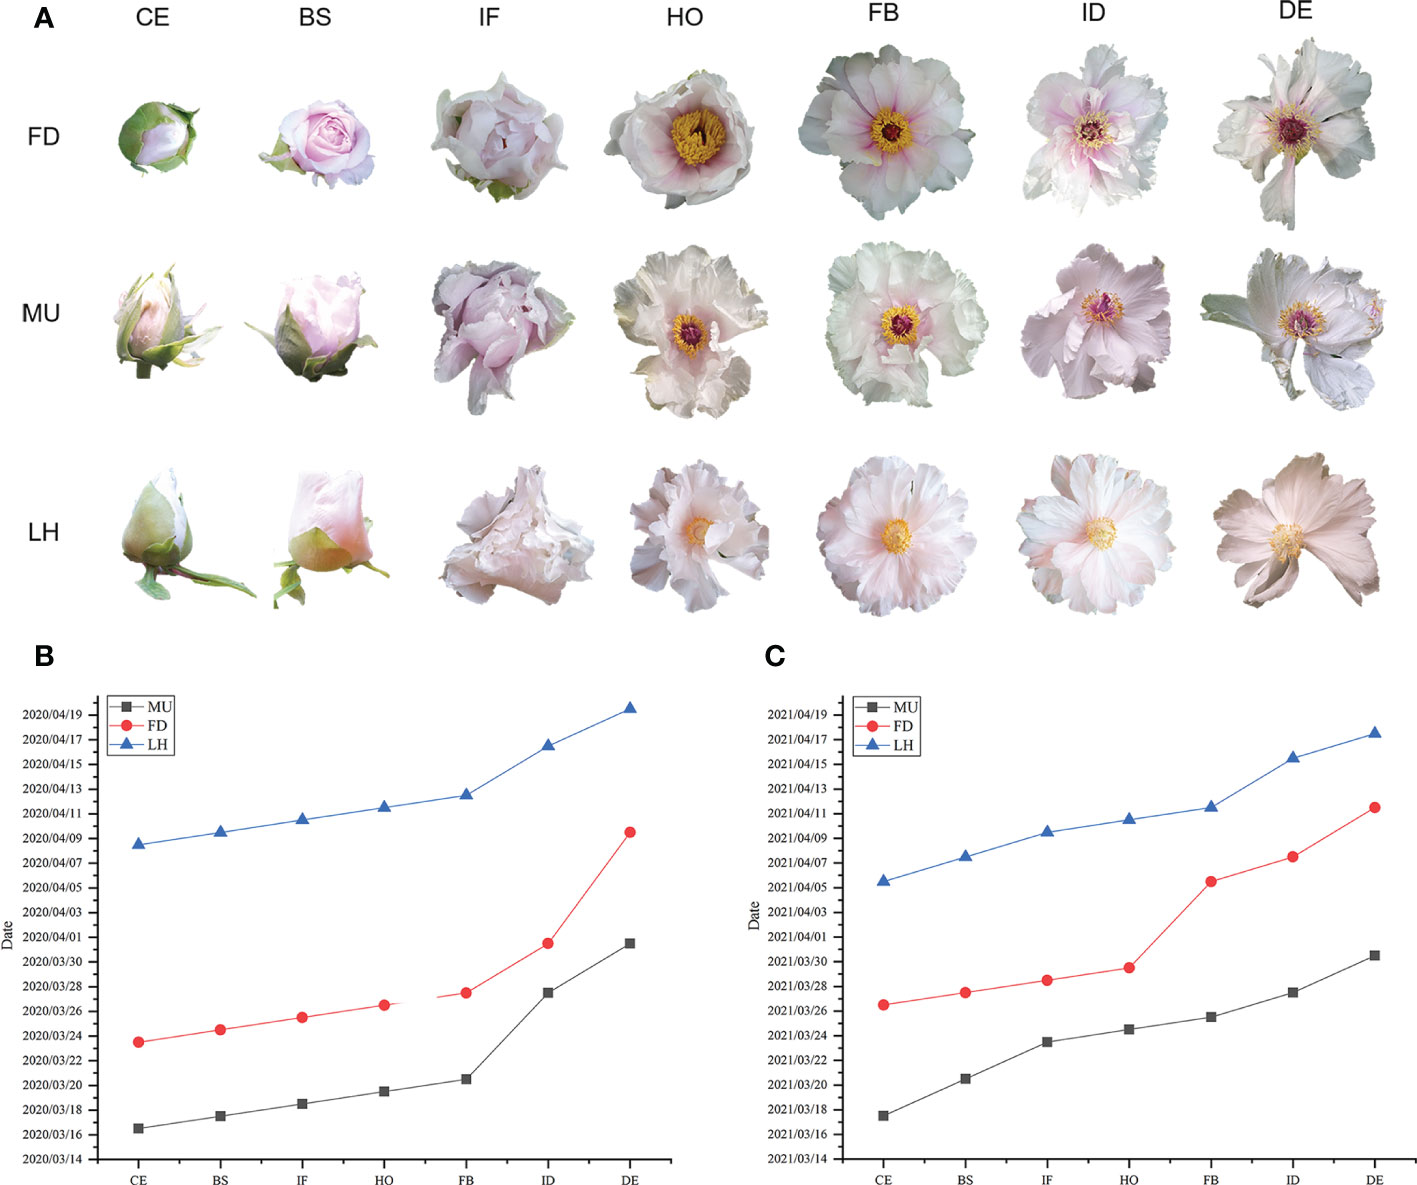
Figure 1 Phenotype and flowering time investigation of FD, MU, and LH. (A) Flower phenotype at different developmental stages of FD, MU, and LH. (B) The date when 80% flowers reached different development stages in FD, MU, and LH investigated in 2020. (C) The date when 80% flowers reached different development stages in FD, MU, and LH investigated in 2021.
3.2 MiRNAome analysis
3.2.1 Expression miRNAs of tree peony revealed by miRNAome
Petal samples were collected at BS, IF, FB, and DE stages from three replicates of each from the three varieties, respectively. An overview of miRNAome sequencing data is presented in Table S4. Over 650.34 million raw reads were produced, therein to, 123.55 million filtered miRNA reads were acquired. A total of 252, 297, and 263 miRNAs were determined to be expressed in common across the four developmental stages (BS, IF, FB, and DE) in FD, MU, and LH, respectively (Figures S1A–C). There are altogether 290, 311, 252, and 226 miRNAs expressed in common across the varieties (FD, MU, and LH) at developmental stages BS, IF, FB, and DE, respectively (Figures S1E–H). Finally, a total of 164 miRNA were expressed in common across all four developmental stages and three varieties (Figures S1D, I).
3.2.2 Known and predicted miRNAs of tree peony revealed by sequencing the miRNAome
In total, 2,444 pre-miRNA and 2,617 unique miRNAs were identified by miRNAome analysis (Table 2). The miRNAs were classified into known and predicted groups (Table S5). Four types of known miRNAs were included in group1 (gp1), group2a (gp2a), group1 (gp2b), and group1 (gp3), while only predicted miRNAs were included in group4 (gp4). In ‘gp1’ were placed the reads that mapped to specific miRNAs/pre-miRNAs in miRbase for which the pre-miRNAs mapped to the tree peony genome and to the ESTs. In ‘gp2a’ were placed reads that mapped to selected miRNAs/pre-miRNAs in miRbase, but for which the pre-miRNAs did not map to the tree peony genome. However, the reads (the miRNAs of the pre-miRNAs) in this group did map to the tree peony genome. Also, the extended sequences from the corresponding loci in the tree peony genome which could form hairpins. In ‘gp2b’ were placed reads that mapped to miRNAs/pre-miRNAs of selected species in miRbase. The pre-miRNAs did not map to the tree peony genome, however, the reads (the miRNAs from the pre-miRNAs) did map to the tree peony genome. Also, the extended sequences at the genome loci could not form hairpins in this case. In ‘gp3’ were placed reads that mapped to the selected miRNAs/pre-miRNAs in miRbase but for which the pre-miRNAs do not map to the tree peony genome, and also the reads did not map to the tree peony genome. In ‘gp4’ were placed reads that did not map to the selected pre-miRNAs in miRbase. However, these reads did map to the tree peony genome and the extended sequences from the genome loci which could form hairpins. In summary, for pre-miRNA, a total of 735 known miRNAs including gp1 (10), gp2a (75), gp2b (611), gp3 (39) were identified, and a total of 1,709 predicted miRNAs which only include gp4 were characterized. For unique miRNA, a total of 796 known miRNAs including gp1 (15), gp2a (106), gp2b (632), gp3 (43) were defined, and a total of 1,812 predicted miRNAs which only include gp4 were detected (Table 2).
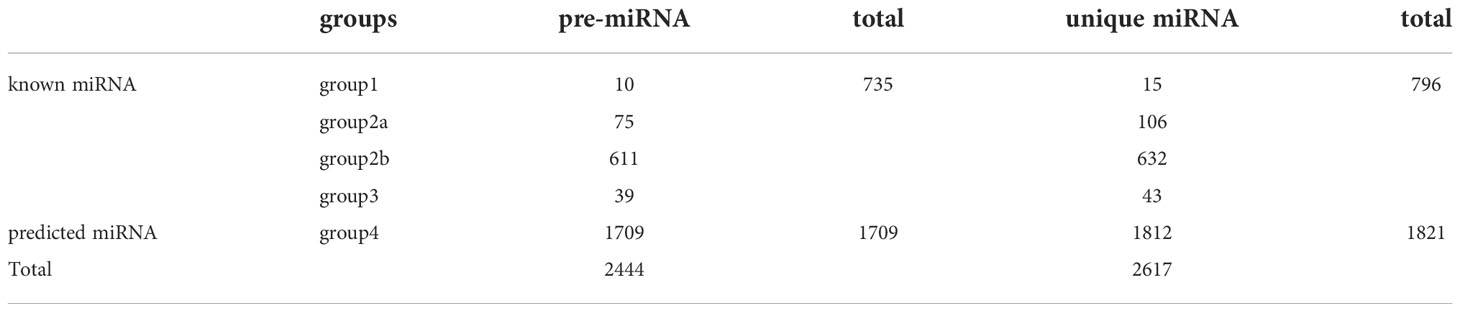
Table 2 Summary of known and predicted miRNA.
3.2.3 Differentially expressed miRNAs among stages in floral florescence development
To identify DEMs engaged in floral florescence and senescence, significantly differential expressed miRNAs (P<0.01, P<0.05, P<0.1) were analyzed across four developmental stages and three varieties. In total, 146, 313, and 201 miRNAs showed signifcant differential expression (P<0.05) across four developmental stages in FD, MU, and LH, respectively. A total of 253, 227, 285, 270 miRNAs revealed signifcant differential expression (P<0.05) across three varieties (FD, MU, LH) at stage of BS, IF, FB, and DE separately. The numbers of differentially expressed up- and down-regulated miRNAs in different groups are shown in Figure S2. Up-regulated DEMs refer to the miRNAs having signifcantly higher expression, while down-regulated DEMs refer to the miRNAs which present prominently lower expression.
A wide variety of miRNAs showed differential expression specific to genotype and developmental stage. However, no DEMs were found to be co-expressed across the four developmental stages even in a single variety, which meant the analysis of co-expressed DEMs between varieties based on intersection of DEMs across developmental stages could not be performed. In fact, higher numbers of differentially expressed miRNAs were presented in DEvsBS, DEvsFB, and DEvsIF when comparing DEMs across developmental stages irrespective of variety. MU constantly had a higher number of DEMs commonly expressed when compared with FD and LH (Figures 2A–C). When comparing across varieties (FD, MU and LH) at specific developmental stages, 18, 16, 24 and 9 intersecting DEMs were obtained at developmental stages BS, IF, FB and DE respectively (Figures 3A–D). Meanwhile, there were more DEMs exclusively expressed in the FB stage than BS, IF and DE stages in all three of the varieties (Figures 3A–D). Interestingly however, three DEMs were identified that simultaneously expressed in the BS, IF, and FB stages. Finally, the expression of 6, 8, 16, and 8 stage-specific DEMs, at BS, IF, FB and DE stages, respectively, were not affected by variety (Figure 3E).
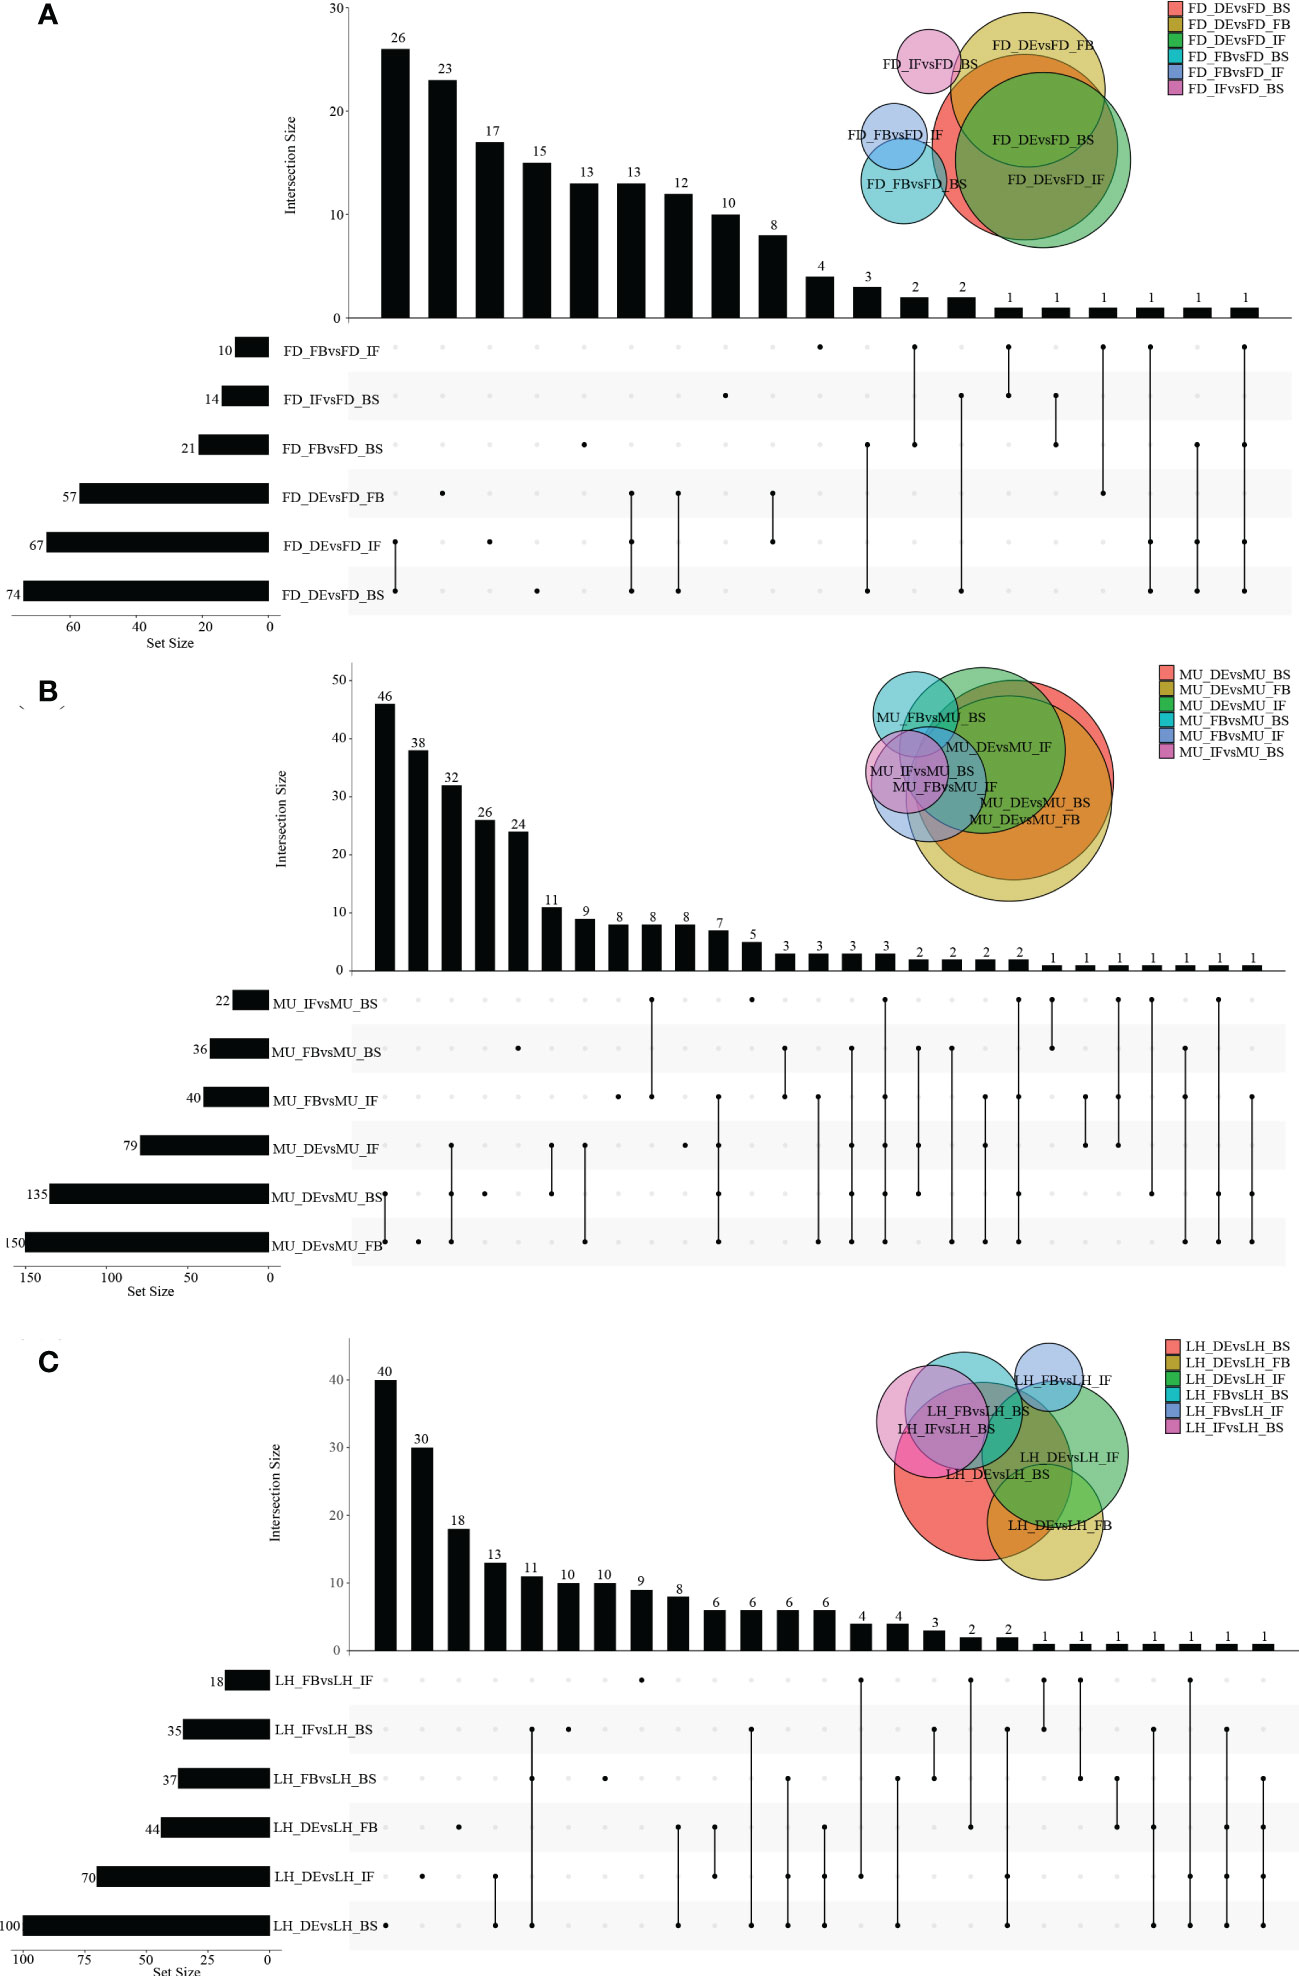
Figure 2 The distribution of DEMs across flower developmental stages in FD, MU, and LH. (A) The distribution of DEMs across developmental stages (BS, IF, FB, DE) in FD libraries. (B) The distribution of DEMs across developmental stages (BS, IF, FB, DE) in MU libraries. (C) The distribution of DEMs across developmental stages (BS, IF, FB, DE) in LH libraries.
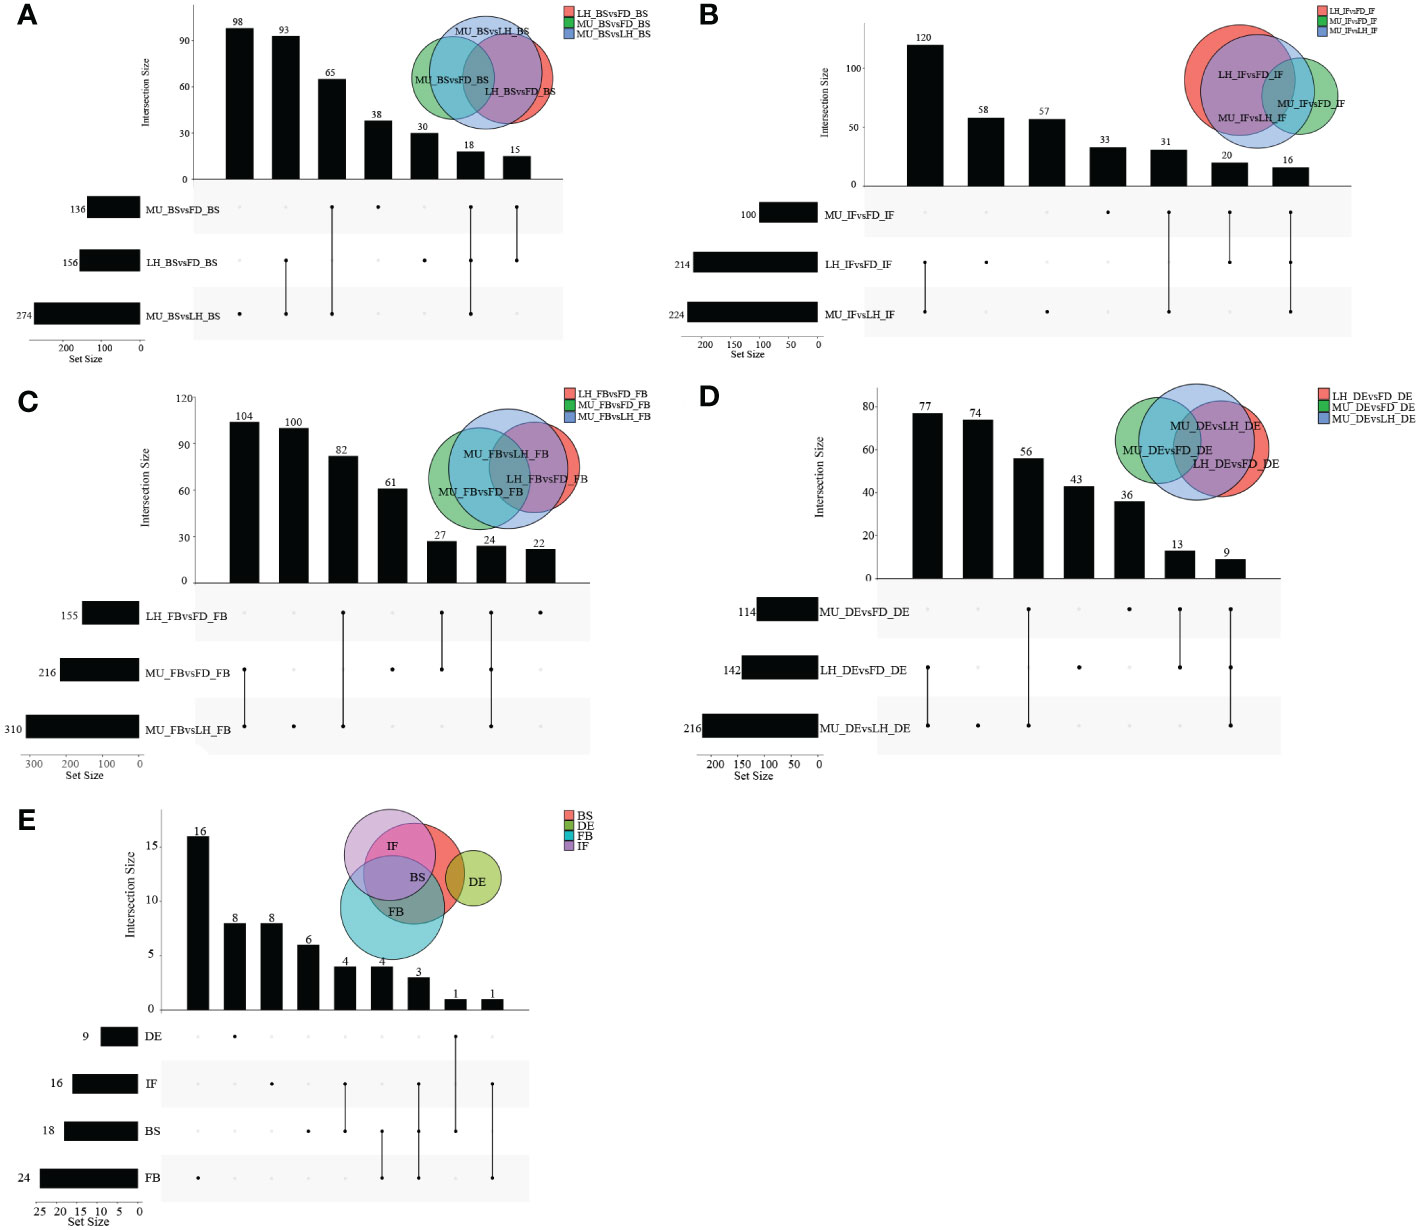
Figure 3 The distribution of DEMs across varieties at BS, IF, FB, and DE stages. (A) The distribution of DEMs across tree peony varieties (FD, MU and LH) at BS libraries. (B) The distribution of DEMs across tree peony varieties (FD, MU and LH) at IF libraries. (C) The distribution of DEMs across tree peony varieties (FD, MU and LH) at FB libraries. (D) The distribution of DEMs across tree peony varieties (FD, MU and LH) at DE libraries. (E) The distribution of intersection DEMs across tree peony varieties (FD, MU and LH) and across four flower developmental stages (BS, IF, FB, DE).
3.3 Transcriptome analysis
3.3.1 Expression genes revealed by transcriptome sequencing
Overview of raw reads, valid reads, Q30 and GC content data are shown in Table S6. Over 227 million valid reads, after filtering of 245 million raw reads, were obtained. In total, 500,378 contigs, 35,687 genes (G), 35,687 unique Transcripts (T) were identified separately. Of these, 29,271 GO annotated genes and 10,556 KEGG annotated genes were obtained separately. A total of 15,099, 14,906, and 14,544 intersecting annotated genes were detected across developmental stages (BS, IF, FB, and DE) in FD, MU, and LH varieties respectively (Figures S3A–C). A total of 14,672, 14,844, 14,841, and 14,779 intersecting annotated genes were detected across all varieties (FD, MU, and LH) at all developmental stages BS, IF, FB, and DE respectively (Figures S4A–D). Finally, a total of 13,203 intersecting annotated genes were detected across four developmental stages and three varieties (Figure S3D, Figure S4E).
3.3.2 Differentially expressed genes identified in floral florescence development stages
To identify differentially expressed genes (DEGs) with floral florescence patterns, gene expression was compared across developmental stages in each of the varieties (Figures 4A–C). Numbers of differentially expressed DEGs including up-regulated and down-regulated DEGs in different groups are shown in Figure S5. A total of 12, 36, and 69 genes showed significant differential expression among flower developmental stages (BS, IF, FB, DE) in FD, MU and LH varieties, respectively (Figure 4D). Interestingly, after determining the intersection of differentially expressed genes in the three varieties, we identified only one co-expressed DEG (psu.G.00014095), in varieties FD and LH, that was expressed across all four development stages, which indicates that expression of DEG psu.G.00014095 was dependent both on developmental stage and genotype. The function of this gene was annotated as xyloglucan endotransglycosylase/hydrolase precursor XTH-25, which may regulate the floral florescence, development and senescence of tree peony. In addition, genes differentially expressed DEGs at different developmental stages across all varieties were identified to discover genes that may regulate flowering (Figures 5A–D). In total, 437, 232, 446, and 343 co-expressed genes showed significant differential expression among stages BS, IF, FB, and DE, respectively, across varieties FD, MU and LH (Figure 5E). Examining intersections of the DEGs further revealed 16 DEGs that simultaneously expressed at the four developmental stages and in the three varieties (Figure 5E). Besides, 257, 104, 257, and 240 specific DEGs showed significant differential expression across in stages in FB, IF, FB, and DE, respectively, in all the three varieties (Figure 5E).
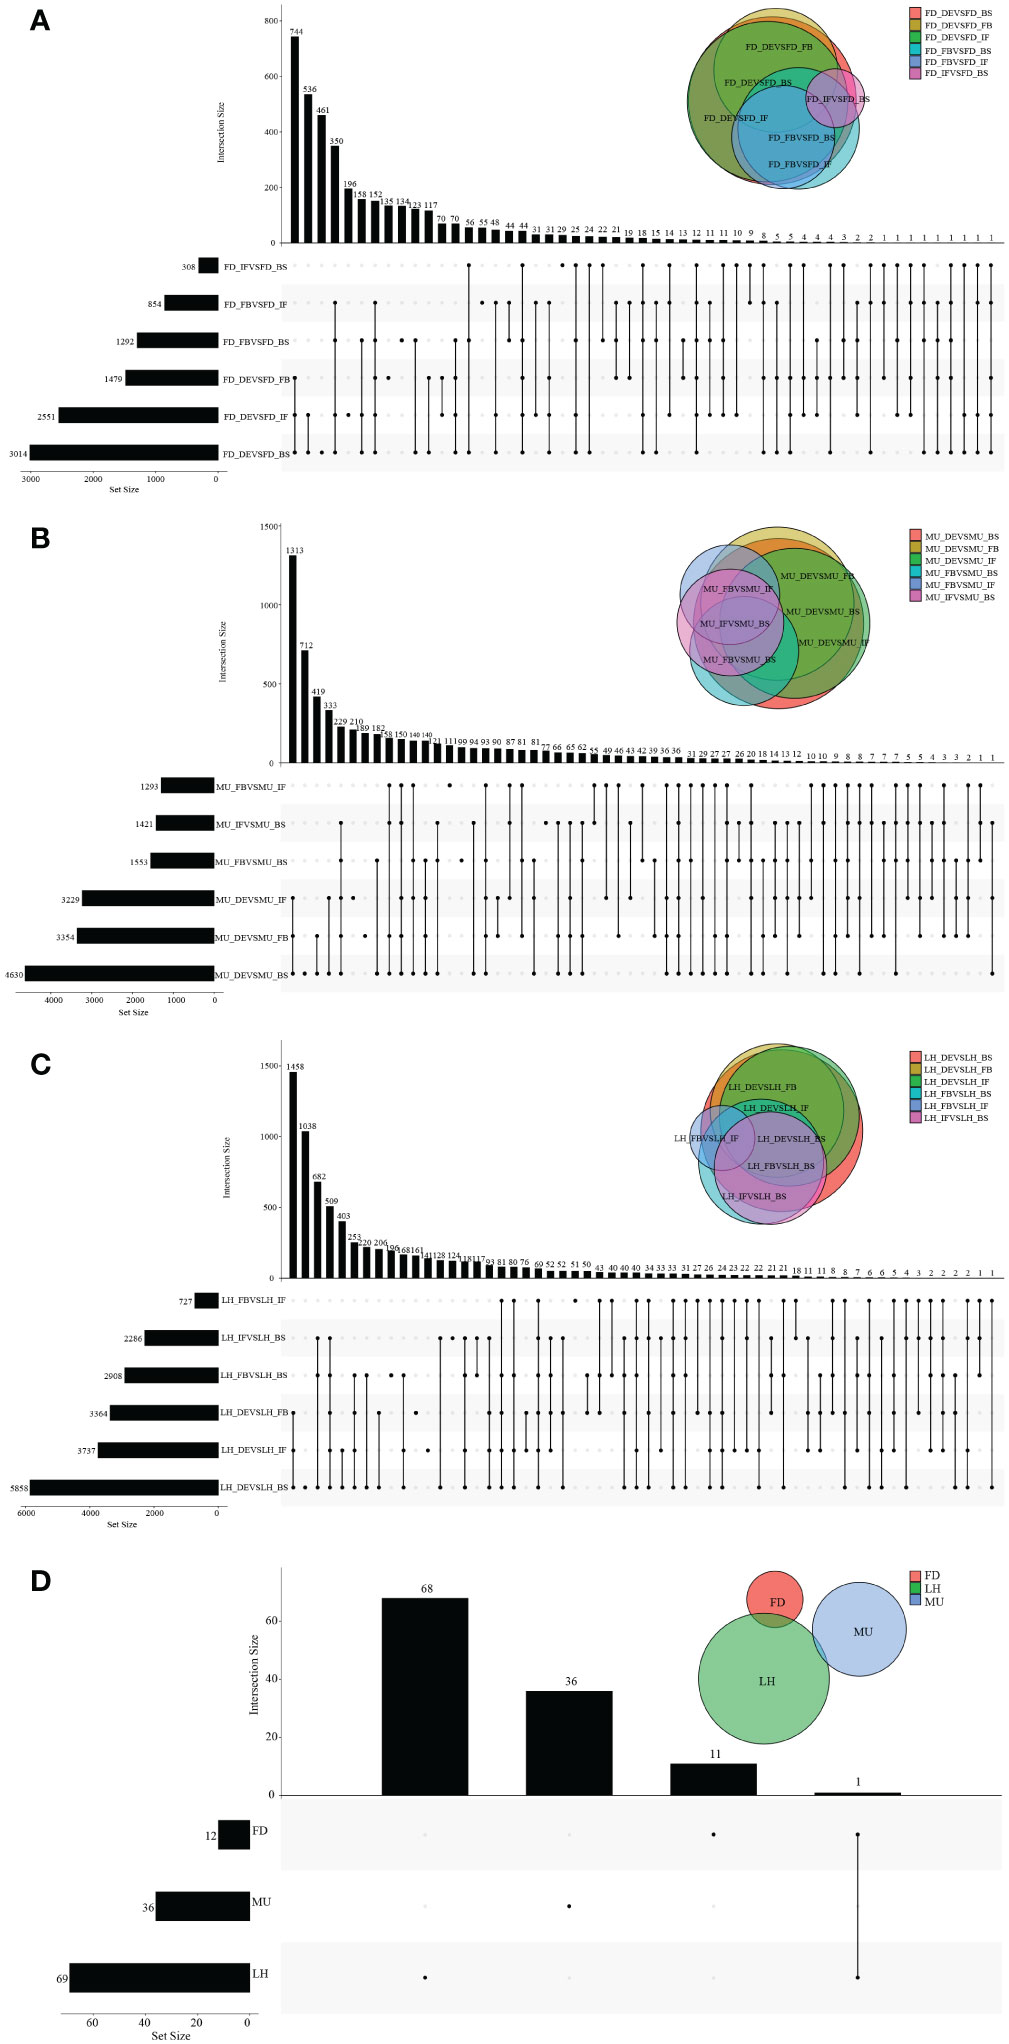
Figure 4 The distribution of DEGs across flower developmental stages in FD, MU, and LH. (A) The distribution of DEGs across flower developmental stages (BS, IF, FB, DE) in FD libraries. (B) The distribution of DEGs across flower developmental stages (BS, IF, FB, DE) in MU libraries. (C) The distribution of DEGs across flower developmental stages (BS, IF, FB, DE) in LH libraries. (D) The distribution of intersection DEGs across four flower developmental stages (BS, IF, FB, DE) and across the three tree peony varieties (LH, MU and LH).
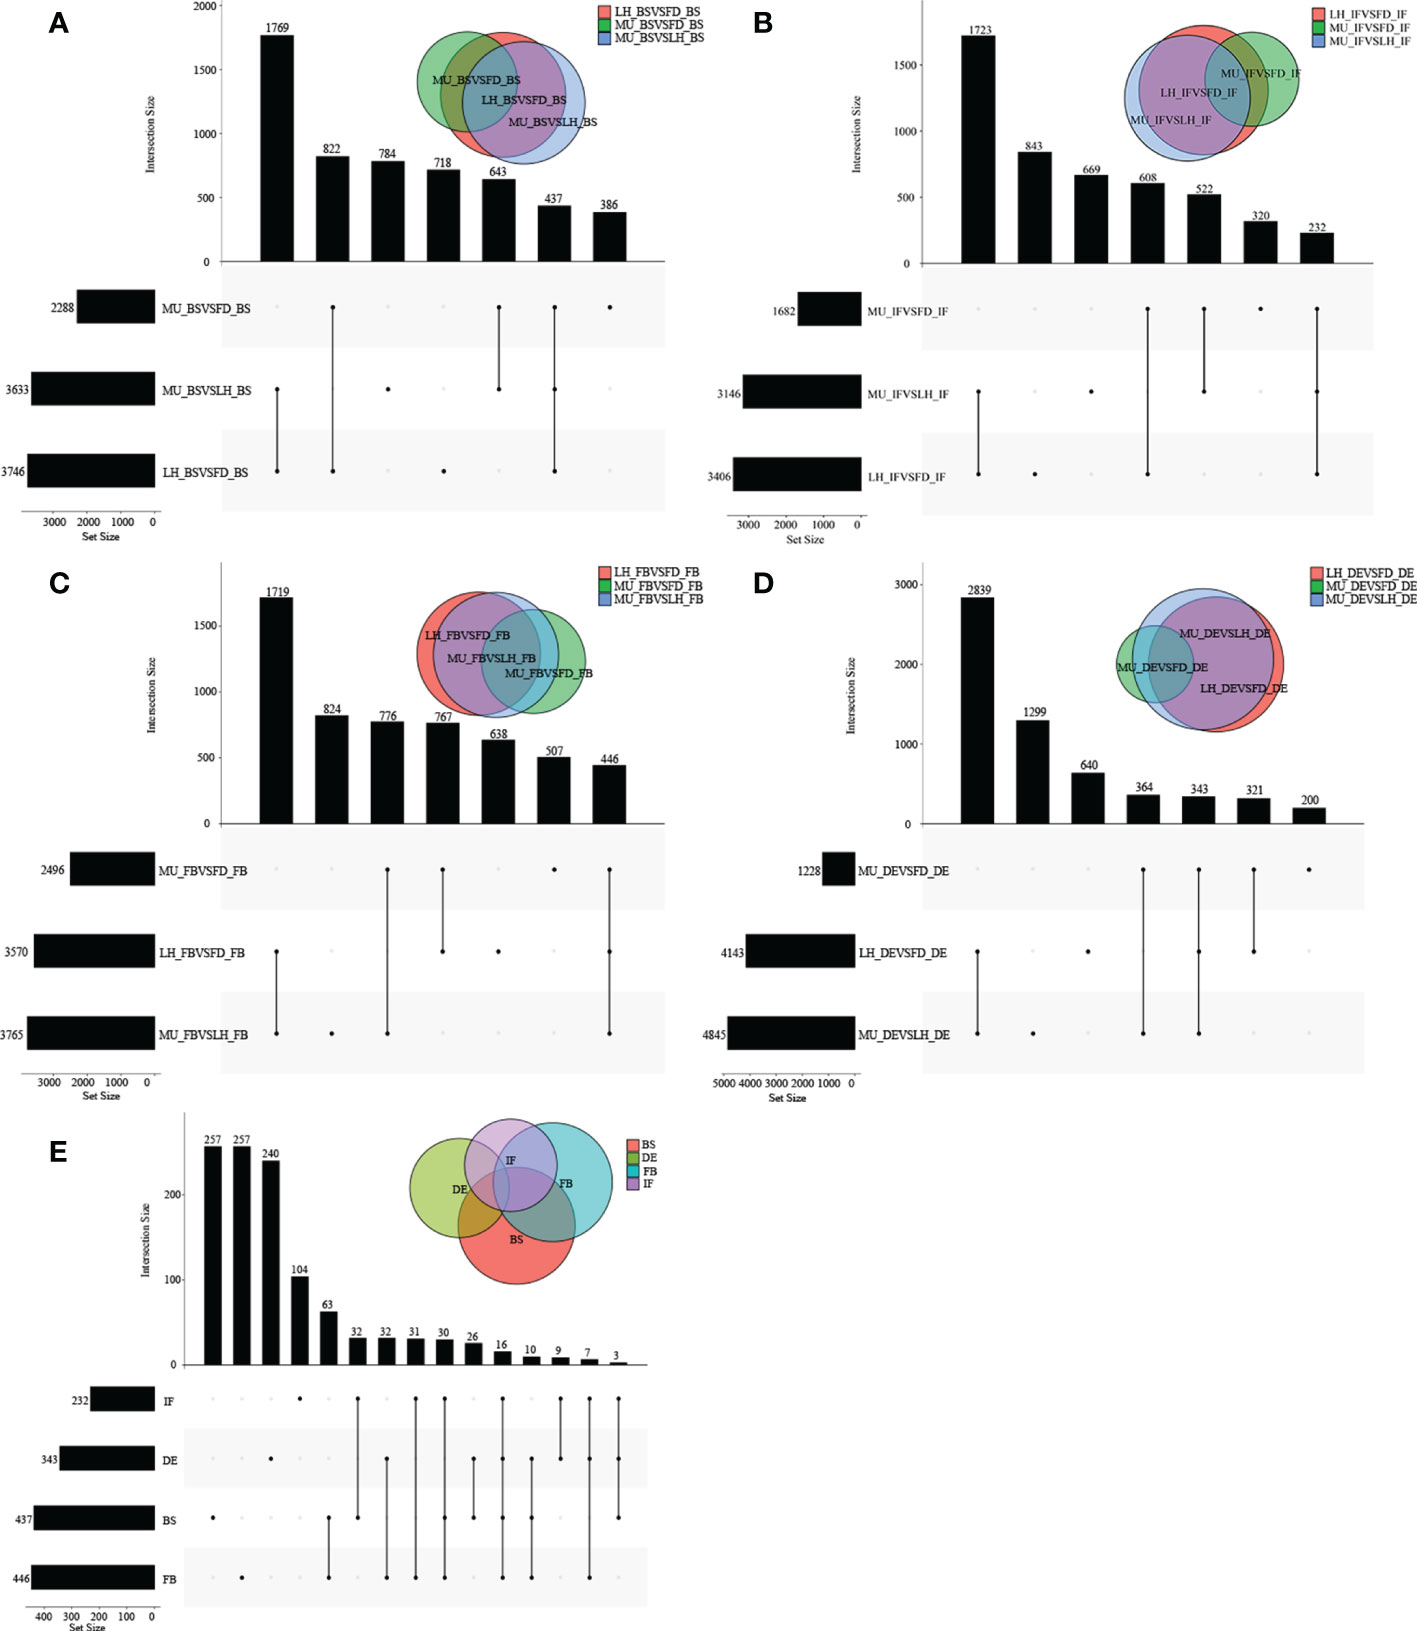
Figure 5 The distribution of DEGs across varieties at BS, IF, FB, and DE stages. (A) The distribution of DEGs across tree peony varieties (LH, MU and LH) at BS libraries. (B) The distribution of DEGs across tree peony varieties (LH, MU and LH) at IF libraries. (C) The distribution of DEGs across tree peony varieties (LH, MU and LH) at FB libraries. (D) The distribution of DEGs across tree peony varieties (LH, MU and LH) at DE libraries. (E) The distribution of intersection DEGs across the three tree peony varieties (LH, MU and LH) and across the four flower developmental stages (BS, IF, FB, DE).
3.3.3 Gene ontology and kyoto encyclopedia of genes and genomes analysis
Gene Ontology (GO) and Kyoto Encyclopedia of Genes and Genomes (KEGG) based functional enrichment analysis of DEGs were conducted to uncover the biological roles in governing floral florescence, development and abscission across early- and late-flowering genotypes in tree peony.
Some GO terms (chloroplast, chloroplast envelope, plasmodesma, and molecular function) for DEGs were common across both varieties and developmental stages, while some were specific to either the variety (e.g., defense response) or to developmental stages (flavonoid biosynthetic process, flavonoid glucuronidation, quercetin 7-o-glucosyltransferase activity, quercetin 3-o-glucosyltransferase activity, chloroplast stroma, kinase activity, response to cold, chloroplast thylakoid membrane, thylakoid, chloroplast thylakoid). It was worth noting that GO terms like abscisic acid-activated signaling pathway and protein serine/threonine kinase activity processes were significantly enriched across developmental stages in FD and MU which were early-flowering genotype, while biological process, plant type cell wall, vacuole, hydrolase activity, hydrolyzing o-glucosyl compounds, golgi apparatus, transferase activity, transferring glycosyl groups, fatty acid biosynthetic process, chloroplast inner membrane processes were only enriched across developmental stages in LH which was late-flowering genotype. The GO terms for response to abscisic acid, wounding, chitin, and protein phosphorylation were only enriched in MU, which was an early flowering mutant genotype of FD (Table 3).
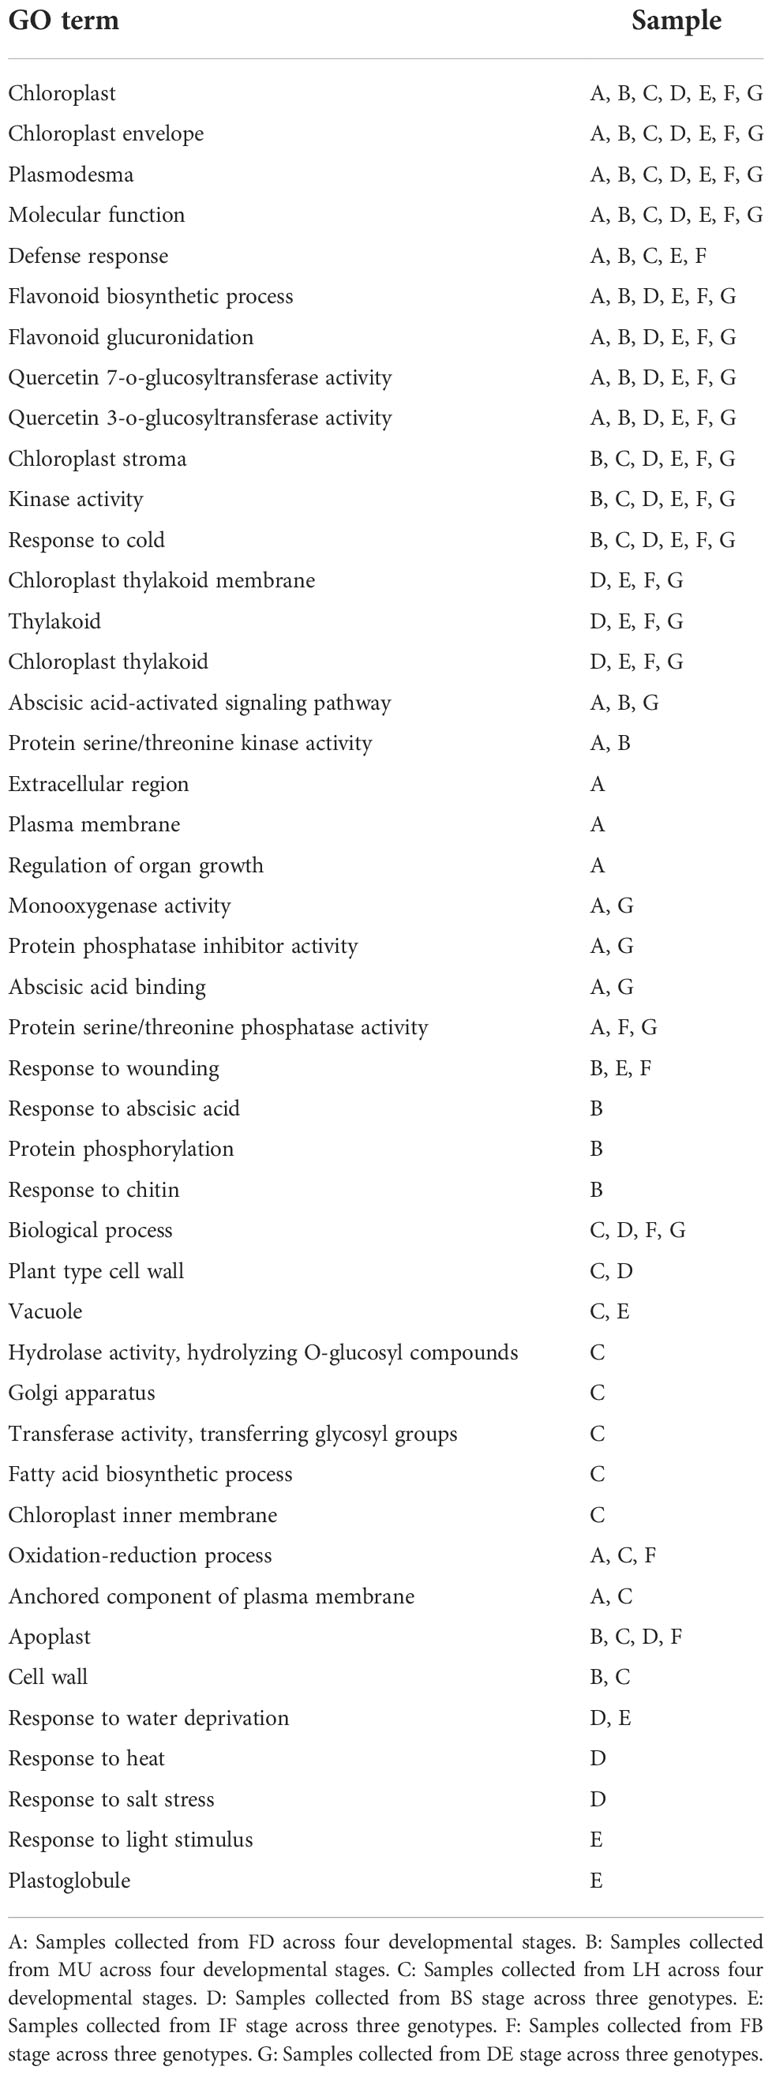
Table 3 GO enrichment analysis of DEGs across genotypes and developmental stages in tree peony.
KEGG enrichment analysis of DEGs revealed that plant hormone signal transduction, starch and sucrose metabolism, MAPK signaling pathway-plant, phenylpropanoid biosynthesis, and carotenoid biosynthesis pathway were common across developmental stages in both early- and late-flowering varieties, which suggests a possible role in the floral florescence, development and abscission in tree peony. Here, it was interesting that KEGG pathways like cyanoamino acid metabolism, galactose metabolism, other glycan degradation, fatty acid elongation, and amino sugar and nucleotide sugar metabolism were specific to varieties, while some other pathways were specific to developmental stages (for example, porphyrin and chlorophyll metabolism and fructose and mannose metabolism). Thus, these KEGG pathways might possibly have roles in variety-specific or developmental stage-specific responses. It is worth mentioning that pathways for stilbenoid, diarylheptanoid and gingerol biosynthesis, glycosphingolipid biosynthesis-ganglio series, arachidonic acid metabolism, terpenoid backbone biosynthesis, and zeatin biosynthesis were common to the early-flowering varieties FD and MU, while fructose and mannose metabolism, sphingolipid metabolism, fatty acid biosynthesis, inositol phosphate metabolism, pyruvate metabolism, phosphatidylinositol signaling system were specific to the late-flowering genotype LH, which may contribute to the late-flowering phenotype (Table 4).
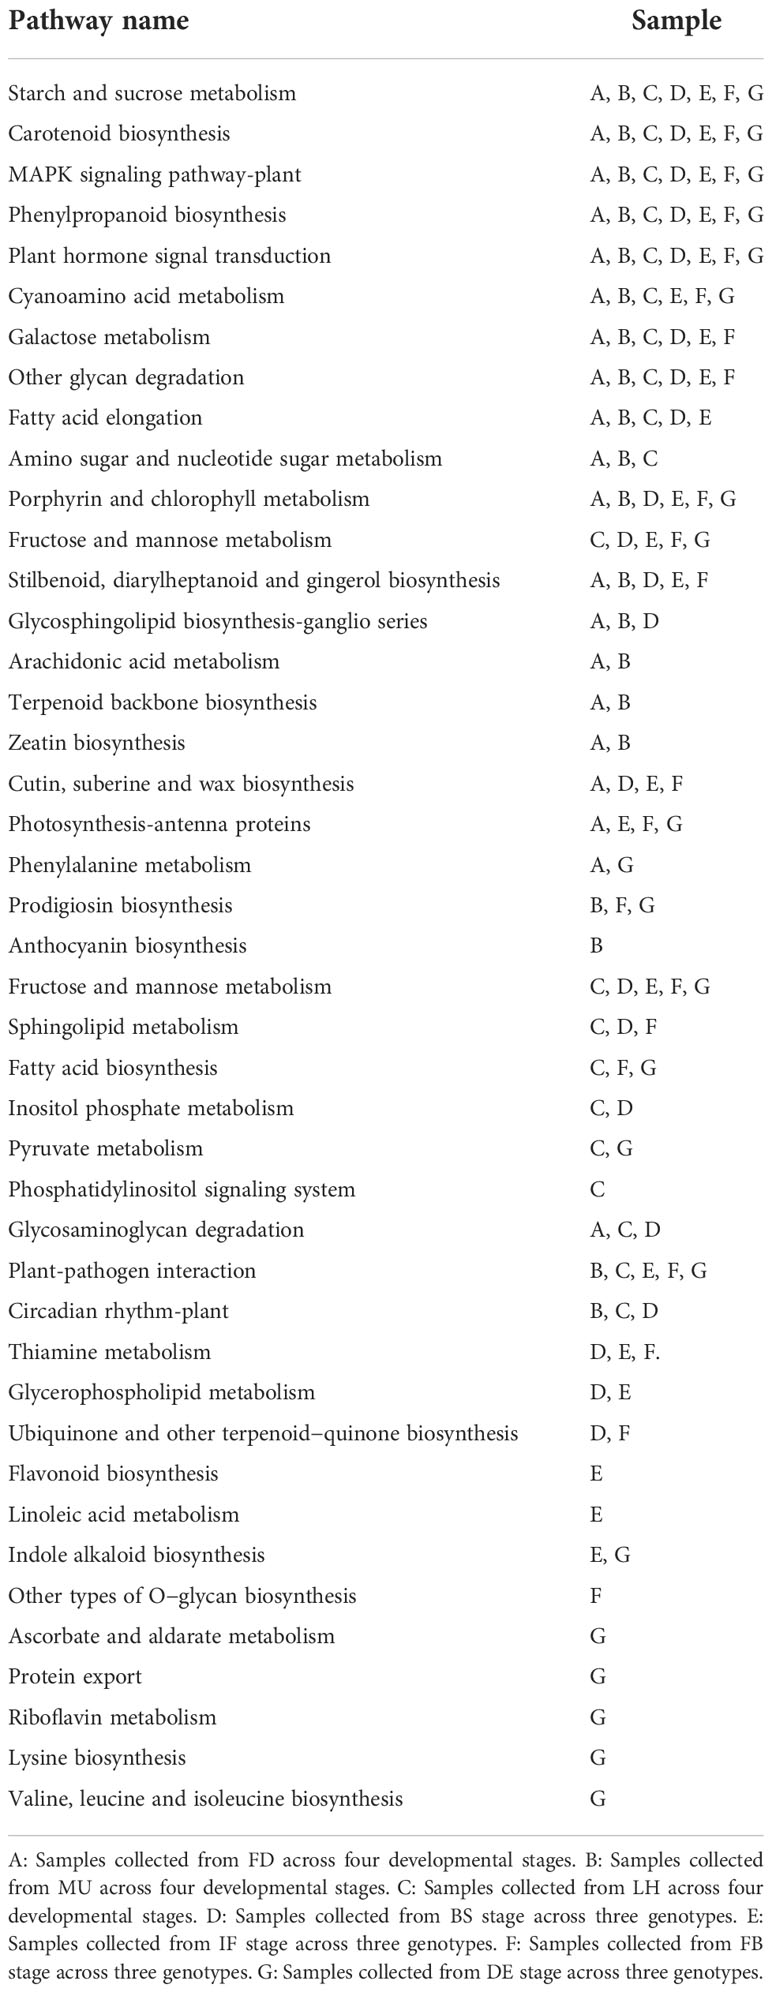
Table 4 KEGG enrichment analysis of DEGs across genotypes and developmental stages in tree peony.
3.3.4 Identification of DEGs encoding transcription factors
Transcription factors (TFs), a kind of DNA-binding proteins which play important roles in transcription, perform a number of function in flowering (Kumar et al., 2012; Shibuya et al., 2015). In total, 116 differentially expressed TFs, belonging to 26 TF families including bHLH, C2H2, ERF, B3, MYB-related, NAC, HD-ZIP, bZIP, GRAS, HSF, MYB, Trihelix, etc., were identified across the four flower developmental stages in the tree peony varieties. Among the above identified TFs, the bHLH family, C2H2 family and ERF family accounted for the largest proportion, the following are B3 family, MYB-related family protein and NAC family (Table S7).
In addition, 1,117 differentially expressed TFs belonging to 53 TF families, covering bHLH, ERF, NAC, C2H2, B3, MYB-related, Trihelix, MYB, FAR1, GRAS, C3H, and WRKY, etc., were identified across the three varieties at BS, IF, FB, and DE stages. Among these TFs, the bHLH family accounted for the largest proportion, followed by ERF, NAC, C2H2, B3, and MYB-related family (Table S8). It was worth mention that bHLH family, C2H2 family, ERF family, B3 family, MYB-related family, and NAC family showed high dominance both across genotype and across developmental stages, which demonstrated that these TFs might play crucial functions in regulating floral florescence, development and senescence in tree peony.
3.4 Degradome sequencing revealed miRNA-regulated mRNAs
Degradome, used for miRNA and siRNA targets characterization by the 5’-ends of uncapped RNAs (German et al., 2008; Gregory et al., 2008). Petals of the four flower developmental stages (BS, IF, FB and DE) for each genotype (FD, MU and LH) were pooled prior the degradome libraries construction (FD, LH, and MU) and used for degradome analysis. Around 10.9 million raw reads were gained from the degradome libraries. Detailed information of total raw reads, unique raw reads, mappable reads, unique mappable reads, mapped reads, unique mapped reads, number of input transcripts, and number of target transcripts are shown in Table S9. A total of 7,571, 9,250 and 6,457 mRNAs were silenced by miRNAs in FD, MU and LH respectively. The alignment information of miRNAs-mRNA pairs can be found in Table S10. In total, 11,391 targets showed a differential degradation pattern between FD and LH. In addition, 11,928 targets presented a differential degradation characteristic between MU and FD. Moreover 11,605 targets demonstrated a differential degradation characteristic between MU and LH.
3.5 Integrated analysis of floral florescence, development, and senescence dependent miRNA-mRNA modules
DEGs identified across flower developmental stages (BS, IF, FB, DE) in FD, MU and LH were assembled into a unified set. DEGs identified across varieties (FD, MU, LH) at developmental stages BS, IF, FB and DE were then assembled into another unified set. DEGs from the union sets were then used together for further miRNA-mRNA target pairing confirmation by multi-omics analysis. Subsequently, miRNA-mRNA pairs with opposite regulatory patterns were characterized in terms of the gene-silencing function of miRNAs. With this method, miRNA-mRNA pairs associated with floral florescence, development and senescence were identified.
In total, 32 miRNA targets showed antagonistic regulatory patterns during developmental stages in FD, MU and LH, which might thus be candidates for regulating the floral development and senescence of tree peony (Table S11). Another 191 miRNA targets were differentially expressed across tree peony varieties and developmental stages, which suggests important roles for those in floral florescence regulation (i.e., the timing of flower opening and senescence) (Table S11). Of these, ten miRNA targets showed significantly different expression patterns both across development and across varieties, which suggests possible dual roles in floral florescence regulation in tree peony. Expression patterns of these floral florescence, development and senescence dependent miRNA targets are presented in Figures 6A–E. GO (Figure 7A) and KEGG (Figure 7B) pathway analysis revealed that these floral florescence-, development- and senescence-dependent miRNA targets were enriched in pathways like plant hormone signal transduction, indole alkaloid biosynthesis, arachidonic acid metabolism, folate biosynthesis, fatty acid elongation, MAPK signaling pathway, etc.
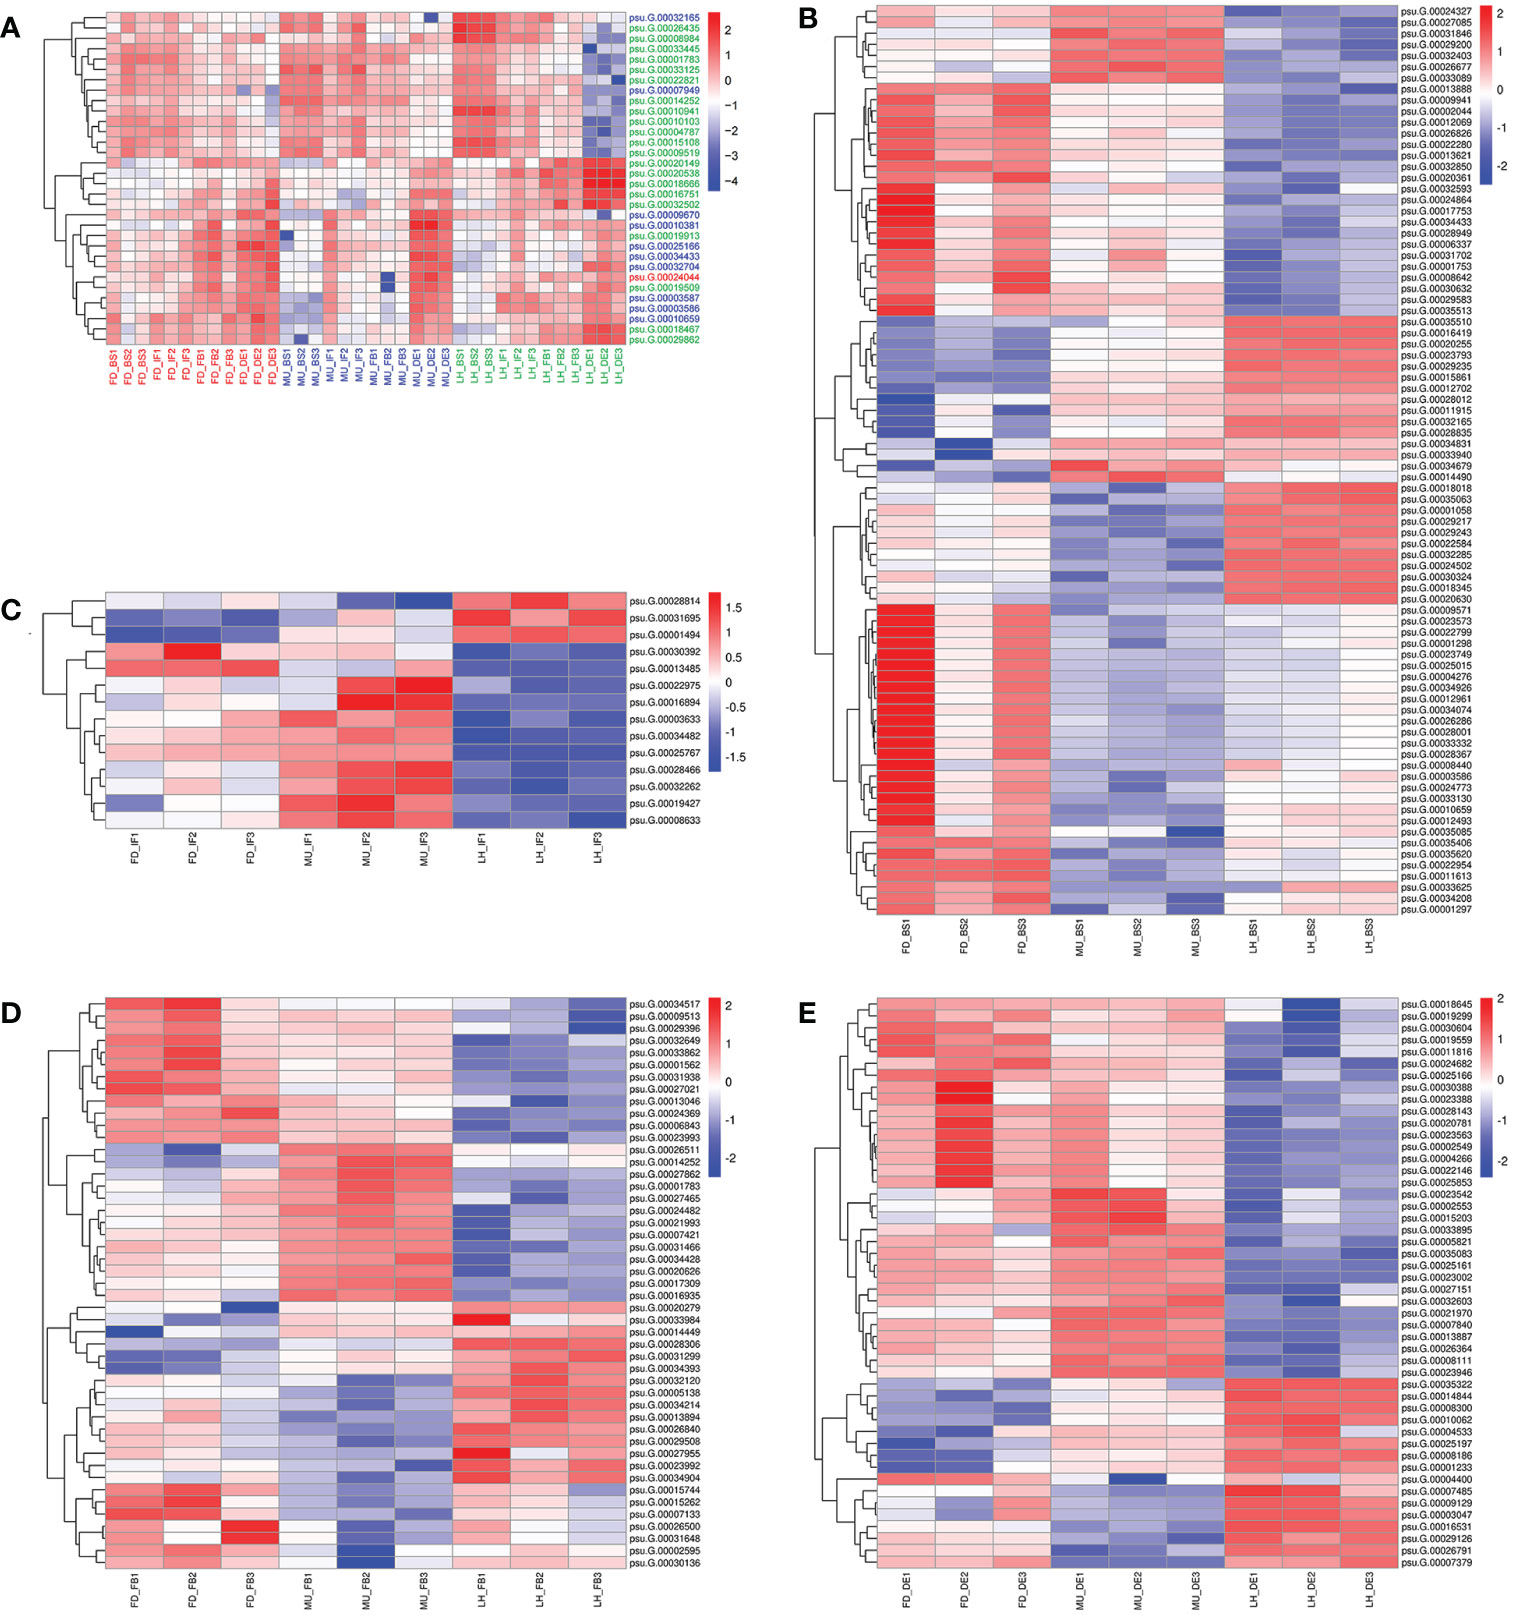
Figure 6 Expression pattern of miRNA targets specific to flower developmental stages and varieties by miRNAome, transcriptome and degradome integrated analysis of tree peony. (A) Expression pattern of miRNA targets identified across flower developmental stages in FD, MU, and LH. (B) Expression pattern of miRNA targets identified across tree peony varieties at flower developmental stage BS. (C) Expression pattern of miRNA targets identified across tree peony varieties at flower developmental stage IF. (D) Expression pattern of miRNA targets identified across tree peony varieties at flower developmental stage FB. (E) Expression pattern of miRNA targets identified across tree peony varieties at flower developmental stage DE.
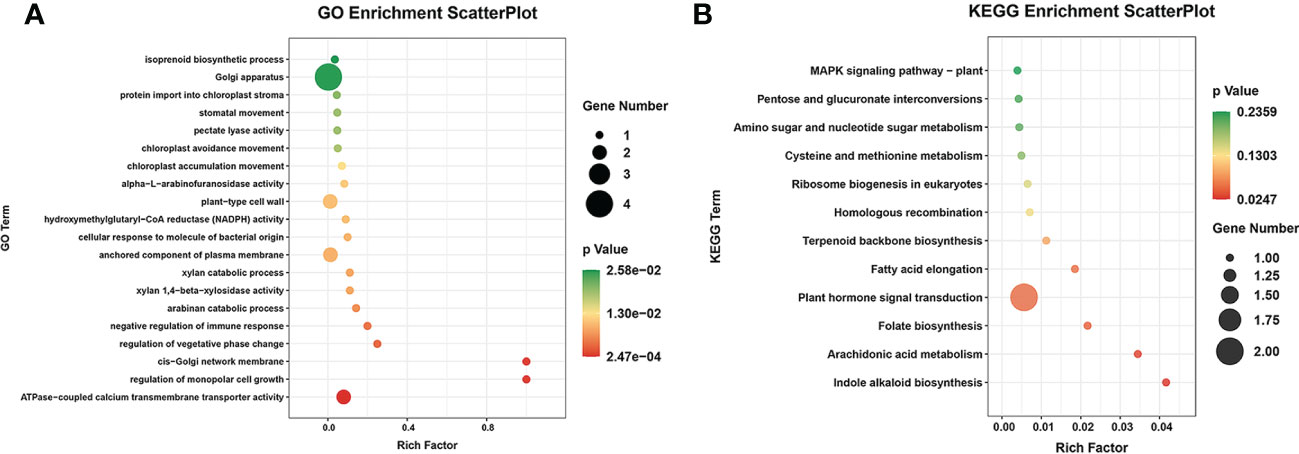
Figure 7 GO and KEGG analysis of miRNA targets specific to flower developmental stages and varieties by miRNAome, transcriptome and degradome integrated analysis of tree peony. (A) GO analysis of target genes identified by integrated analysis of miRNAome, transcriptome and degradome. (B) KEGG pathway analysis of target genes identified by integrated analysis of miRNAome, transcriptome and degradome.
The miRNA-guided floral florescence, development and senescence regulatory networks were complicated, which imply that one specific miRNA might be able to adjust and control many mRNAs, and one specific mRNA also might be targeted by divers miRNAs simultaneously (Liu et al., 2020a). Multiple-to-multiple inter-associations between miRNAs and their target genes which enriched in KEGG pathways and encode TFs were constructed by Cytoscape (Figure 8). The multiple-to-multiple miRNA-mRNA-TF modules were enriched in pyruvate metabolism, carbon fixation in photosynthetic organisms, pentose and glucuronate interconversions, sesquiterpenoid and triterpenoid biosynthesis, aminoacyl-tRNA biosynthesis (Figure 8A). The result also displayed that the miRNA-mRNA-TF modules mainly consisted of MYB-related, bHLH, Trihelix, NAC, GRAS and HD-ZIP TF families, demonstrating their potential functions in tree peony floral florescence, development and senescence (Figure 8B).
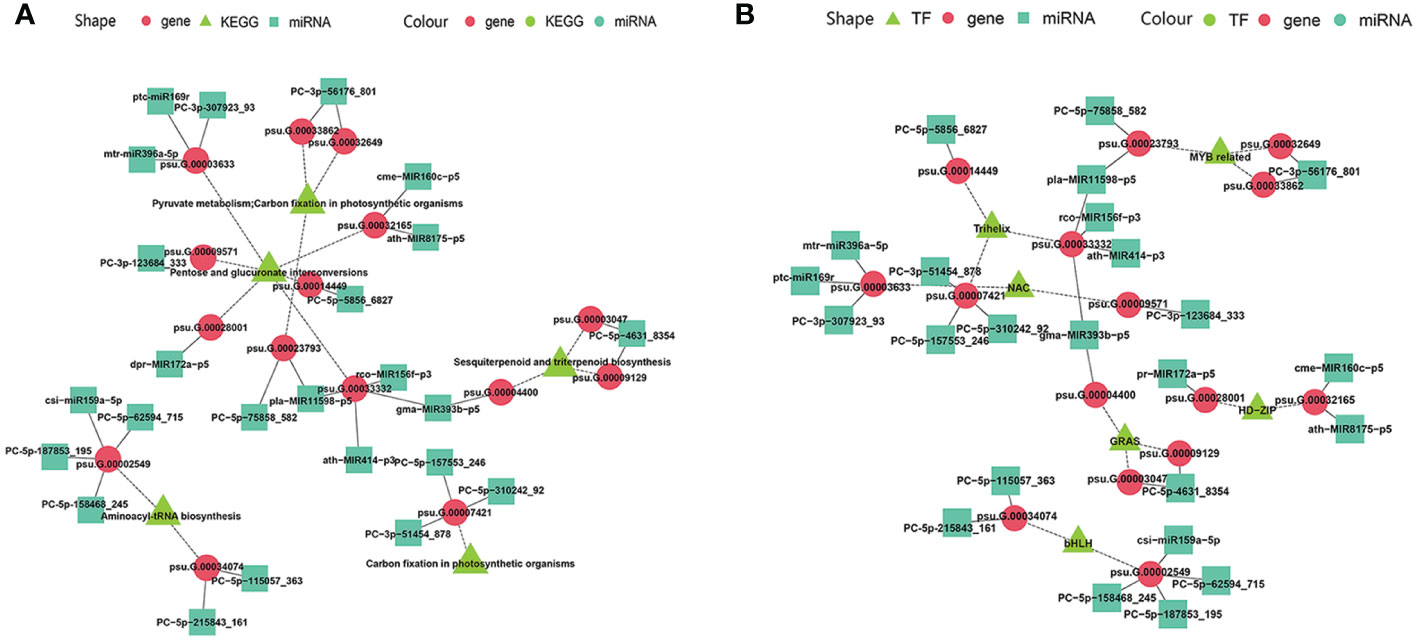
Figure 8 MiRNA-mRNA-TF modules regulatory network identified by miRNAome, transcriptome and degradome integrated analysis across flower developmental stages and varieties of tree peony (A) Regulatory network mediated by miRNA-mRNA-TF modules identified across flower developmental stages in FD, MU, and LH. (B) Regulating network mediated by miRNA-mRNA-TF modules identified across tree peony varieties at flower developmental stages BS, IF, FB, DE.
3.6 Weighted gene co-expression network analysis reveals candidate hub genes
In order to uncover the regulation mechanism of flowering time based on transcriptome data across varieties and flower development stages, weighted gene co-expression network analysis (WGCNA) was performed to detect co-expressed genes to disclose the hub gene which might regulate floral florescence, development and senescence. WGCNA analysis resulted in 43 distinct co-expressed gene modules were exhibited by distinctive colors and shown by a heatmap (Figure 9A). Each heatmap represented an expression cluster, which straightly elucidated the relationship between the clusters of three tree peony varieties and four development stages (Figure 9B). Then, correlation analysis was performed between modules and samples to find modules with the highest correlation. The candidate hub genes were confirmed by taking the intersection of gene in modules with the highest correlation and the genes used for integrated analysis of miRNA-mRNA-TF. Furthermore, the intersected genes were selected for the hub genes network construction (Figures 9C, D). Finally, hub genes psu.G.00014449, psu.G.00003047 and psu.G.00009129 in LH, psu.G.00032165 and psu.G.00007421 in MU may play crucial roles in the floral florescence, development and senescence in tree peony. Regrettably, none intersected hub genes were detected in FD since the lower gene connectivity.
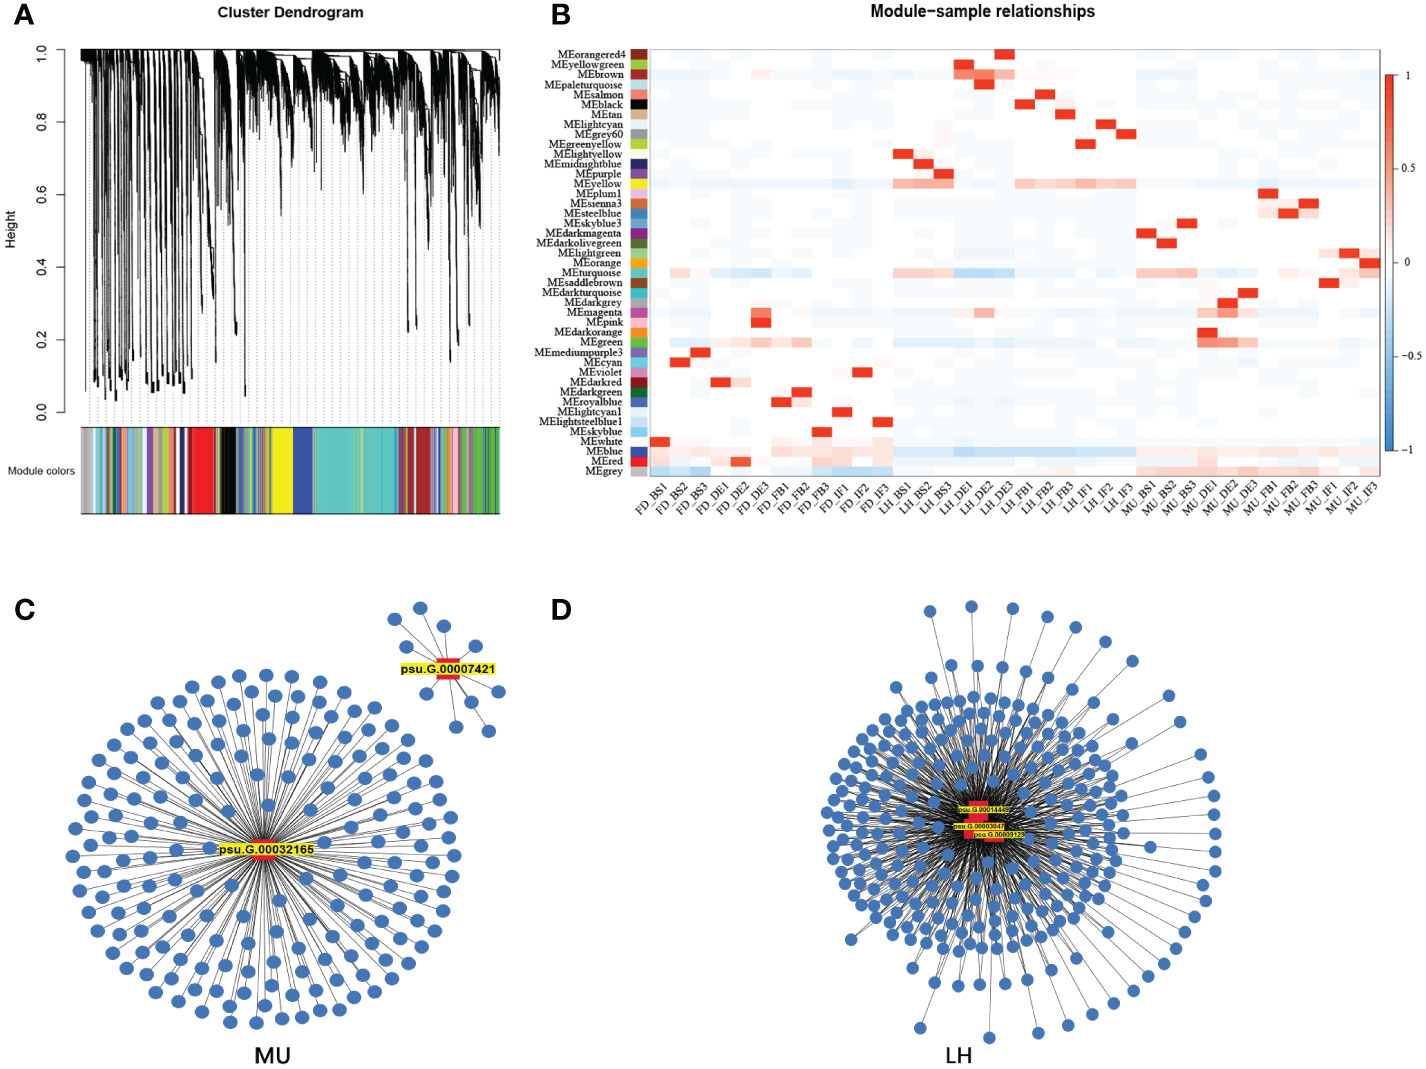
Figure 9 WGCNA analysis of differentially expressed genes regulating floral florescence, development and senescence. (A) Hierarchical cluster tree showing co-expression modules. (B) Module-samples relationships. (C) Hub gene regulating floral florescence, development and senescence in LH. (D) Hub gene regulating floral florescence, development and senescence in MU.
3.7 qRT-PCR analysis for the DEMs and DEGs verification
A total of eight DEM and DEG pairs were selected for the qRT-PCR analysis to verify the expression pattern of miRNA and mRNA data obtained from miRNAome, transcriptome, and degradome (Figure 10). The selected miRNA-target pairs were presented as follows: seu-MIR11025-p5 and psu.T.00024044, miR166-5p and psu.T.00024044, PC-5p-564_43386 and psu.T.00034433, mtr-miR396b-5p and psu.T.00010381, PC-3p-602268_25_S and psu.T.00020538, PC-5p-429002_51_S and psu.T.00018467, mtr-MIR2592bj-p3 and psu.T.00015108, PC-5p-143784_277_S and psu.T.00016751. Target t-plots (Figure S6) show the cleavage sites of target genes silenced by miRNAs during developmental stages. In general, the expression levels of DEM-target pairs were consistent with miRNA-guided mRNA cleavage signatures validated by degradome.
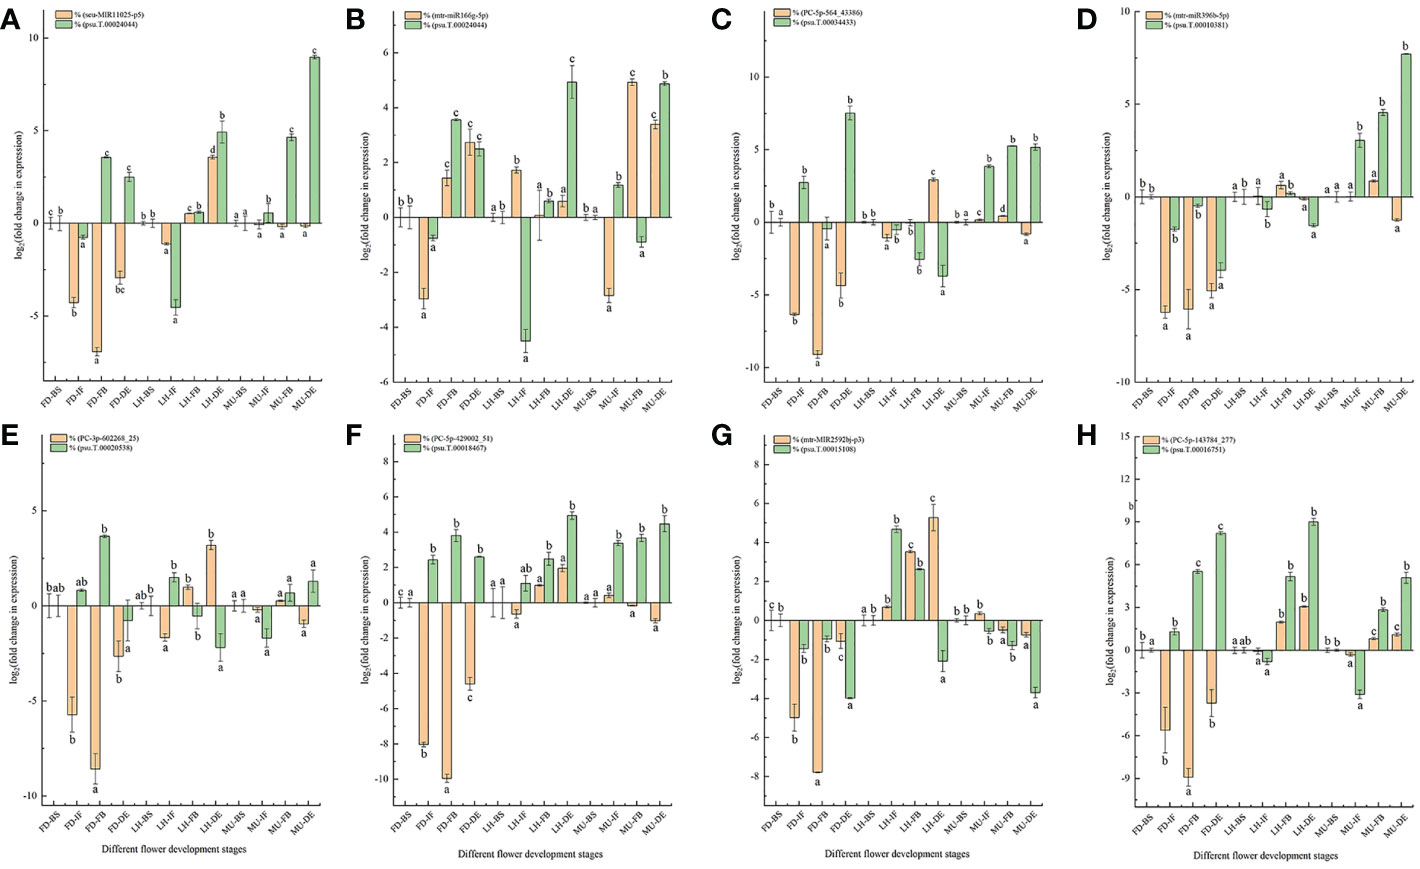
Figure 10 qRT-PCR analysis of miRNA-mRNA pairs. (A) qRT-PCR analysis of MIR11025-p5 and psu.T.00024044. (B) qRT-PCR analysis of miR166-5p and psu.T.00024044. (C) qRT-PCR analysis of PC-5p-564_43386 and psu.T.00034433. (D) qRT-PCR analysis of mtr-miR396b-5p and psu.T.00010381. (E) qRT-PCR analysis of PC-3p-602268_25 and psu.T.00020538. (F) qRT-PCR analysis of PC-5p-429002_51 and psu.T.00018467. (G) qRT-PCR analysis of mtr-MIR2592bj-p3 and psu.T.00015108. (H) qRT-PCR analysis of PC-5p-143784_277 and psu.T.00016751. MU, Mutant of Paeonia ostii ‘Fengdan’; FD, Paeonia ostii ‘Fengdan’; LH, Paeonia suffruticosa ‘Lianhe’; BS, Blooming Stage; IF, Initial Flowering Stage; FB, Full Blooming Stage; DE, Decay Stage.
As expected, majority of the expression patterns of the examined miRNA-target pairs were similar to the RNA-seq data, with the exception of transcripts psu.T.00010381, psu.T.00016751 and mtr-miR396b-5p, confirming the accuracy and reliability of the sequencing data in general (Figure 10). Our study confirmed an exactly negative correlation for miRNAs and target genes PC-3p-602268_25 and psu.T.00020538 expressed at the four developmental stages in FD and LH, target genes PC-5p-429002_51 and psu.T.00018467 at all four developmental stages in FD, and target genes mtr-miR166g-5p and psu.T.00024044 at the four developmental stages in MU. While the remaining tested miRNA-target pairs did not always show a negative relationship across the four developmental stages, this is consistent with previous research (Liu et al., 2017; Zuluaga et al., 2017).
Previous research revealed that miRNA and their target genes were not always presented a specific one-to-one regulatory relationship, which is due to that a specific miRNA can regulate several target mRNAs simultaneously and a specific mRNA also could be targeted by multiple miRNAs (Liu et al., 2020a; Liu et al., 2020b). Thus, the expression pattern of miRNA and their target genes does not emerge a negative correlation all the time (Liu et al., 2017; Zuluaga et al., 2017; Zuluaga et al., 2018). Our study showed that psu.T.00024044 could be targeted by mtr-miR166g-5p and seu-MIR11025-p5_2ss4CA17CA simultaneously which was consistent with data elucidated previously. Furthermore, changes in expression levels of miRNA and mRNA could have derived from the differences arising from the biological replicates (Pradervand et al., 2009; Xu et al., 2018; Zuluaga et al., 2018; Liu et al., 2020b). Correlation analysis of miRNA-target pairs expression profiles between sequencing and qRT-PCR are shown in Figure S7.
4 Discussion
Florescence plays a crucial role in ornamental value of tree peony. However, current understanding of the regulatory mechanism underlying florescence in tree peony is still far beyond understanding. Here, we reported the combined analysis of the miRNAome, transcriptome and degradome to reveal the potential regulatory mechanism of florescence, using petals from four developmental stages in three tree peony varieties-FD (an early-flowering variety), LH (a late-flowering variety), and MU (a natural mutant line of FD) that flowers 2-3 days earlier than FD. Previous research on tree peony miRNA discovery sampled bud (Zhang et al., 2018; Han et al., 2020) or root, stem and leaf (Jin et al., 2015) tissues of FD, as well as seeds of high and low-ALA-content varieties Paeonia rokii ‘Sai gui fei’ and ‘Jing shen huan fa’ (Hao et al., 2017). This is also the first report of miRNA-target identification in varieties with contrasting flowering time phenotypic trait. Knowledge obtained on the miRNA-mRNA modules in tree peony varieties will provide crucial preliminary data for the further researches on floral florescence, development and abscission in tree peony.
4.1 Pathways associated with floral florescence, development, and senescence
Floral-associated pathways usually involved the vernalization, autonomous, ambient temperature, photoperiod, gibberellic acid, aging and sugar pathways (Han et al., 2021). Genes involved flowering-time regulation in tree peony (Wang et al., 2019) that were identified including genes involved in floral organ and meristem, vernalization pathway, age pathway, GA pathway, autonomous pathway, photoperiod pathway. High intensity light promotes flowering through the photoperiod pathway which requires the cooperation of chloroplast retrograde signals and silencing transcription of Flowering Locus C (FLC). To response high light induction, transcription factor PTM localized at chloroplast envelope suppresses FLC transcription. It is also known that an intracellular signaling pathway originated from chloroplasts regulates the flowering transition (Feng et al., 2016; Susila et al., 2016). Furthermore, it was discovered that the expression of chloroplast protein CEBP changed during flower development and senescence (Iordachescu et al., 2009). Our results showing that chloroplast and chloroplast envelope genes were expressed in common among both varieties and developmental stages assayed, suggests important roles in floral florescence, development and senescence in tree peony. We also observed a general role for the interaction of turgor pressure and plasmodesmata affecting floral development, perhaps through regulation of plasmodesmata aperture, for which an association with transition to flowering was previously shown (Hernández-Hernández et al., 2019).
4.2 Plant hormone signal transduction contributing to floral florescence, development, and senescence
Cell division, expansion, differentiation and stress response in organisms were proved to be regulated by hormones in the earlier report (Artur, 2022). ABA signaling presents multiple connections with the photoperiodic pathway (Martignago et al., 2020). Exogenous spraying of ABA result in changes of flowering time, indicating that ABA possibly is an internal factor regulating the floral transition (Conti et al., 2014). GIGANTEA (GI) is a key flowering gene required for photoperiod perception (Mishra and Panigrahi, 2015). ABA signaling integration through GI operates via up-regulation of FT (Riboni et al., 2016). Overexpression of the chrysanthemum R2R3-MYB delays flowering in Arabidopsis (Shan et al., 2012). ABA hypersensitive 1 suppresses frigida-mediated delayed flowering in Arabidopsis (Bezerra et al., 2004). FD and FD-like bZIPs protein complexes play a significant role in modulating ABA signaling (Martignago et al., 2020). ABA activates an intricate regulatory network of signals including TFs that have contrary effects on florescence (Conti et al., 2014). While the role of ABA in flowering in model plants is emerging, the ABA molecular control of flowering still poorly revealed in tree peony. This research found that many of the most highly differentially expressed genes were relevant to plant hormone signal transduction especially ABA. These results might provide a potential basis for further research on mechanisms parsing of ABA regulating floral florescence, development and senescence in tree peony.
4.3 miRNA-mRNA-TF regulate floral florescence, development, and senescence
MiRNAs have been proved to be of great importance in regulation of gene expression, defense responses, and cell function in plants (Achkar et al., 2016; Choudhary et al., 2021). Recent research have shown that miRNAs play crucial roles in regulating gene expression associated with flowering (Spanudakis and Jackson, 2014). According to the latest report, miR156 and miR172 possibly participate in flowering via an aging pathway (Waheed and Zeng, 2020). MiR167 was reported to be involved in governing floral/fiber-associated agronomic traits in cotton (Arora and Chaudhary, 2021). Inhibition of miR168 in rice could improve yield, prolong flowering and enhance immunity (Wang et al., 2021). While overexpression of miR159 resulted in late flowering, whereas suppression of miR159 leaded to the acceleration of flowering in the ornamental flowering plant gloxinia (Li et al., 2013; Millar et al., 2019).
Researches have demonstrated that TFs play vital roles in floral transition as miRNA targets. MiRNAs and their TF targets regulate gene expression at post-transcriptional level and transcriptional level respectively (Waheed and Zeng, 2020). Previously, the miRNA-mRNA-TF modules like pos-miR319a-3p.2–3p/TCP2, pos-miR159/GAMYB, pos-miR169/nuclear transcription factor Y subunit A, and pos-miR828/WER were identified in variety FD (Han et al., 2020). TF target genes (AP2 and SPL) might have splice sites for PsmiR172a and PsmiR156a, suggesting that miR156 and miR172 probably play important roles during dormancy transition in FD (Zhang et al., 2018). Additionally, studies have revealed that miR156-SPL (Xie et al., 2020; Rao et al., 2021), miR172-AP2 (Ó’Maoiléidigh et al., 2021), miR319-TCP (Zhu et al., 2021), miR159-MYB (Spanudakis and Jackson, 2014) and miR399-PHO2 (Kim et al., 2011) play important roles in floral transition.
Transcription factors MYC2, MYC3, and MYC4 in bHLH family were involved in jasmonate-mediated flowering inhibition in Arabidopsis (Wang et al., 2017). Previous studies showed that the bZIP transcription factors were functionally required for flower development (Strathmann et al., 2001). The TBZF gene encoding bZIP were reported to be abundant in senescing flower buds (Yang et al., 2002). The C2H2 zinc finger family perform functions in pollen development regulation in grapevine (Arrey-Salas et al., 2021). Overexpression of the CcNAC1 gene promotes early flowering in jute (Zhang et al., 2021). Acting as a B3 domain transcription factor, AtREM16 prolongs flowering by coupling on the promoters of SOC1 and FT (Yu et al., 2020). Expression of chrysanthemum Trihelix transcription factors showed that they played important roles in chrysanthemum inflorescences (Song et al., 2016). It has also been shown that expression of chrysanthemum transcription factor ERF can influence flowering time in Arabidopsis (Xing et al., 2019). Additionally, it was shown that CmERF110 interacts with CmFLK to promote flowering by regulating the circadian clock (Huang et al., 2022).
In this study, we identified 16 miRNA-mRNA-TF modules across flower developmental stages (Table S12). The TFs belongs to 16 families. Among these TF families, the bHLH, bZIP, and C2H2 accounted for the largest proportion, followed by B3, Trihelix, ERF, etc. In addition, 71 miRNA-mRNA-TF modules were identified across the tree peony varieties at the flower developmental stages (Table S12). The TFs consisted of 37 TF families, of which the NAC, Trihelix and bHLH families accounted for the largest proportion, followed by ERF, B3, MYB family etc. In this study, the bHLH, NAC, C2H2, bZIP, and Trihelix displayed the most highly differential expression, suggesting that these miRNA-mRNA-TF modules may be crucial factors in floral florescence, development and senescence in tree peony. Their specific functional contributions in tree peony remains to be further explored.
4.4 Limiting factors in the study and future research on tree peony
The first draft genome assembly (~13.79 GB) of tree peony variety ‘Luo shen xiao chun’ reported recently represents the largest sequenced genome in dicotyledon to date (Lv et al., 2020). However, due to the unusually large and complex genome, the draft genome assembly of tree peony is still on scaffold level, which hinders miRNA-mRNA pairs identification by transcriptome and sRNAome analysis using the reference genome. A high-quality reference genome is expected to provide substantial fundamental resources for further research in tree peony in the future. Furthermore, lack of a homologous genetic transformation system has hindered functional genomics research in tree peony (Wen et al., 2020). Breakthroughs in virus-induced gene silencing (VIGS) in rose (Cheng et al., 2018; Liang et al., 2020; Cheng et al., 2021; Zhang et al., 2021) and tree peony (Zhao et al., 2017; Xie et al., 2019; Wang et al., 2020; Han et al., 2022), provide hope for the functional characterization and identification of miRNA-mRNA modules for floral florescence, development, and senescence identified in this study in tree peony.
5 Conclusion
Prolonging blooming period has been an important target for tree peony breeding. The present study provides the integrated analysis of tree peony miRNA-mRNA modules regulated at the transcriptional level, with the purpose of illustrating the regulatory network of floral florescence, development, and senescence. The expression profiles described include developing flowers at multiple developmental time-points, in three varieties with contrasting flowering time (early- and late-flowering), including an early-flowering mutant line found previously. A total of 2,444 tree peony miRNAs were identified, with 1,709 of them being novel. A transcriptome analysis resulted in discovery of 35,687 genes, with a significant number of floral florescence, development, and senescence DEGs associated with chloroplast, chloroplast envelope, plasmodesma, and molecular function process, and involved in plant hormone signal transduction, starch and sucrose metabolism, MAPK signaling, phenylpropanoid and carotenoid biosynthesis pathway. Multi-omics analysis of flowering time regulation networks identified key miRNA-target pairs including transcription factors, protein kinases, and hormone regulators that were antagonistically regulated. Newly discovered functional miRNA-mRNA-TF modules provide molecular resources for further interpretation of the florescence mechanism, and for germplasm resource innovation aimed at prolonging flowering time of tree peony.
Data availability statement
The data presented in the study are deposited in the China National GenBank repository, accession number CNP0002984, https://db.cngb.org/search/?q=CNP0002984.
Author contributions
LG performed the experiments, analyzed the data and wrote the manuscript. YL, CZ, and ZW participated in the sample collection and experimental assay. JC and WY contributed to the manuscript review and editing. XZ contributed to the experimental design, review and editing. XH contributed to the conceptualization, review, editing, and supervision. All authors contributed to the article and approved the submitted version.
Funding
This research was funded by the National Natural Science Foundation of China [Grant number U1804233], the Innovation Scientists and Technicians Troop Construction Projects of Henan Province [Grant number 202101510003], the Outstanding Youth Fund of Natural Science Foundation of Henan Province [Grant number 202300410119], and the Science and Technology Innovation Talents in Universities of Henan Province [22HASTIT036].
Conflict of interest
The authors declare that the research was conducted in the absence of any commercial or financial relationships that could be construed as a potential conflict of interest.
Publisher’s note
All claims expressed in this article are solely those of the authors and do not necessarily represent those of their affiliated organizations, or those of the publisher, the editors and the reviewers. Any product that may be evaluated in this article, or claim that may be made by its manufacturer, is not guaranteed or endorsed by the publisher.
Supplementary material
The Supplementary Material for this article can be found online at: https://www.frontiersin.org/articles/10.3389/fpls.2022.1082415/full#supplementary-material
Supplementary Figure 1 | Expressed miRNA detected across flower developmental stages and varieties in tree peony. (A) The distribution of expressed miRNAs across the four flower developmental stages (BS, IF, FB, DE) in FD. (B) The distribution of expressed miRNAs across the four flower developmental stages (BS, IF, FB, DE) in MU. (C) The distribution of expressed miRNAs across the four flower developmental stages (BS, IF, FB, DE) in LH. (D) Intersection of expressed miRNAs across flower developmental stages (BS, IF, FB, DE) and tree peony varieties (LH, MU and LH). (E) The distribution of expressed miRNAs across varieties (FD, MU and LH) at flower developmental stage BS. (F) The distribution of expressed miRNAs across varieties (FD, MU and LH) at flower developmental stage IF. (G) The distribution of expressed miRNAs across varieties (FD, MU and LH) at flower developmental stage FB. (H) The distribution of expressed miRNAs across varieties (FD, MU and LH) at flower developmental stage DE. (I) Intersection of expressed miRNAs across tree peony varieties (FD, MU and LH) and flower developmental stages (BS, IF, FB, DE).
Supplementary Figure 2 | Summary of the number of miRNAs showing significant differential expression at different flower developmental stages in FD, MU, and LH. (A) Number of miRNAs showing significant differential expression (P< 0.01, P<0.05, and P<0.1) at different flower developmental stages in FD. (B) Number of miRNAs showing significant differential expression (P< 0.01, P<0.05, and P<0.1) at different flower developmental stages in MU. (C) Number of miRNAs showing significant differential expression (P< 0.01, P<0.05, and P<0.1) at different flower developmental stages in LH. The blue colored bars represent the number of upregulated miRNAs. The red colored bars represent the number of downregulated miRNAs.
Supplementary Figure 3 | Annotated genes detected across flower developmental stages in FD, MU, and LH. (A) The distribution of annotated genes across developmental stages (BS, IF, FB, DE) in tree peony genotype FD. (B) The distribution of annotated genes across developmental stages (BS, IF, FB, DE) in tree peony genotype MU. (C) The distribution of annotated genes across developmental stages (BS, IF, FB, DE) in tree peony genotype LH. (D) Intersection of annotated genes across developmental stages (BS, IF, FB, DE) and tree peony varieties (LH, MU and LH).
Supplementary Figure 4 | Annotated genes detected across tree peony varieties at different flower developmental stages. (A) The distribution of annotated genes across varieties (FD, MU and LH) at developmental stage BS. (B) The distribution of annotated genes across varieties (FD, MU and LH) at developmental stage IF. (C) The distribution of annotated genes across varieties (FD, MU and LH) at developmental stage FB. (D) The distribution of annotated genes across varieties (FD, MU and LH) at developmental stage DE. (E) Intersection of annotated genes across varieties (FD, MU and LH) and flower developmental stages (BS, IF, FB, DE).
Supplementary Figure 5 | Summary of the number of genes showing significant differential expression at different flower developmental stages in FD, MU, and LH. (A) Number of genes showing significant differential expression (P<0.05) across different flower developmental stages (BS, IF, FB, DE) in tree peony variety FD, MU, and LH, respectively. (B) Number of genes showing significant differential expression (P<0.05) across varieties (FD, MU, LH) at different flower developmental stages (BS, IF, FB, DE), respectively. The blue colored bars represent the number of upregulated genes. The red colored bars represent the number of downregulated genes.
Supplementary Figure 6 | T plot of mRNA-miRNA pairs selected and verified by qRT-PCR. (A) T plot of MIR11025-p5 and psu.T.00024044. (B) T plot of miR166-5p and psu.T.00024044. (C) T plot of PC-5p-564_43386 and psu.T.00034433. (D) T plot of mtr-miR396b-5p and psu.T.00010381. (E) T plot of PC-3p-602268_25_S and psu.T.00020538. (F) T plot of PC-5p-429002_51_S and psu.T.00018467. (G) T plot of mtr-MIR2592bj-p3 and psu.T.00015108. (H) T plot of PC-5p-143784_277_S and psu.T.00016751.
Supplementary Figure 7 | Correlation analysis of miRNA and target expression profiles between high-throughput sequencing and qRT-PCR. (A) Correlation analysis of psu.T.00024044 with MIR11025-p5 and miR166-5p. (B) Correlation analysis of psu.T.00034433 with PC-5p-564_43386. (C) Correlation analysis of psu.T.00010381 with mtr-miR396b-5p. (D) Correlation analysis of psu.T.00020538 with PC-3p-602268_25. (E) Correlation analysis of psu.T.00018467 with PC-5p-429002_51. (F) Correlation analysis of psu.T.00015108 with mtr-MIR2592bj-p3. (G) Correlation analysis of psu.T.00016751 with PC-5p-143784_277.
References
Achkar, N. P., Cambiagno, D. A., Manavella, P. A. (2016). miRNA biogenesis: a dynamic pathway. Trends Plant Sci. 21, 1034–1044. doi: 10.1016/j.tplants.2016.09.003
Arora, S., Chaudhary, B. (2021). Global expression dynamics and miRNA evolution profile govern floral/fiber architecture in the modern cotton (Gossypium). Planta. 254, 1–20. doi: 10.1007/s00425-021-03711-3
Arrey-Salas, O., Caris-Maldonado, J. C., Hernández-Rojas, B., Gonzalez, E. (2021). Comprehensive genome-wide exploration of C2H2 zinc finger family in grapevine (Vitis vinifera l.): Insights into the roles in the pollen development regulation. Genes. 12, 302. doi: 10.3390/genes12020302
Artur, M. (2022). Ethylene and gibberellins at the crossroads of rice root elongation. Plant Cell. 34, 1157–1158. doi: 10.1093/plcell/koac020
Axtell, M. J., Meyers, B. C. (2018). Revisiting criteria for plant microRNA annotation in the era of big data. Plant Cell. 30, 272–284. doi: 10.1105/tpc.17.00851
Basso, M. F., Ferreira, P., Kobayashi, A. K., Harmon, F. G., Grossi-De-Sá, M. F. (2019). MicroRNAs and new biotechnological tools for its modulation and improving stress tolerance in plants. Plant Biotechnol. J. 17, 1482–1500. doi: 10.1111/pbi.13116
Bezerra, I. C., Michaels, S. D., Schomburg, F. M., Amasino, R. M. (2004). Lesions in the mRNA cap-binding gene ABA HYPERSENSITIVE 1 suppress FRIGIDA-mediated delayed flowering in arabidopsis. Plant J. 40, 112–119. doi: 10.1111/j.1365-313X.2004.02194.x
Cai, C. F., Cheng, F. Y., Wu, J., Zhong, Y., Liu, G. X. (2015). ). the first high-density genetic map construction in tree peony (Paeonia sect. moutan) using genotyping by specific-locus amplified fragment sequencing. PLos One 10, e0128584. doi: 10.1371/journal.pone.0128584
Cheng, C. X., Gao, J. P., Ma, N. (2018). Investigation of petal senescence by TRV-mediated virus-induced gene silencing in rose. Plant Sci. Humana Press. 38, 49–63. doi: 10.1007/978-1-4939-7672-0_4
Cheng, Z. C., Hou, D., Ge, W., Li, X. Y., Gao, J. (2019). Integrated mRNA, microRNA transcriptome and degradome analyses provide insights into stamen development in moso bamboo. Plant Cell Physiol. 61, 76–87. doi: 10.1093/pcp/pcz179
Cheng, C. X., Yu, Q., Wang, Y. R., Wang, H., Dong, Y. H., Ji, Y. Q., et al. (2021). Ethylene-regulated asymmetric growth of the petal base promotes flower opening in rose (Rosa hybrida). Plant Cell. 33, 1229–1251. doi: 10.1093/plcell/koab031
Chen, C., Liu, C. H., Jiang, A. L., Zhao, Q. Q., Zhang, Y. H., Hu, W. Z. (2020). MiRNA and degradome sequencing identify miRNAs and their target genes involved in the browning inhibition of fresh-cut apples by hydrogen sulfide. J. Agr. Food Chem. 68, 8462–8470. doi: 10.1021/acs.jafc.0c02473
Chen, L. N., Luo, X., Yang, X. W., Jing, D., Xia, X. C., Li, H. X., et al. (2020). Small RNA and mRNA sequencing reveal the roles of microRNAs involved in pomegranate female sterility. Int. J. Mol. Sci. 21, 558. doi: 10.3390/ijms21020558
Choudhary, A., Kumar, A., Kaur, H., Kaur, N. (2021). MiRNA: the taskmaster of plant world. Biologia. 76, 1551–1567. doi: 10.1007/s11756-021-00720-1
Conti, L., Galbiati, M., Tonelli, C. (2014). ABA and the floral transition (Dordrecht: Springer). doi: 10.1007/978-94-017-9424-4_18
Feng, P. Q., Guo, H. L., Chi, W., Zhang, L. X. (2016). Chloroplast retrograde signal regulates flowering. P Natl. Acad. Sci. U.S.A. 113 (38), 10708–10713. doi: 10.1073/pnas.152159911
German, M. A., Pillay, M., Jeong, D. H., Hetawal, A., Luo, S., Janardhanan, P., et al. (2008). Global identification of microRNA-target RNA pairs by parallel analysis of RNA ends. Nat. Biotechnol. 26, 941–946. doi: 10.1038/nbt1417
Glazinska, P., Kulasek, M., Glinkowski, W., Wojciechowski, W. (2019). Integrated analysis of small RNA, transcriptome and degradome sequencing provides new insights into floral development and abscission in yellow lupine (Lupines luteus l.). Int. J. Mol. Sci. 20, 5122. doi: 10.3390/ijms20205122
Gregory, P. A., Bert, A. G., Paterson, E. L., Barry, S. C., Tsykin, A., Farshid, G., et al. (2008). The miR-200 family and miR-205 regulate epithelial to mesenchymal transition by targeting ZEB1 and SIP1. Nat. Cell Biol. 10, 593–601. doi: 10.1038/ncb1722
Guo, D. L., Li, Q., Lv, W. Q., Zhang, G. H., Yu, Y. H. (2018). MicroRNA profiling analysis of developing berries for ‘Kyoho’ and its early-ripening mutant during berry ripening. BMC Plant Biol. 18, 1–16. doi: 10.1186/s12870-018-1516-x
Han, R., Truco, M. J., Lavelle, D. O. (2021). Michelmore, R.W. a composite analysis of flowering time regulation in lettuce. Front. Plant Sci. 12. doi: 10.3389/fpls.2021.632708
Han, J. G., Zhang, T. R., Li, J., Hu, Y. H. (2020). Identification of miRNA responsive to early flowering in tree peony (Paeonia ostii) by high-throughput sequencing. J. Hortic. Sci. Biotech. 96, 1–14. doi: 10.1080/14620316.2020.1846466
Han, L., Zhou, L., Zou, H., Yuan, M., Wang, Y. (2022). PsGSTF3, an anthocyanin-related glutathione s-transferase gene, is essential for petal coloration in tree peony. Int. J. Mol. Sci. 23, 1423. doi: 10.3390/ijms23031423
Hao, Z. J., Liu, D., Gong, S. J., Zhao, D. Q., Tao, J. (2017). High throughput sequencing of herbaceous peony small RNAs to screen thermo-tolerance related microRNAs. Genes Genom. 39, 1–12. doi: 10.1007/s13258-016-0505-4
Hernández-Hernández, V., Benítez, M., Boudaoud, A. (2019). Interplay between turgor pressure and plasmodesmata during plant development. J. Exp. Bot. 71, 768–777. doi: 10.1093/jxb/erz434
Hong, D. Y., Zhou, S. L., He, X. J., Yuan, J. H., Zhang, Y. L., Cheng, F. Y., et al. (2017). Current status of wild tree peony species with special reference to conservation. Biodivers Sci. 25, 781–793. doi: 10.17520/biods.2017129
Huang, Y. Y., Xing, X. J., Tang, Y., Jin, J. Y., Ding, L., Song, A. P., et al. (2022). An ERF transcription factor and a FLK homologue jointly modulate photoperiodic flowering in chrysanthemum. Plant Cell Environ. 45, 1442–1456. doi: 10.1111/pce.14261
Iordachescu, M., Bowman, H., Sasaki, K., Imai, R., Satoh, S., Verlinden, S. (2009). Subcellular localization and changes in mRNA abundance of CEBP, a nuclear-encoded chloroplast protein, during flower development and senescence. J. Plant Biol. 52, 365–373. doi: 10.1007/s12374-009-9047-5
Jin, Q. J., Xue, Z. Y., Dong, C. L., Wang, Y. J., Chu, L. L. (2015). Identification and characterization of microRNAs from tree peony (Paeonia ostii) and their response to copper stress. PLos One 10, e0117584. doi: 10.1371/journal.pone.0117584
Kamenetsky, R., Barzilay, A., Erez, A., Halevy, A. H. (2003). Temperature requirements for floral development of herbaceous peony cv. ‘Sarah Bernhardt’. Sci. Hortic. 97 (3-4), 309–320. doi: 10.1016/S0304-4238(02)00153-X
Kim, W., Ahn, H. J., Chiou, T. J., Ahn, J. H. (2011). The role of the miR399-PHO2 module in the regulation of flowering time in response to different ambient temperatures in arabidopsis thaliana. Mol. Cells 32, 83–88. doi: 10.1007/s10059-011-1043-1
Kumar, S. V., Lucyshyn, D., Jaeger, K. E., Alós, E., Alvey, E., Alvey, E., et al. (2012). Transcription factor PIF4 controls the thermosensory activation of flowering. Nature. 484, 242–245. doi: 10.1038/nature10928
Langfelder, P., Horvath, S. (2008). WGCNA: an R package for weighted correlation network analysis. BMC Bioinformatics 9, 559. doi: 10.1186/1471-2105-9-559
Liang, Y., Jiang, C., Liu, Y., Gao, Y., Gao, J. (2020). Auxin regulates sucrose transport to repress petal abscission in rose (Rosa hybrida). Plant Cell. 32, 3485–3499. doi: 10.1105/tpc.19.00695
Li, X. Y., Bian, H. W., Song, D. F., Ma, S. Y., Han, N., Wang, J. H., et al. (2013). Flowering time control in ornamental gloxinia (Sinningia speciosa) by manipulation of miR159 expression. Ann. Bot. 111, 791–799. doi: 10.1093/aob/mct034
Li, S. M., Lv, S. Z., Yu, K., Wang, Z. Y., Huang, J. T. (2019). Construction of a high-density genetic map of tree peony (Paeonia suffruticosa andr. moutan) using restriction site associated DNA sequencing (RADseq) approach. Tree Genet. Genomes. 15, 63. doi: 10.1007/s11295-019-1367-0
Li, X., Shahid, M., Wu, J. W., Wang, L., Liu, X. D., Lu., Y. G. (2016). Comparative small RNA analysis of pollen development in autotetraploid and diploid rice. Int. J. Mol. Sci. 17, 499. doi: 10.3390/ijms17040499
Liu, H., Able, A. J., Able, J. A. (2017). Water-deficit stress-responsive microRNAs and their targets in four durum wheat genotypes. Funct. Integr. Genomics 17, 237–251. doi: 10.1007/s10142-016-0515-y
Liu, H., Able, A. J., Able, J. A. (2020a). Integrated analysis of small RNA, transcriptome, and degradome sequencing reveals the water-deficit and heat stress response network in durum wheat. Int. J. Mol. Sci. 21, 6017. doi: 10.3390/ijms21176017
Liu, H., Able, A. J., Able, J. A. (2020b). Multi-omics analysis of small RNA, transcriptome, and degradome in t. turgidum-regulatory networks of grain development and abiotic stress response. Int. J. Mol. Sci. 21, 7772. doi: 10.3390/ijms21207772
Liu, L., Wu, Y. Q., Zhao, D. Q., Tao, J. (2020). Integrated mRNA and microRNA transcriptome analyses provide insights into paclobutrazol inhibition of lateral branching in herbaceous peony. 3 Biotech. 10, 1–9. doi: 10.1007/s13205-020-02489-7
Livak, K. J., Schmittgen, T. D. (2001). Analysis of relative gene expression data using real-time quantitative PCR and the 2(-delta delta C(T)) method. Methods. 25, 402–408. doi: 10.1006/meth.2001.1262
Lopez-Ortiz, C., Pea-Garcia, Y., Bhandari, M., Abburi, V. L., Reddy, U. K. (2021). Identification of miRNAs and their targets involved in flower and fruit development across domesticated and wild capsicum species. Int. J. Mol. Sci. 22, 4866. doi: 10.3390/ijms22094866
Luo, X. N., Sun, D. Y., Wang, S., Luo, S., Fu, Y. Q., Niu, L. X., et al. (2021). Integrating full-length transcriptomics and metabolomics reveals the regulatory mechanisms underlying yellow pigmentation in tree peony (Paeonia suffruticosa andr.) flowers. Hort. Res. 8 (1), 15. doi: 10.1038/s41438-021-00666-0
Lv, S. Z., Cheng., S., Wang, Z. Y., Li, S. M., Jin, X., Lan, L., et al. (2020). Draft genome of the famous ornamental plant paeonia suffruticosa. Ecol. Evol. 10, 4518–4530. doi: 10.1002/ece3.5965
Martignago, D., Siemiatkowska, B., Lombardi, A., Conti, L. (2020). Abscisic acid and flowering regulation: many targets, different places. Int. J. Mol. Sci. 21, 9700. doi: 10.3390/ijms21249700
Millar, A. A., Lohe, A., Wong, G. (2019). Biology and function of miR159 in plants. Plants. 8, 255. doi: 10.3390/plants8080255
Mishra, P., Panigrahi, K. C. S. (2015). GIGANTEA-an emerging story. Front. Plant Sci. 6. doi: 10.3389/fpls.2015.00008
Ó’Maoiléidigh, D. S., van Driel, A. D., Singh, A., Sang, Q., Le Bec, N., Vincent, C., et al. (2021). Systematic analyses of the MIR172 family members of arabidopsis define their distinct roles in regulation of APETALA2 during floral transition. PLos Biol. 19, e3001043. doi: 10.1371/journal.pbio.3001043
Pei, H. X., Ma, N., Chen, J. W., Zheng, Y., Tian, J., Li, J., et al. (2013). Integrative analysis of miRNA and mRNA profiles in response to ethylene in rose petals during flower opening. PLos One 8, e64290. doi: 10.1371/journal.pone.0064290
Pradervand, S., Weber, J., Thomas, J., Bueno, M., Wirapati, P., Lefort, K., et al. (2009). Impact of normalization on miRNA microarray expression profiling. RNA. 15, 493–501. doi: 10.1261/rna.1295509
Rao, S. P., Li, Y., Chen, J. H. (2021). Combined analysis of microRNAs and target genes revealed miR156-SPLs and miR172-AP2 are involved in a delayed flowering phenomenon after chromosome doubling in black goji (Lycium ruthencium). Front. Genet. 12. doi: 10.3389/fgene.2021.706930
Riboni, M., Robustelli Test, A., Galbiati, M., Tonelli, C., Conti, L. (2016). ABA-dependent control of GIGANTEA signalling enables drought escape via up-regulation of FLOWERING LOCUS T in arabidopsis thaliana. J. Exp. Bot. 67, 6309–6322. doi: 10.1093/jxb/erw384
Shan, H., Chen, S. M., Jiang, J. F., Chen, Y., Gu, C. S., Li, P. L., et al. (2012). Heterologous expression of the chrysanthemum R2R3-MYB transcription factor cmMYB2 enhances drought and salinity tolerance, increases hypersensitivity to ABA and delays flowering in arabidopsis thaliana. Mol. Biotechnol. 51, 160–173. doi: 10.1007/s12033-011-9451-1
Shibuya, K., Shimizu, K., Niki, T., Ichimura, K. (2015). Identification of a NAC transcription factor, EPHEMERAL1, that controls petal senescence in Japanese morning glory. Plant J. 79, 1044–1051. doi: 10.1111/tpj.12605
Shi, Q. Q., Zhang, X. X., Li, X., Zhai, L. J., Luo, X. N., Luo, J. R., et al. (2019). Identification of microRNAs and their targets involved in paeonia rockii petal variegation using high-throughput sequencing. J. Am. Soc Hortic. Sci. 144, 118–129. doi: 10.21273/JASHS04395-18
Shu, H. Y., Zhou, H., Mu, H. L., Wu, S. H., Jiang, Y. L., Yang, Z., et al. (2021). Integrated analysis of mRNA and non-coding RNA transcriptome in pepper (Capsicum chinense) hybrid at seedling and flowering stages. Front. Genet. 1497. doi: 10.3389/fgene.2021.685788
Song, A. P., Wu, D., Fan, Q. Q., Tian, C., Chen, S. M., Guan, Z. Y., et al. (2016). Transcriptome-wide identification and expression profiling analysis of chrysanthemum trihelix transcription factors. Int. J. Mol. Sci. 17, 198. doi: 10.3390/ijms17020198
Spanudakis, E., Jackson, S. (2014). The role of microRNAs in the control of flowering time. J. Exp. Bot. 65, 365–380. doi: 10.1093/jxb/ert453
Strathmann, A., Kuhlmann, M., Heinekamp, T., Dröge-Laser, W. (2001). BZI-1 specifically heterodimerises with the tobacco bZIP transcription factors BZI-2, BZI-3/TBZF and BZI-4, and is functionally involved in flower development. Plant J. 28, 397–408. doi: 10.1046/j.1365-313X.2001.01164.x
Sun, L. Y., Jiang, Z., Ju, Y., Zou, X., Wan, X., Chen, Y., et al. (2021). A potential endogenous gibberellin-mediated signaling cascade regulated floral transition in magnolia×soulangeana ‘Changchun’. Mol. Genet. Genomics 296, 207–222. doi: 10.1007/s00438-020-01740-3
Sun, Y. J., Xiong, X. G., Wang, Q., Zhu, L., Wang, L., He, Y., et al. (2021). Integrated analysis of small RNA, transcriptome, and degradome sequencing reveals the MiR156, MiR5488 and MiR399 are involved in the regulation of male sterility in PTGMS rice. Int. J. Mol. Sci. 22, 2260. doi: 10.3390/ijms22052260
Susila, H., Jin, S., Ahn, J. H. (2016). Light intensity and floral transition: chloroplast says “time to flower”. Mol. Plant 9, 1551–1553. doi: 10.1016/j.molp.2016.10.013
Waheed, S., Zeng, L. H. (2020). The critical role of miRNAs in regulation of flowering time and flower development. Genes. 11, 319. doi: 10.3390/genes11030319
Wang, J. W., Czech, B., Weigel, D. (2009). MiR156 regulated SPL transcription factors define an endogenous flowering pathway in arabidopsis thaliana. Cell. 138, 738–749. doi: 10.1016/j.cell.2009.06.014
Wang, S. L., Gao, J., Xue, J. Q., Xue, Y. Q., Li, D. D., Guan, Y. R., et al. (2019). De novo sequencing of tree peony (Paeonia suffruticosa) transcriptome to identify critical genes involved in flowering and floral organ development. BMC Genomics 20, 1–22. doi: 10.1186/s12864-019-5857-0
Wang, X. J., Liang, H. Y., Guo, D. L., Guo, L. L., Duan, X. G., Jia, Q. S., et al. (2019). Integrated analysis of transcriptomic and proteomic data from tree peony (P. ostii) seeds reveals key developmental stages and candidate genes related to oil biosynthesis and fatty acid metabolism. Hort. Res. 6 (1), 1–19. doi: 10.1038/s41438-019-0194-7
Wang, H., Li, Y., Chern, M. S., Zhu, Y., Zhang, L. L., Lu, J. H., et al. (2021). Suppression of rice miR168 improves yield, flowering time and immunity. Nat. Plants. 7, 129–136. doi: 10.1038/s41477-021-00852-x
Wang, X., Li, J., Guo, J., Qiao, Q., Ma, Y. (2020). The WRKY transcription factor PlWRKY65 enhances the resistance of paeonia lactiflora (herbaceous peony) to alternaria tenuissima. Hort. Res. 7, 12. doi: 10.1038/s41438-020-0267-7
Wang, H. P., Li, Y., Pan, P. P., Lou, D. J., Hu, Y. R. (2017). The bHLH transcription factors MYC2, MYC3, and MYC4 are required for jasmonate-mediated inhibition of flowering in arabidopsis. Mol. Plant 10, 1461–1464. doi: 10.1016/j.molp.2017.08.007
Wang, S., Liu, L., Mi, X., Zhao, S., Wei, C. (2021). Multi-omics analysis to visualize the dynamic roles of defense genes in the response of tea plants to gray blight. Plant J. 106, 862–875. doi: 10.1111/tpj.15203
Wen, S. S., Chen, L., Tian, R. N. (2020). Micropropagation of tree peony (Paeonia sect. moutan): A review. Plant Cell Tiss Org. 141, 1–14. doi: 10.1007/s11240-019-01747-8
Xie, L., Yan, Z., Li, M., Tian, Y., Zhang, Y. (2020). Identification of phytochemical markers for quality evaluation of tree peony stamen using comprehensive HPLC-based analysis. Ind. Crops Prod. 154, 112711. doi: 10.1016/j.indcrop.2020.112711
Xie, L., Zhang, Q., Sun, D., Yang, W., Zhang, Y. (2019). Virus-induced gene silencing in the perennial woody paeonia ostii. PEERJ. 7, e7001. doi: 10.7717/peerj.700
Xie, Y. R., Zhou, Q., Zhao, Y. P., Li, Q. Q., Liu, Y., Ma, M. D., et al. (2020). FHY3 and FAR1 integrate light signals with the miR156-SPL module-mediated aging pathway to regulate arabidopsis flowering. Mol. Plant 13, 483–498. doi: 10.1016/j.molp.2020.01.013
Xing, X. J., Jiang, J. F., Huang, Y. Y., Zhang, Z. X., Song, A. P., Ding, L., et al. (2019). The constitutive expression of a chrysanthemum ERF transcription factor influences flowering time in arabidopsis thaliana. Mol. Biotechnol. 61, 20–31. doi: 10.1007/s12033-018-0134-z
Xu, Y. J., Zhu, S. W., Liu, F., Wang, W., Wang, X. W., Han, G. M., et al. (2018). Identification of arbuscular mycorrhiza fungi responsive microRNAs and their regulatory network in maize. Int. J. Mol. Sci. 19, 3201. doi: 10.3390/ijms19103201
Yang, Y., Sun, M., Li, S. S., Chen, Q. H., Silav, J. A. T. D., Wang, A. J., et al. (2020). Germplasm resources and genetic breeding of paeonia: a systematic review. Hort. Res. 7 (1), 19. doi: 10.1038/s41438-020-0332-2
Yang, S. H., Yamaguchi, Y., Koizumi, N., Kusano, T., Sano, H. (2002). Promoter analysis of tbzF, a gene encoding a bZIP type transcription factor, reveals distinct variation in cis-regions responsible for transcriptional activation between senescing leaves and flower buds in tobacco plants. Plant Sci. 162, 973–980. doi: 10.1016/S0168-9452(02)00043-2
Yin, D. D., Li, S. S., Shu, Q. Y., Gu, Z. Y., Wang, L. S. (2018). Identification of microRNAs and long non-coding RNAs involved in fatty acid biosynthesis in tree peony seeds. Gene. 666, 72–82. doi: 10.1016/j.gene.2018.05.011
Yu, Y. C., Qiao, L. F., Chen, J. C., Rong, Y., Zhao, Y. H., Cui, X. K., et al. (2020). Arabidopsis REM16 acts as a B3 domain transcription factor to promote flowering time via directly binding to the promoters of SOC1 and FT. Plant J. 103, 1386–1398. doi: 10.1111/tpj.14807
Zhang, L., Guo, D. L., Guo, L. L., Guo, Q., Wang, H. F., Hou, X. G. (2019). Construction of a high-density genetic map and QTLs mapping with GBS from the interspecific F1 population of p. ostii ‘Fengdan bai’ and p. suffruticosa ‘Xin riyuejin’. Sci. Hortic. 246, 190–200. doi: 10.1016/j.scienta.2018.10.039
Zhang, G. Y., Huang, S. Q., Zhang, C., Li, D. F., Wu, Y. B., Deng, J. L., et al. (2021). Overexpression of CcNAC1 gene promotes early flowering and enhances drought tolerance of jute (Corchorus capsularis l.). Protoplasma. 258, 337–345. doi: 10.1007/s00709-020-01569-y
Zhang, L., Song, C. W., Guo, D. L., Guo, L. L., Hou, X. G., Wang, H. F. (2022). Identification of differentially expressed miRNAs and their target genes in response to brassinolide treatment on flowering of tree peony (Paeonia ostii). Plant Signal Behav. 17, 2056364. doi: 10.1080/15592324.2022.2056364
Zhang, Y. X., Wang, Y. Y., Gao, X. K., Liu, C. Y., Gai, S. P. (2018). Identification and characterization of microRNAs in tree peony during chilling induced dormancy release by high-throughput sequencing. Sci. Rep. 8, 1–14. doi: 10.1038/s41598-018-22415-5
Zhang, Y., Wu, Z., Feng, M., Chen, J., Qin, M., Wang, W., et al. (2021). The circadian-controlled PIF8–BBX28 module regulates petal senescence in rose flowers by governing mitochondrial ROS homeostasis at night. Plant Cell. 33, 2716–2735. doi: 10.1093/plcell/koab152
Zhang, Q., Zhao, Y. Q., Gao, X., Jia, G. X. (2021). Analysis of miRNA-mediated regulation of flowering induction in lilium×formolongi. BMC Plant Biol. 21, 1–16. doi: 10.1186/s12870-021-02961-3
Zhao, A. J., Cui, Z., Li, T. G., Pei, H. Q., Sheng, Y. Q., Li, X. Q., et al. (2019). mRNA and miRNA expression analysis reveal the regulation for flower spot patterning in phalaenopsis ‘Panda’. Int. J. Mol. Sci. 20, 4250. doi: 10.3390/ijms20174250
Zhao, D. Q., Gong, S. J., Hao, Z. J., Tao, J. (2015). Identification of miRNAs responsive to botrytis cinerea in herbaceous peony (Paeonia lactiflora pall.) by high-throughput sequencing. Genes. 6, 918–934. doi: 10.3390/genes6030918
Zhao, D., Xia, X., Wei, M. G., Sun, J., Meng, J. S., Tao, J. (2017). Overexpression of herbaceous peony miR156e-3p improves anthocyanin accumulation in transgenic arabidopsis thaliana lateral branches. 3 Biotech. 7, 1–19. doi: 10.1007/s13205-017-1011-3
Zhu, L., Li, S. S., Ma, Q. Y., Wen, J., Yan, K. Y., Li, Q. Z. (2021). The acer palmatum TCP transcription factor ApTCP2 controls leaf morphogenesis, accelerates senescence, and affects flowering via miR319 in arabidopsis thaliana. J. Plant Growth Regul. 41, 244–256. doi: 10.1007/s00344-021-10299-1
Zuluaga, D. L., De Paola, D., Janni, M., Curci, P. L., Sonnante, G. (2017). Durum wheat miRNAs in response to nitrogen starvation at the grain filling stage. PLos One 12, e0183253. doi: 10.1371/journal.pone.0183253
Keywords: tree peony, miRNA-target modules, florescence, floral development, senescence
Citation: Guo L, Li Y, Zhang C, Wang Z, Carlson JE, Yin W, Zhang X and Hou X (2022) Integrated analysis of miRNAome transcriptome and degradome reveals miRNA-target modules governing floral florescence development and senescence across early- and late-flowering genotypes in tree peony. Front. Plant Sci. 13:1082415. doi: 10.3389/fpls.2022.1082415
Received: 28 October 2022; Accepted: 17 November 2022;
Published: 14 December 2022.
Edited by:
Hui Song, Qingdao Agricultural University, ChinaReviewed by:
Qianqian Shi, Northwest A&F University, ChinaShiping Cheng, Pingdingshan University, China
Copyright © 2022 Guo, Li, Zhang, Wang, Carlson, Yin, Zhang and Hou. This is an open-access article distributed under the terms of the Creative Commons Attribution License (CC BY). The use, distribution or reproduction in other forums is permitted, provided the original author(s) and the copyright owner(s) are credited and that the original publication in this journal is cited, in accordance with accepted academic practice. No use, distribution or reproduction is permitted which does not comply with these terms.
*Correspondence: Xiaogai Hou, hkdhxg@haust.edu.cn; Xiuxin Zhang, zhangxiuxin@caas.cn