Trilliumosides K and L, two novel steroidal saponins from rhizomes of Trillium govanianum, as potent anti-cancer agents targeting apoptosis in the A-549 cancer cell line
 Bashir Ahmad Lone1,2†
  Misbah Tabassum1,3†
  Anil Bhushan1,2 Dixhya Rani1,2
  Urvashi Dhiman1,2
  Ajaz Ahmad4 Hilal Ahmad Mir5 Prem N. Gupta1,3 D. M. Mondhe1,3
  Sumeet Gairola1,6
  Prasoon Gupta1,2*
- 1CSIR-Human Resource Development Centre, Academy of Scientific and Innovative Research, Ghaziabad, India
- 2Natural Products and Medicinal Chemistry Division, CSIR-Indian Institute of Integrative Medicine, Jammu, India
- 3Pharmacology Division, CSIR-Indian Institute of Integrative Medicine, Jammu, India
- 4Department of Clinical Pharmacy, College of Pharmacy, King Saud University, Riyadh, Saudi Arabia
- 5Department of Ophthalmology, Pathology, and Cell Biology, Columbia University, New York, NY, United States
- 6Plant Science and Agrotechnology Division, CSIR-Indian Institute of Integrative Medicine, Jammu, India
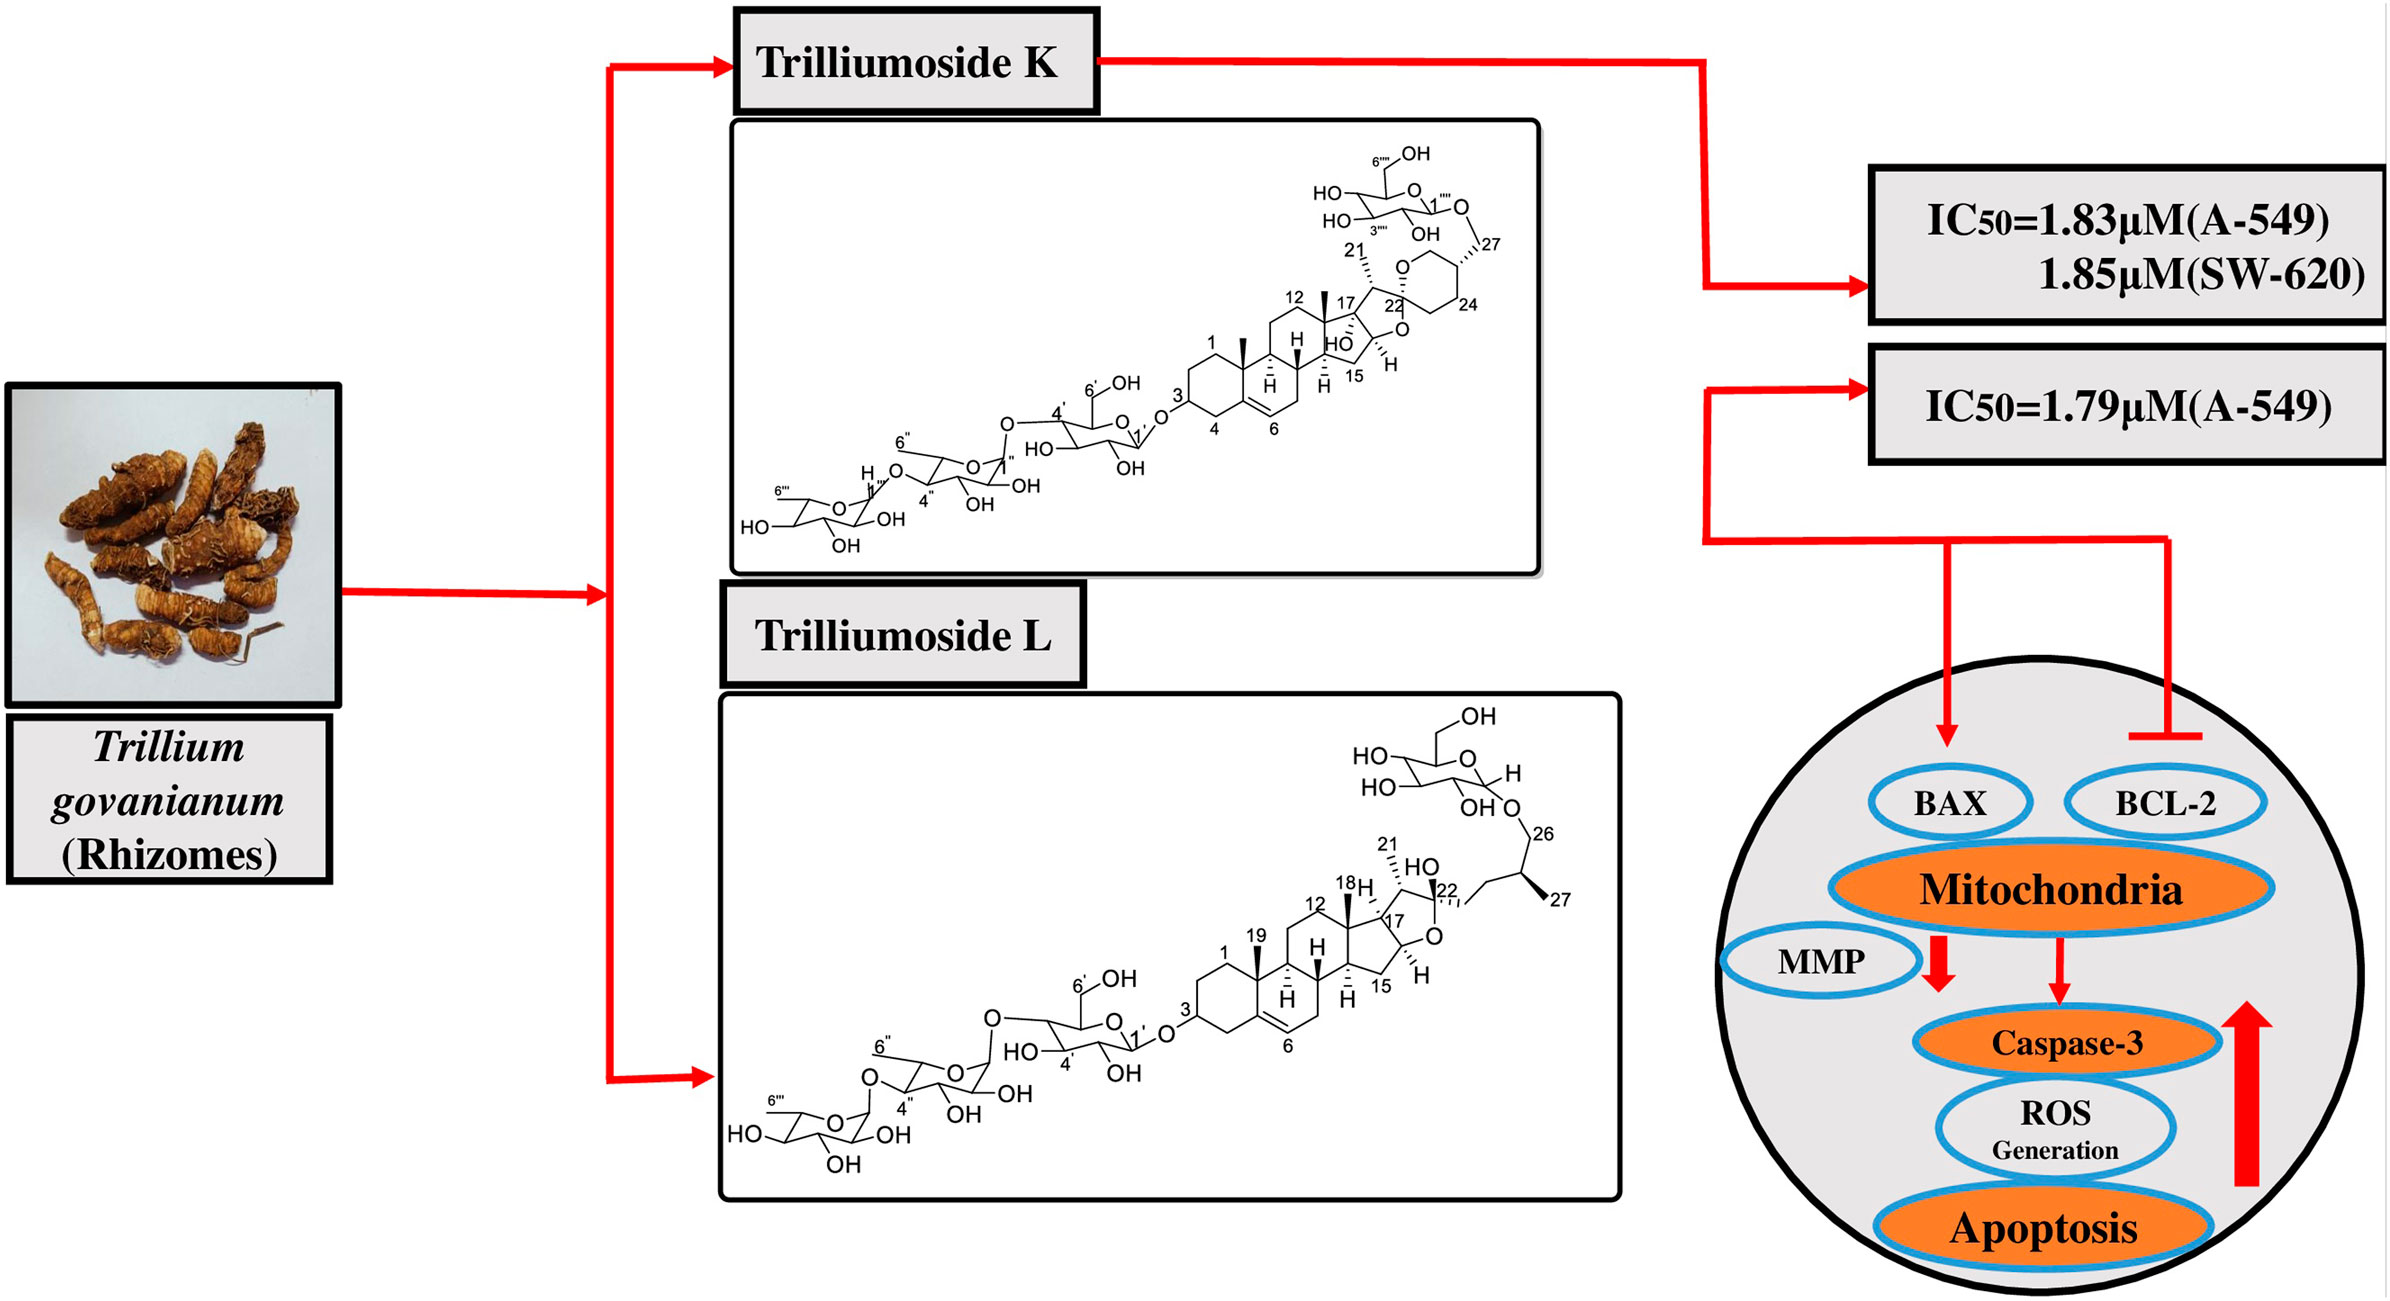
Two novel steroidal saponins, trilliumosides K (1) and L (2), were isolated from the rhizomes of Trillium govanianum led by bioactivity-guided phytochemical investigation along with seven known compounds: govanoside D (3), protodioscin (4), borassoside E (5), 20-hydroxyecdysone (6), 5,20-hydroxyecdysone (7), govanic acid (8), and diosgenin (9). The structure of novel compounds 1-2 was established using analysis of spectroscopic data including 1D and 2D nuclear magnetic resonance (NMR) and high resolution mass spectrometry (HR-ESI-MS) data. All isolated compounds were evaluated for in vitro cytotoxic activity against a panel of human cancer cell lines. Compound 1 showed significant cytotoxic activity against the A-549 (Lung) and SW-620 (Colon) cancer cell lines with IC50 values of 1.83 and 1.85 µM, respectively whereas the IC50 value of Compound 2 against the A-549 cell line was found to be 1.79 µM. Among the previously known compounds 3, 5, and 9, the cytotoxic IC50 values were found to be in the range of 5–10 µM. Comprehensive anti-cancer investigation revealed that Compound 2 inhibited in vitro migration and colony-forming capability in the A-549 cell line. Additionally, the mechanistic analysis of Compound 2 on the A-549 cell line indicated distinctive alterations in nuclear morphology, increased reactive oxygen species (ROS) production, and decreased levels of mitochondrial membrane potential (MMP). By upregulating the pro-apoptotic protein BAX and downregulating the anti-apoptotic protein BCL-2, the aforementioned actions eventually cause apoptosis, a crucial hallmark in cancer research, which activates Caspase-3. To the best of our knowledge, this study reports the first mechanistic anti-cancer evaluation of the compounds isolated from the rhizomes of T. govanianum with remarkable cytotoxic activity in the desired micromolar range.
Highlights
1) Extraction, isolation and characterization of two new steroidal saponins using detailed NMR studies along with seven known compounds from bioactive fraction of Trillium govanianum.
2) Evaluate in vitro cytotoxic potential of T. govanianum extracts, fractions and purified compounds against various human cancer cell lines.
3) Compound 1 showed significant cytotoxic activity against A-549 (Lung) and SW-620 (Colon) cell lines with IC50 values of 1.83 and 1.85 µM, whereas compound (2) IC50 value against A-549 cell line was found to be 1.79 µM.
4) Compound 2 demonstrated significant cytotoxic effect by inhibiting cell proliferation, promoting apoptosis in lung (A-549) carcinoma.
5) Our study reports the first mechanistic anticancer evaluation of the compounds isolated from the rhizomes of T. govanianum with remarkable activity in the desired micro molar range.
1 Introduction
Trillium govanianum (TG) is an indigenous, perennial medicinal herb of the North-Western Himalayan region belonging to the family Melanthiaceae. Genus Trillium consists of 42 species found in different areas across the globe. According to the Global Biodiversity Information Facility (GBIF), most of the species are located in North America and Europe, and only nine are found in the Asian continent (Ohara and Kawano, 2005; Sofi et al., 2022). In India, TG is commonly known by vernacular names such as Nag Chhatri and is distributed in an altitudinal range of 2,500–3,800 m in the Himalayan region (Chauhan et al., 2019; Sharma and Samant, 2104). In the traditional medicine system, the rhizomes of TG are used to treat wound healing, skin diseases, dysentery, and menstrual and sexual disorders (Pant and Samant, 2010; Rani et al., 2013). Increased market demand for TG at the international level is due to an essential phytosteriod sapogenin, i.e., Diosgenin (2.5%), which is an important component of commercial steroids and sex hormones (Sharma et al., 2018). Previous phytochemical investigations of the genus Trillium have reported the identification of fatty acid esters, saponins, phenolics, terpenoids, flavonoids, and steroids. Among all the isolates, steroidal saponins were found to be major bioactive compounds (Ono et al., 1986; Mimaki and Watanabe, 2008; Huang and Zou, 2011; Ur Rahman et al., 2017; Yan et al., 2021). To date, more than 30 steroidal saponins have been discovered from Trillium species and they were found to exhibit anti-oxidant, anti-fungal, anti-inflammatory, and anti-cancer properties (Yan et al., 2009).
Cancer is one of the most difficult public health issues that humanity has ever faced. Cancer develops because of aberrant cells proliferating uncontrollably, which has the potential to invade and damage healthy bodily tissues. The disease is characterized by high rates of morbidity and mortality; in many countries, it ranks second in terms of cause of death, after cardiovascular disease. Chemotherapy, either administered alone or in conjunction with radiotherapy and surgery, is currently the primary cancer treatment modality used to lower the death rate from the disease globally (Kumar et al., 2023). Although a number of therapeutic agents have been effectively tested and employed to eradicate various forms of cancer, adverse effects have consistently been demonstrated to be significant issues (Beniwal et al., 2022). Certainly, there is an immense requirement to create novel, potent, and efficient new medicinal entities that have improved effectiveness and fewer negative consequences. Throughout history, natural products have been the most important source of drug molecules. Approximately 74% of anti-cancer drugs are natural products or derived from natural products, highlighting their major role in cancer chemotherapy (Tan et al., 2006). Steroidal saponins are important natural glycosidic compounds that possess an amphiphilic character and show remarkable cytotoxic activity (Ya-Zheng et al., 2018). Recent studies have shown that saponins can inhibit the growth of numerous cancer cells, via their ability to decrease tumor growth, induce apoptosis, promote autophagy, and control the tumor microenvironment via several signaling pathways (Wang et al., 2018; Zhang et al., 2019). Plant also exhibits antibacterial, anti fungal, anti informatory and anti oxidant properties (Ismail et al., 2015). In our continuing efforts to discover cytotoxic compounds in plants, the crude extracts, fractions. The present study aimed to isolate and characterize two new steroidal saponins (1–2) and seven known compounds (3–9) (Figures 1, 2). Structural determination of these compounds was based on modern spectroscopic analysis, including high resolution mass spectrometry (HRMS), one dimensional (1D), two dimensional (2D) nuclear magnetic resonance (NMR), and acid hydrolysis.
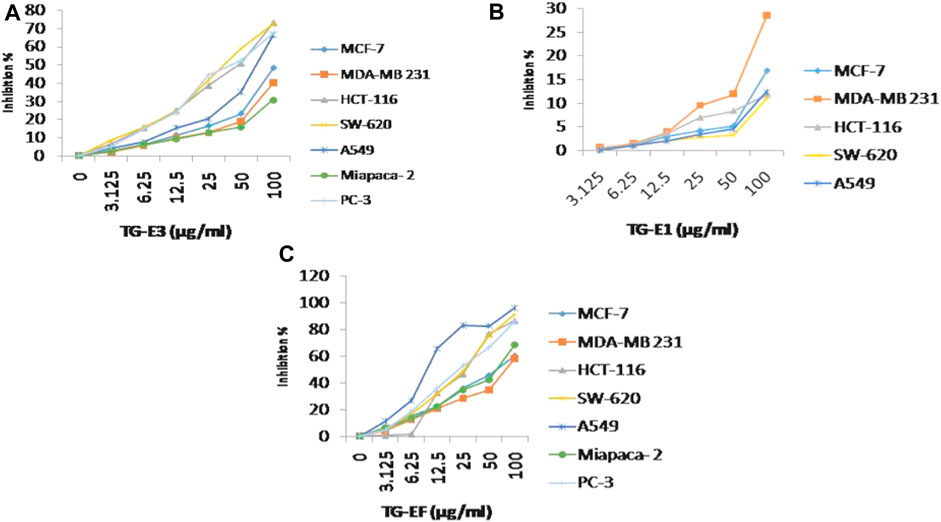
FIGURE 1. Cytotoxicity activity (% growth inhibition) for (A) TG-E1, (B) TG-E3, and (C) TG-EF at different concentrations and µg/mL.
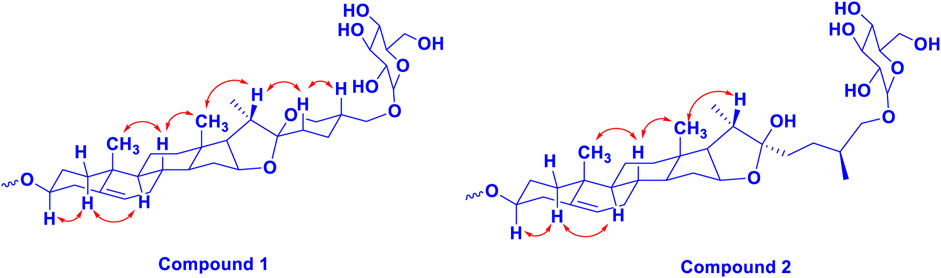
FIGURE 2. The key 1H-1H NOESY (arrow) correlations of 1 and 2.
2 Material and methods
2.1 General experimental procedures and chemicals used
Column chromatography was done by using silica gel (60–120 and 100–200 mesh size), HP-20, HP-20SS, Sephedex, and silver nitrate-incorporated silica gel. Merck Kieselgel (Aufoilen) 60 F254 plates were used for thin-layer chromatography (TLC). High resolution mass spectra were obtained on Agilent 6540 (Q-TOF) mass spectrometer, in the electrospray (ESMS) mode. All solvents used for high performance liquid chromatography (HPLC) analysis were obtained from Merck Chemicals (Mumbai India). Water used for extraction and isolation purposes was obtained at Central Drug House (P) Ltd., Delhi. Spectroscopic data (NMR) of isolated compounds was gathered on a 1H NMR at 400 and 500 MHz and on a13C NMR at 100 and 125 MHz (Bruker Advance spectrometer). The reference point was TMS (δH and δC: 0.00 ppm). Chemical shifts (δ) were referenced internally to the residual solvent peak (CD3OD: 1H- 3.30, 13C- 49.0 ppm). In 2D NMR, all heteronuclear 1H and 13C correlations were established based on gradient-enhanced inverse-detected Heteronuclear Multiple Bond Correlation (HMBC) and Heteronuclear single quantum coherence (HSQC) experiments. HP-20, HP-20SS, Sephedex, silver nitrate, dimethylsulphoxide (DMSO), and all other chemicals were purchased from Sigma–Aldrich (St. Louis, MO, United States).
2.2 Plant material
The rhizomes of T. govanianum were collected from (the Shroth Dhar, Paddar Kisthwar) area of Distt. Doda (J&K, India) at the altitude of 3,000–3,074 masl. Authentication of the crude herb was done by Dr. Sumeet Gairola (Plant Science and Agrotechnology Division IIIM), and the voucher specimen (No. RRLH-23418) was submitted to the Crude Drug Repository of CSIR-IIIM, Jammu.
2.3 Extraction and isolation
Shade-dried rhizomes of T. govanianum (1.9 kg) were ground to powder and sequentially extracted twice (drenched for 12 h each) with 3.5 L of chloroform followed by 3 L H2O: MeOH (20:80) thrice. The extracts were filtered separately and concentrated using rota vapor at 45°C at reduced pressure to obtain crude chloroform and hydroalcoholic extract (187.78 g and 229.44g), respectively. Further (20% aq. MeOH) extract (229.44 g) was directly subjected to reverse phase column chromatography for purification using HP-20 dianion exchange resin eluted with a gradient of water: methanol solvent system (100:00.0–10:90.0 one lit er collected measurements of all fractions) and on concentration, giving 20 collective subfractions (Fr.HA.01-Fr.HA.20). Further, white precipitate was formed in (Fr.HA.12-Fr.HA.16), which on washing with HPLC grade water and separated using Whatman filter paper grade-1 yielded white amorphous powder compound 5 (8.67 g). The isolate was detected on TLC [CHCl3: MeOH: H2O (6.5:3:0.5)] as a single dark green spot upon heating the dried TLC in the anisaldehyde sulphuric acid reagent. Polar subfractions (Fr.HA.01-Fr.HA.07) (26.45 g) with the same chemical profile were pooled and processed for further purification on HP-20SS resin, using a gradient of MeOH: H2O (95%–55%), which afforded 35 small fractions (100 mL each), and these fractions were divided into six subfractions on the bases of their chemical profiling, namely, Fr.1A-Fr.1F. Fraction Fr.1C (2.24 g) upon purification using reverse phase dianion (HP-20SS) eluted with a gradient of water: methanol solvent system of 0.5:9.5–8.5:2.5 25 ml each collected in 50 mL test tubes, based on the TLC profile fractions 6.5:3.5 and 8.5:2.5, afforded compound 1 and 2 (27.11, and 17.75 mg) as a white amorphous solid and dark brown crystalline solid, respectively. Furthermore, purification of fraction F-1A-1B (1.95 g) on HP-20SS, using an H2O: MeOH solvent system (70:30), afforded compound 3 (40 mg) as a white solid powder. Remixing (95:0.5–75:2.5) fractions (0.87 g) and again purifying using dianion (HP-20SS) resin, eluted with an isocratic solvent system of MeOH: H2O (75:25), yielded compound 4 (61 mg) as a yellowish powder. Chloroform extract (187.78 g) was processed for fractionation to separate the oily non-polar part using solvent–solvent fractionation. Extract (187.78 gm) was dissolved in 1 L of CHCl3, 800 mL of water was added to solubilize the extract, and an equal amount of cyclohexane was used. After partition, the hexane layer was separated and concentrated using rotavapor (36.11 gm) with an oily mass left behind. The hexane fraction/extract was processed for purification by normal phase column chromatography (CC) (silver nitrate incorporated silica gel, 100–200 mesh) to isolate lipid compounds using a distilled hexane:ethyl acetate solvent system for elution (100:0 to 70:30, 100 mL fractions were collected). These were concentrated using rotavapor, giving a total of 11 pooled fractions (Fr.H.1–Fr.H.11) based on their TLC outline. The fraction (Fr.H.6-Fr.H.9) gave a single major spot after charring and drying in the anisaldehyde reagent and was washed with chilled cyclopentane 100 mL to obtain compound 6 (White powder 2.66 gm). The remaining chloroform residual extract (131.66 gm) was processed for the isolation of individual compounds by CC (silica gel, 100–200 mesh), and eluted with hexane:ethyl acetate (500 mL collected volumes) with increasing polarity. The eluted fractions were concentrated on rotavapor, giving six new fractions (Fr.CR-1– Fr.CR-6) based on the TLC analysis. Fraction CR-03 (17.78 g) was again processed for purification by CC using silica gel 100–200 mesh with n-hexane-ethyl acetate (1:0 to 8:2, 100 mL volumes were collected) to obtain nine daughter fractions (Fr.3A-Fr.3I). Upon placing these fractions overnight on working table, colorless needles were formed in Fr.3D-Fr.3G. This yielded compound 7 (1.11g), which was visualized using a developing solvent system of Hex-EtOAc (80:20); a bright green spot appeared after spraying anisaldehyde reagent and heating the TLC plate. Moreover, Fr.CR.4-Fr.CR.6 (28.45 g) fractions were again purified by CC on silica gel (60–120 mesh, 200 g), using a gradient of CHCl3–MeOH (100%–80%), and a total of 22 fractions were obtained (100 mL each). These fractions were separated into six subfractions (Fr.A1-Fr.A6) based on similarities in their TLC profiles. The several times repeated CC of F.B2 fraction (7.27 g) on silica (230–400 mesh, 100 g), using the increasing polarity of CHCl3–MeOH (85:15), afforded compounds 8 and 9 (0.9 gm) and (42 mg), respectively. The chemical structures of all the isolated and characterized compounds are presented in Figure 3.
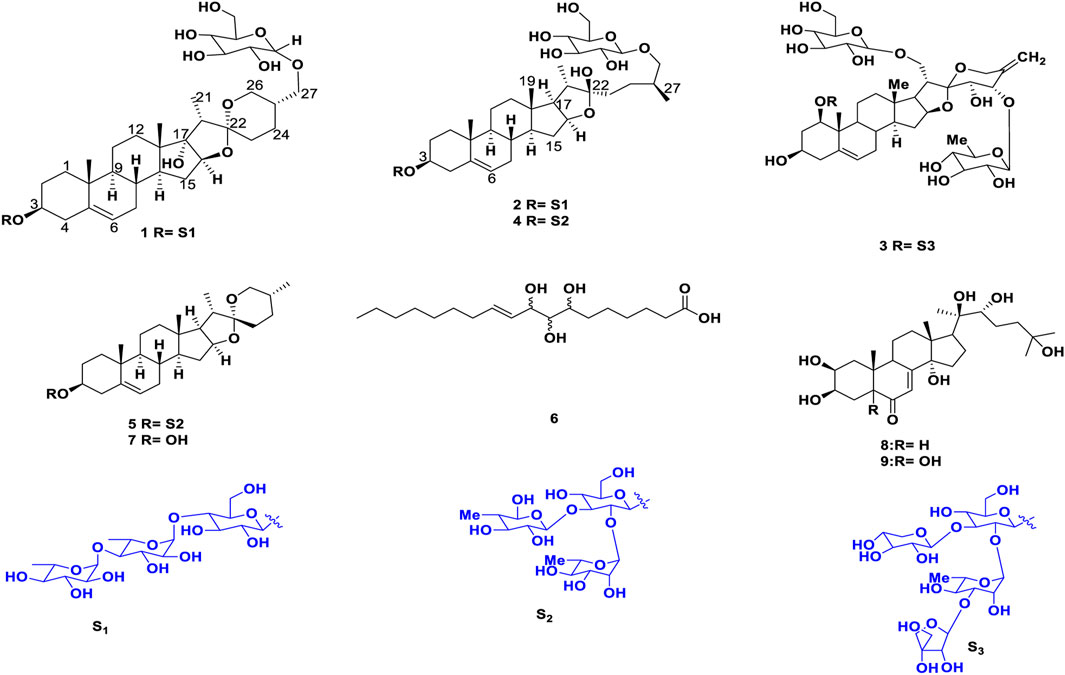
FIGURE 3. Structures of the identified compounds (1–9).
Trilliumoside K (1): Brownish solid (27.11 mg). Its molecular formula was determined to be C51H85O23, by ESI-MS data at m/z 1064.5568 [M + H]+ (calcd. for C51H85O23+,1064.53), together with its NMR data (Figure 3) (Tables 1, 2).
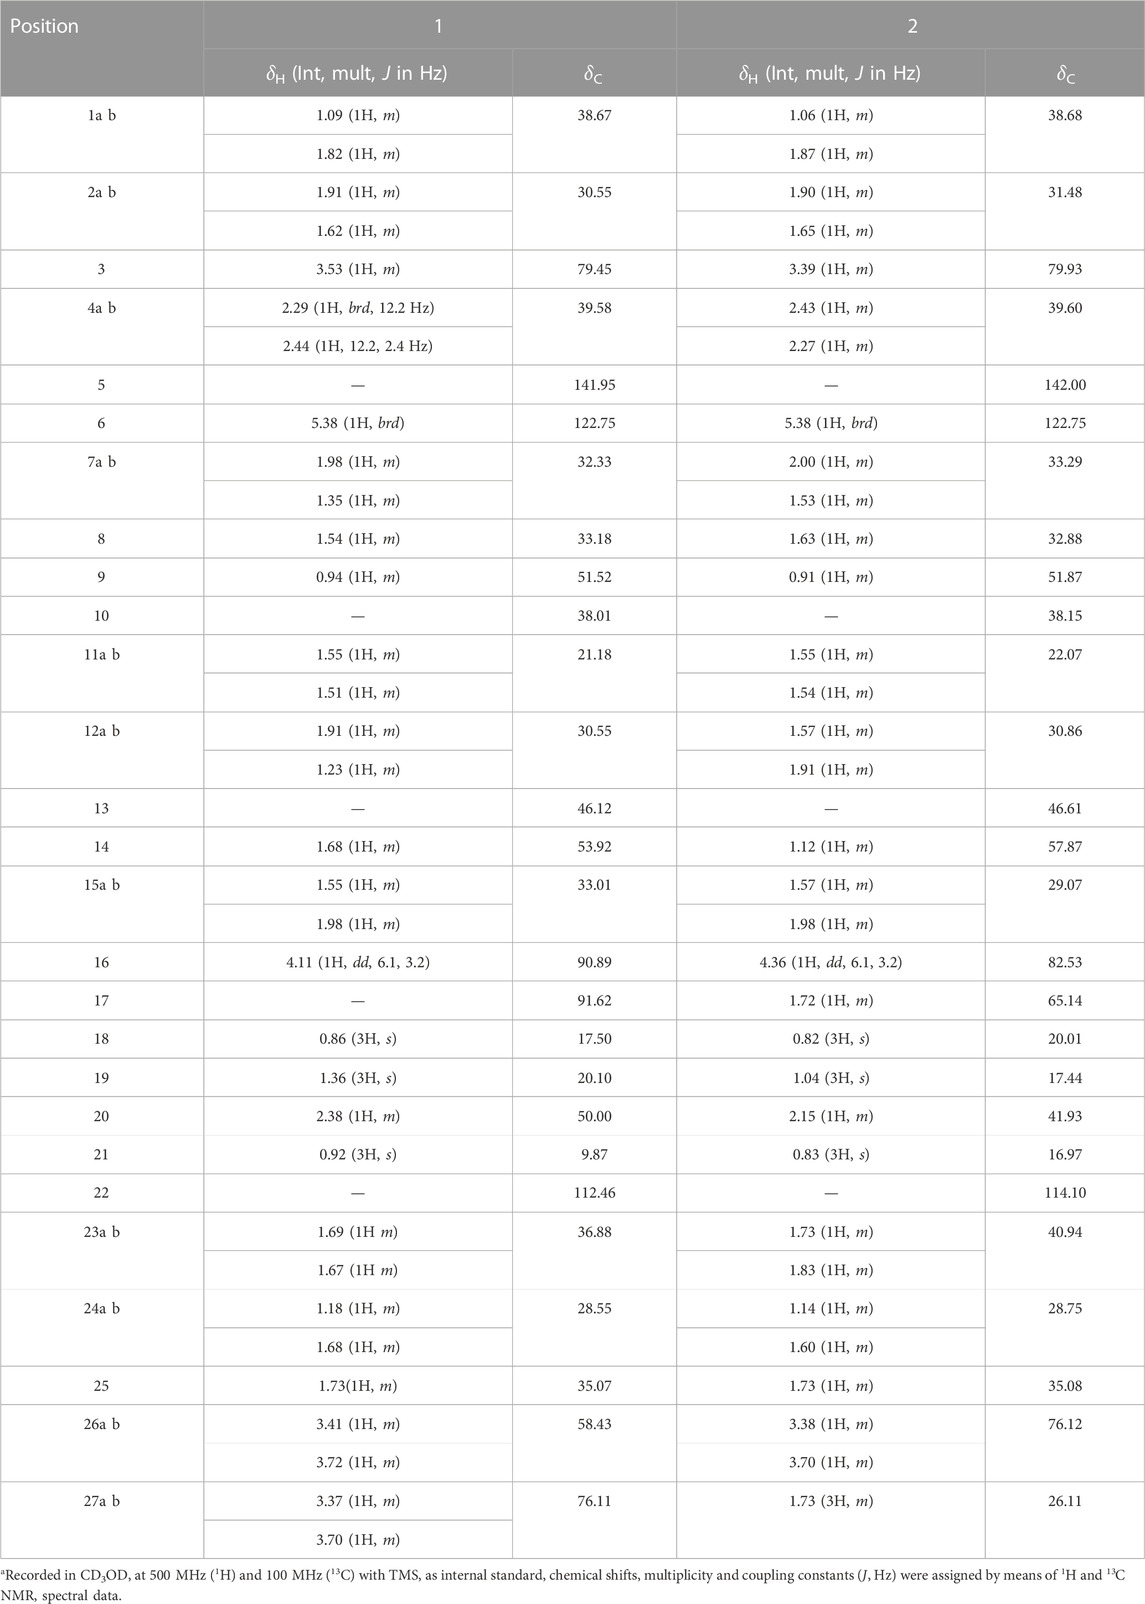
TABLE 1. 1H and 13C NMR spectroscopic data for aglycone of trilliumosides K and L (1 and 2)a.
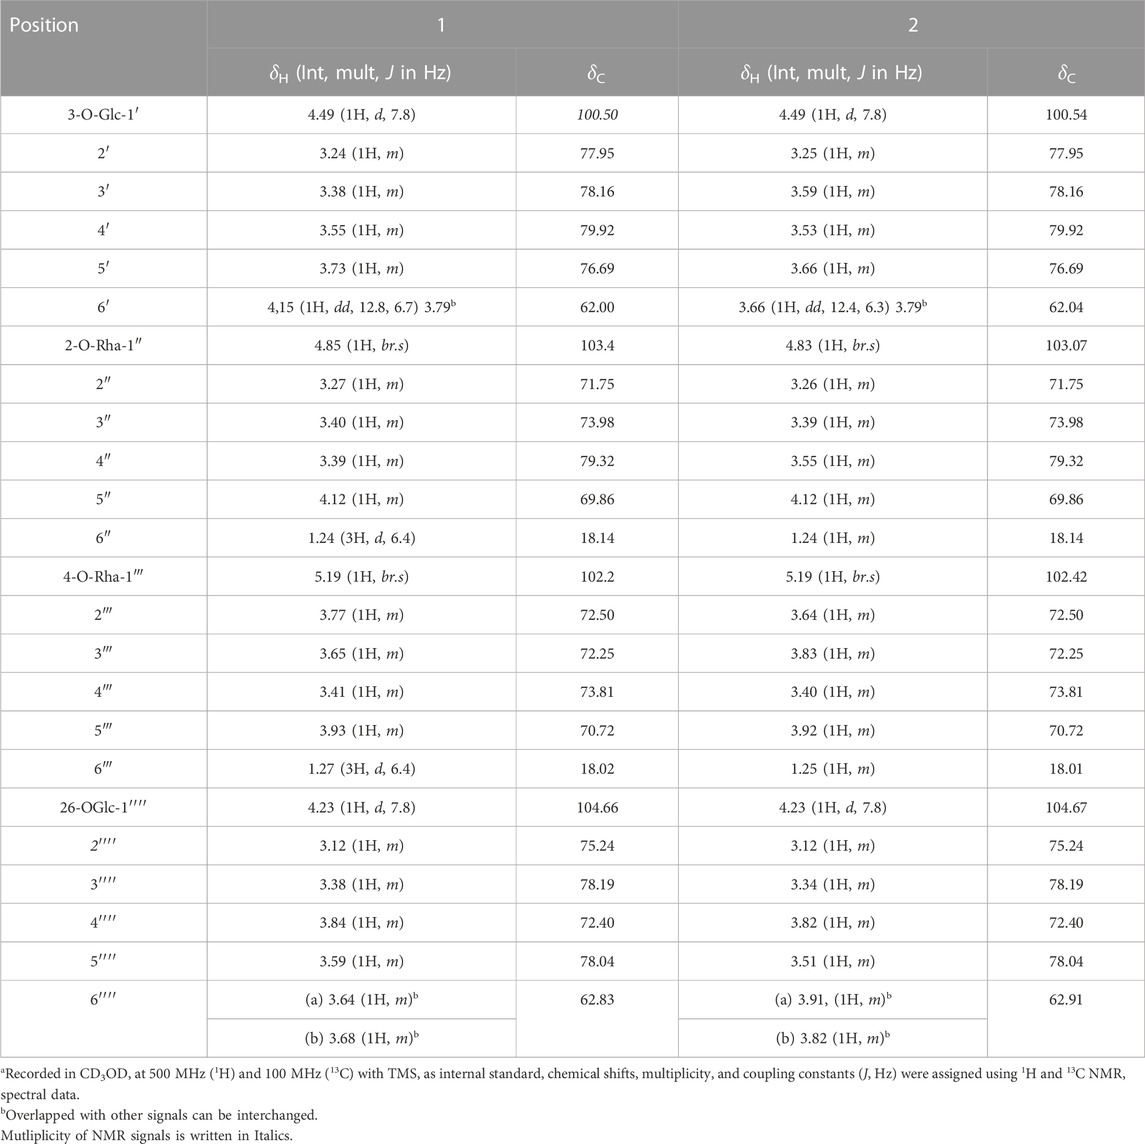
TABLE 2. 1H and 13C NMR spectroscopic data for glycone of trilliumosides K and L (1 and 2)a.
Trilliumoside L (2): This was isolated as a brownish amorphous solid (17.75 mg). Its molecular formula was determined to be C51H85O22, by HR-ESI-MS data at m/z 1049.5413 [M + H]+ (calcd. for C51H85O22+, 1049.55), together with its NMR data (Tables 1, 2).
Govanoside D (3): Yellow amorphous powder, (37 mg); ESI-MS (Negative): 1356.60 (M-H)- (Calcd. C61H95O33−, 1356.60); the 1H NMR (400 MHz, CD3OD) and 13C NMR (100 MHz, CD3OD) data agreed with literature data of Govanoside D (Singh et al., 2021).
Protodioscin (4): White colored amorphous solid, (40 mg); ESI-MS: (Positive) m/z 1071.43 [M + Na]+ (Calcd. for C51H84O22Na+, 1071.43); the 1H-NMR (CD3OD, 400 MHz) and 13C-NMR (CD3OD, 100 MHz) experimental data agreed with literature data of Protodioscin (Abdel-Sattar et al., 2008).
Borassoside E (5): White colored amorphous solid, (8.67 gm); ESI-MS (Negative): 867.46 (M-H)- (Calcd. 867.48, C45H71O16−); the 1H NMR (400 MHz, CD3OD) and 13C NMR (100 MHz, CD3OD) experimental data agreed with that of literature data of Borassoside E (Yokosuka and Mimaki, 2008a; Ismail et al., 2015).
Govanic acid (6): White solid, (1.11 gm) ESI-MS (Positive); 331.2436 (M + H)+ (calcd., C18H35O5+, 331.2436); the 1H NMR (400 MHz, CDCl3) and 13C NMR (100 MHz, CDCl3) data was found to be identical to literature data of Govanic acid (Ur Rahman et al., 2017).
Diosgenin (7): Colorless crystalline, solid (678 mg); ESI-MS (Positive): 415 (M + H)+ (Calcd. 415.31, C27H43O3+); the 1H NMR (400 MHz, CDCl3) and 13C NMR (100 MHz, CDCl3) data resembled that of literature data of Diosgenin (Ismail et al., 2015).
20-Hydroxy ecdysone (8): White colored solid, (0.9g) HR-MS m/z 481.3161 [M + H] +(calcd for C27H45O7+, 481.3161). the 1H NMR (400 MHz, CD3OD) and 13C NMR (100 MHz, CD3OD) observed data agreed with previously reported literature data of 20-Hydroxy ecdysone (Ur Rahman et al., 2017).
5,20-Hydroxy ecdysone (9): White colored solid, (40 mg) ESI-MS (Positive); 497.30 (M + H)+ (calcd. C18H45O8+, 497.31); the 1H NMR (400 MHz, CDCl3), and 13C NMR (100 MHz, CDCl3) data was found to be similar to previously reported data of 5,20-Hydroxy ecdysone (Ur Rahman et al., 2017).
2.4 Sugar analysis of compounds (1–2)
2.4.1 Acid hydrolysis and GC/MS analysis
Both new compounds, 1 and 2 (10 mg), were each dissolved in 5 mL MeOH and then 5 mL 5% HCl (V/V) was added to the solution. The reaction mixture was refluxed in an oil bath at 100°C for 3 h after the completion of the reaction. To separate the aglycone component, methanol was distilled, and the reaction mixture was agitated with CHCl3. Using rotavapor, the CHCl3 extract was dried over anhydrous sodium sulfate, and the solvent was then distilled out. The residue was dissolved in HPLC-grade methanol before undergoing aglycone moiety analysis. The silver oxide was used to neutralize the acidic aqueous mother liquor, and the precipitate that resulted was filtered out and washed three times with distilled water. The combined filtrate and washings were concentrated using a rotary evaporator under reduced pressure at 50°C. Pyridine and acetic anhydride were used to further acetylate the residue, and G.C. grade EtOAC was used to prepare the acetylated sample for GC/MS analysis. By comparing the sugar units' retention times to those of the reference sugar, the sugar units from the G.C. analysis were verified (acylated). The presence of 32.705 (β-D-glucose) and 26.202 (α-L-rhamnose) was confirmed by GC/MS analysis, given in S.I. (Supplementary Figures S9, S18), and additional sugar units were discovered based on the NMR data (Love and Simons, 2020).
2.5 Biology
2.5.1 Cell culture and growth conditions
Different human cancer cell lines, such as lung (A-549; HOP-62), breast (MCF-7; MDA-MB 231), pancreatic (Mia PaCa-2), colon (SW-620; HCT-116), prostate (PC-3), and neuroblastoma (SH-SY5Y) were grown in growth medium (RPMI-1640 and DMEM) boosted with 10% fetal bovine serum (FBS Qualified: Standard origin Brazil 10270106), streptomycin (100 units/mL) and penicillin (100 units/mL) in tissue culture flasks. fR2 is a normal cell line and was grown in RPMI-1640 media supplemented with 10% FBS and maintained in a CO2 incubator (Thermocon Electron Corporation, United States) at 37°C with permissible atmospheric conditions of (95%) air and (5%) CO2 with (98%) humidity. These cell lines were procured from the National Cancer Institute (NCI), United States.
2.5.2 Sulphorhodoamine B (SRB) assay
The SRB assay is a colorimetric assay performed to evaluate the cytotoxic potential of active inhibitors (Desai et al., 2008). Ninety six well flat transparent plates were seeded with the optimal cell density per well (Flat bottom). 100 µL/well of cell suspension of each cell line was plated with their specific cell number, such as PC-3 (7000), MCF-7 (8000), MDA-MB 231 (7500), A-549 (7500), Mia PaCa-2 (6500), SW-620 (7500) HCT-116 (7000), HOP-62 (7500) and allowed to grow overnight at 37°C with 5% Co2 in a cell-culture incubator. The cells were treated with various concentrations of test compounds (1, 5, 10, 30, and 50 µM) after 24 h of incubation, along with camptothecin as a positive control. The cells were incubated again at similar culture conditions for 48 h, and ice-cold TCA fixed the cells for 1 h at 4°C. Plates were washed thrice with water and allowed to dry. Further, at room temperature, 0.4% SRB dye was added (100 µL in each well) for half an hour. The plate was then washed thrice with water and once with 1% v/v acetic acid to remove the unbound SRB and allowed to dry for some time at room temperature. To solubilize the bound dye, 100 µL of 10 mM Tris buffer (pH–10.4) was added to each well. The plates were then kept in the shaker for 5 min to dissolve the protein-bound dye properly. Finally, the Optical Density (OD) was noted at 540 nm in a microplate reader, and then IC50 was calculated using GraphPad Prism Software.
2.5.3 DAPI staining
A-549 cells were seeded in six-well plates (1 × 10⁵) for 24 h and treated with various Compound 2 concentrations for 48 h. After 48 h, PBS wash was given, cell fixation was done using cold methanol, and plates were kept at 4°C for 20 min. Next, the cells were stained with DAPI at 1 μg/mL concentration in PBS. The morphological alterations in the cell nuclei were observed using a fluorescence microscope, specifically the Olympus IX53. This microscopy allowed for the visualization and assessment of changes in the structure of the cell nuclei induced by the treatment.
2.5.4 Reactive oxygen species (ROS) assay
A-549 cells cell was seeded at the density (2 × 10⁵) for 24 h in a 6-well plate. After 24 h of incubation, different concentrations of Compound 2 for 48 h were used and 0.05% H2O2 was used as a positive control. After the PBS wash, cell staining was done using DCFH-DA (Dichlorodihydro-fluorescein diacetate) dye. The reactive oxygen species (ROS) levels were subsequently analyzed using a fluorescence microscope (Olympus IX53). This process allowed for the observation and quantification of the levels of ROS within the cells, providing insights into the oxidative stress induced by the treatment with Compound 2 and the positive control H2O2.
2.5.5 Colony formation assay
A-549 cells were seeded at the density of 2 × 10⁵ for 24 h in 6-well plates. After 24 h of incubation, the cells were treated with Compound 2 at concentrations of 1, 2, 4, and 6 µM. Trypsinization of cells was done after 48 h, and cells were re-seeded as 1000 cells/well. Cells were allowed to regrow to form colonies to test the clonogenic potential. Fixation of cells was done with 4% formaldehyde (1 mL/well) followed by PBS wash. Staining was done with 0.5% crystal violet dye, and the colonies were counted (Vichai and Kirtikara, 2006).
2.5.6 In vitro cell migration assay
A-549 cells were seeded in six well-flat transparent plates and allowed to confluent up to 70%–80% for 24 h in a starving condition (serum starved), and a straight horizontal line with a sterile 200 µL tip was created by scraping the monolayer of A-549 cells. Finally, the cells were treated with Compound 2 at concentrations of 1, 2, 4, and 6 µM for 48 h. Images of the wounded area were taken at 0 and 48 h, and the following equation demonstrated the percentage of wound closure:
2.5.7 Mitochondrial membrane potential
Six-well plates were used for the culture of A-549 cells (1.5 × 10⁵) for 24 h and were treated with Compound 2 at concentrations of 1, 2, 4, and 6 µM and with 0.25 µM of camptothecin for 48 h. One hour before terminating the experiment, 10 nM Rhodamine −123 dye was added, and a PBS wash was given. Cells were analyzed under a fluorescence microscope (Olympus IX53) (Gupta et al., 2017a).
2.5.8 Western blot analysis
For Western blotting, A-549 cells were seeded at a density of 3 × 10³ cells/well in six-well plates. After 24 h, the A-549 cells were treated with different concentrations of Compound 2. The concentrations were 1, 2, 4, and 6 µM for 48 h. After 48 h, cells were washed with cold PBS. Cell lysates were prepared in 1X RIPA buffer (Sigma) with added sodium orthovanadate (100 mM), protease cocktail (Roche), NaF (100 mM), PMSF (100 mM), and EDTA (100 mM). Protein estimation was done using Bradford reagent (Bio-Rad). The samples were boiled with sample buffer containing 1% β-mercaptoethanol, 6% glycerol, 2% SDS, 22 mM Tris-HCl pH-6.8, and bromophenol blue. Whole-cell lysates corresponding to 70–100 ug of protein were loaded. SDS-PAGE analyzed the samples with a 10% separating gel (Gupta et al., 2017b). After running the gel, the proteins were transferred to the PVDF membrane and then blocked for 1 h in a solution of 5% BSA, 0.1% Tween 20, 150 mM NaCl, and 20 mM Tris-HCl pH-7.4. After blocking, the membrane was probed with primary BAX, BCL-2, and cleaved caspase-3, which was further incubated with the corresponding (CST) HRP-conjugated secondary antibodies. β-Actin was used as a gel loading control (Majeed et al., 2014).
2.5.9 Statistical analysis
Data analysis was done using Microsoft Excel and GraphPad Prism 5 software. All data analysis was done using GraphPad Prism-5 software and ImageJ. The statistical significance of data was determined by one-way analysis of variance (ANOVA) and was accepted at p < 0.05.
3 Results and discussion
3.1 Chemistry
Crude chloroform and 20% aq. MeOH extract of the rhizomes of T. govanianum underwent a sequence of column chromatographic purification steps using silica gel, HP-20, HP-20SS resins, and Sephadex respectively, to obtain two new steroidal saponins, named trilliumoside K (1) and L (2) along with seven known previously reported compounds. Comparison of their NMR and MS data with the reported literature confirmed the structures of seven known compounds as govanoside D (Singh et al., 2021), protodioscin (Abdel-Sattar et al., 2008; Gupta et al., 2017b), borassoside E (Yokosuka and Mimaki, 2008a; Ismail et al., 2015), diosgenin (Ismail et al., 2015), govanic acid (Ur Rahman et al., 2017), 20-hydroxyecdysone (Ur Rahman et al., 2017), and 5,20-hydroxyecdysone (Ur Rahman et al., 2017). Moreover, the 1D and 2D NMR characterization data of both the new compounds are described.
Trilliumoside K (1) was isolated as a brownish solid. Its molecular formula, C51H85O23, was deduced by ESI-MS data at m/z 1064.5568 [M + H]+ (calcd for C51H84O23, 1063.52), along with its 1H and 13C NMR data (Tables 1, 2). The NMR spectra of compound 1 (TG-07B3) exhibited two typical angular signals for two quaternary methyls, resonating at δH 0.86 and 1.03 assignable to the CH3-18 (s) and CH3-19 (s) methyl groups; one methyl doublet for secondary methyl group at δH 0.92 (d, J, 6.3 Hz, 21-CH3); four oxymethylene protons at δH 3.41 (m, H-26a), δH 3.72 (m, H-26b), δH 3.37 (m, H-27a), and δH 3.70 (m, H-27b), (Supplementary Figure S1); and their respective 13C signals were found resonating at δC 58.43 and 76.12, with one olefinic proton resonating at δH 5.38 (br., s, H-6). In 13C there were two olefinic signals observed at δC 141.95 (C-5) and 122.75 (C-6) (Supplementary Figure S2) and one quaternary carbon characteristic of hemiketal functionality was found resonating at δC 112.46 (C-22). The downfield shift of δH at 3.53 and δC at 79.45 indicated the presence of hydroxyl or glycosidic substitutions at this position. The positions of protons were confirmed by using 2D HSQC and 1H-1H COSY spectra. Further, the 13C spectrum confirms the methine carbon at δc 90.89 assigned to C-16 and 91.62 for quaternary carbon assigned to C-17 (Supplementary Figure S3) which indicated the presence of hydroxyl group at C-17 and the basic skeleton of aglycone was characteristic of pennogenin moiety when compared with literature data (Ju and Jia, 1992). The final stereochemistry of the steroidal skeleton was deduced based on nuclear Overhauser effect spectroscopy (NOESY) correlations. The cross peaks of H-1a on the NOESY spectrum with respect to H-3 were examined to determine the relative configuration of aglycone moiety. The NOESY (Supplementary Figure S7) correlations between H-8 and methyl groups at H-18 and H-19 confirmed the methyl groups to be
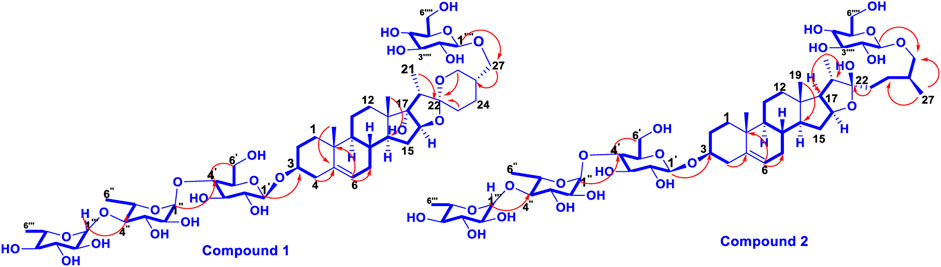
FIGURE 4. The important HMBC (→) and 1H-1H COSY (─) correlations (1 and 2).
Trilliumoside L (2) was obtained as a yellow-brownish solid. Its molecular formula was determined to be C51H85O22, by HR-ESI-MS data at m/z 1049.5413 [M + H]+ (calcd. for C51H84O22, 1048.55), in combination with 1H and 13C NMR data (Tables 1, 2). The analysis of the 1H and 13C NMR spectral data of compound 2 revealed the presence of two typical angular signals for two quaternary methyls resonating at δH 0.82 and 1.04, assignable to the CH3-18 (s) and CH3-19 (s) methyl groups, and two methyl doublets for two secondary methyl groups at δH 0.96 (d, J, 6.2 Hz, CH3-27) and 1.20 (d, J, 6.3 Hz, 21-CH3) (Supplementary Figure S10). There was also a characteristic signal for two oxymethylene protons observed at δH 3.32 (m, H-26a) and δH 3.73 (m, H-26 b), and an olefinic proton resonating at δH 5.38 (br, s, H-6). In 13C NMR data, two olefinic signals were found resonating at δC 141.95 (C-5) and 122.75 (C-6) while there was one characteristic quaternary hemiketalic carbon at δC 114.46 (C-22). Furthermore, it was confirmed that the configuration of a hydroxyl group at C-22 was identified as β indicated by its resonance at δC 114.46, instead of an α configuration for which δC 112 is the characteristic resonance (Yokosuka and Mimaki, 2008a). The configuration 25 R was confirmed by the chemical shift difference between the geminal protons H-26a (δ 3.38, m) and H-26b (δ 3.70, m) (Δ δab = 0.32 ppm): Δ δab < 0.48 ppm for 25R and Δ δab >0.57 ppm corresponds for 25S (Braca et al., 2004). The closer examination of 1H and 13C spectra confirmed the aglycone moiety similar to protodiosgenin. The NOESY spectrum showed the correlations between the H-8 and H-18/19 methyl groups which confirmed that the methyl groups were β-oriented. The NOESY correlations between H-9/H-14 and H-14/H-16 confirmed them to be α-oriented. Further, the ring fusion of B\C and C/D rings was identified as trans, while the D/E ring was confirmed to have cis fusion (Figure 2) by the NOESY correlations (Mimaki et al., 2008). The 1H NMR spectrum of compound 2 showed signals characteristic of anomeric protons which were found resonating at δH 4.24 (d, J =7.8 Hz, Glc C-26), 4.49 (d, J = 7.84 Hz, Glc1-H-1), 4.85 (br s, Rha1), and 5.18 (br s, Rha 2) with the corresponding anomeric carbon resonances observed at δC 104.67, 100.54, 103.07 and 102.42, respectively, in 13C NMR spectrum (Supplementary Figure S11). The sugar component was found to be composed of two units of D-glucose and L-rhamnose, obtained after acid hydrolysis of compound 2. It was also confirmed by comparing their 1H and 13C NMR data and coupling constants with literature reports. The sugar attachment sites were determined by key HMBC correlations (Figure 4). The presence of HMBC correlation between Glc-H-1′ (δH 4.49) and C3 (δC 79.92) of aglycone proved Glc1′ to be attached at C-3 of the aglycone. There was another key HMBC correlation observed between C-4′ of Glc1-′ (δH 4.49) and Rha-H-1′′ (δH 4.85) which confirmed that Rha1 was located at C-4 of Glc1′. Further, the attachment 1‴ of Rha-2 (δH 5.18) to C-3 of Rha-H-1′′ (δC 79.43) was confirmed by correlations found in the HMBC spectrum. There was another correlation between O-Glc-H′′′′ (δH 4.24) and C-26 (δC 76.11). The
3.2 Biology
3.2.1 Cell growth inhibition studies
According to the previous anti-cancer study reports on T. govanianum’s rhizomes, the crude MeOH extract and its polarity-based subfractions have demonstrated different levels of significant cytotoxicity, with IC50 values ranging between (5–13 μg/mL) against four human cancer cell lines, namely, urinary bladder (EJ138), breast (MCF7), liver (HepG2), and lung (A549) but there is no individual anti-cancer report on pure isolated compounds of T. govanianum. However, there are several anti-cancer studies on steroidal saponins, the major bioactive components of the genus Trillium (Yokosuka and Mimaki, 2008b; Hayes et al., 2009) containing mono, di, tri, or tetrasacchride, commonly composed of glucose, rhamnose, apiose, xylose, and arabinose sugar units linked to a β-D-glucosyl moiety at C3 of the aglycone (Gao et al., 2015) (Gao et al., 2015). In one study, Paris saponin VII, a diosgenin-based saponin isolated from T. tschonoskii Maxim showed cytotoxicity against MCF7, human colorectal cancer cells-29, and SW-620 (IC50 = 9.547, IC50 = 1.02 ± 0.05, and 4.90 ± 0.23 μm, respectively). Interestingly, Compound 2 displayed cellular anti-proliferative activity in A-549 cancer cells with IC50 values of 1.79 μM with excellent selectivity over fR2 normal cells (Supplementary Table S2). Further, Paris VII induced cell apoptosis in a caspase-3-dependent manner and cell cycle arrest in the G1 Phase (Li et al., 2014). In another study, two new saponins from the underground part of T. tschonoskii displayed strong cytotoxic activity against the HepG2 cell line (IC50 = 0.499 mmol/L) (Chai et al., 2014). Diosgenin, isolated as a major compound from Trillium species, showed a potent cytotoxic effect against HepG2 and HCT116 cells in the MTT assay (Eskander et al., 2013). Based on the above hypothesis and the resemblance of both new compounds (1 and 2) with that of previously reported anti-cancer saponins, the current anti-cancer study was designed and demonstrated for the genus Trillium.
The anti-cancer potential of crude extracts (CHCl3, 20% aq. MeOH, and one sub-fraction of 20% aq. MeOH) and nine isolated compounds were evaluated for their in-vitro cytotoxic potential, which was expressed in percentage of inhibition and IC50 values respectively (Supplementary Figures S1, S2) against a panel of human cancer cell lines, namely, lung cancer (A-549, HOP-62), breast (MCF-7, MDA-MB 231), pancreatic (MiaPaCa-2), colon cancer (SW-620, HCT-116), prostate (PC-3) and neuroblastoma (SH-SY5Y) cancer using an SRB assay. The results revealed that among extracts, fraction E.F. (subfraction of 20% aq. MeOH) (IC50 µg/mL) exhibited the highest in-vitro cytotoxicity, followed by its parent fraction 20%aq. MeOH and CHCl3 (IC50 µg/mL) as presented in Figure 1. However, among the pure compounds, Compound 1 (IC50 µM) and Compound 2 (IC50 µM) showed maximum inhibition effects on A-549 and SW-620 cell lines in a concentration-dependent manner (Table 1 S33). Further, three known compounds, diosgenin, protodioscin, and borassoside E, showed good cytotoxic activity on A-549 and SW-620 cell lines. However, compounds TG-01, TG-03, TG-04, TG-05, TG-06, and TG-12 at a concentration of 10 µM did not possess significant cytotoxicity (<45 %) against the tested human cell lines. Compounds 1 and 2 showed the best percentage growth inhibition among all isolated compounds, 75.35 and 92.11 at 10 μM and 50 µM. Out of active compounds 1 and 2, Compound 2 was further evaluated for detailed in-vitro anti-cancer studies by performing DAPI, ROS, mitochondrial membrane potential (MMP), Colony formation assay, and wound healing/scratch assay. However, due to a restricted quantity of Compound 2, we could not proceed with its in-vivo studies.
3.2.2 Compound 2 altered the nuclear morphology assessed by DAPI
Cells undergoing apoptosis have characteristic features like apoptotic body formation, nuclear shrinkage, and chromatin condensation (Elmore, 2007). To assess the morphological changes in nuclei, we used DAPI (4′,6-diamidino-2-phenylindole), which is a DNA-specific dye that binds to the minor groove of the A-T region (Biancardi et al., 2013; Pathania et al., 2015). A-549 cells were treated with various concentrations (1, 2, 4, and 6 µM) of Compound 2 for 48 h; Camptothecin (CPT) was used as a positive control. At 48h, cells were washed with PBS, stained with DAPI, and examined under fluorescence microscopy. Higher levels of apoptotic body formation and chromatin condensation were observed in Compound 2 and Camptothecin (0.25 µM) treated A-549 cells in a concentration-dependent manner compared to untreated cells. These morphological changes demonstrate that the treatment of A-549 cells with Compound 2 caused a significant increase in apoptotic body formation in a concentration-dependent manner (Figure 5) and depicts an anti-proliferative effect. These characteristic features were absent in untreated control cells.
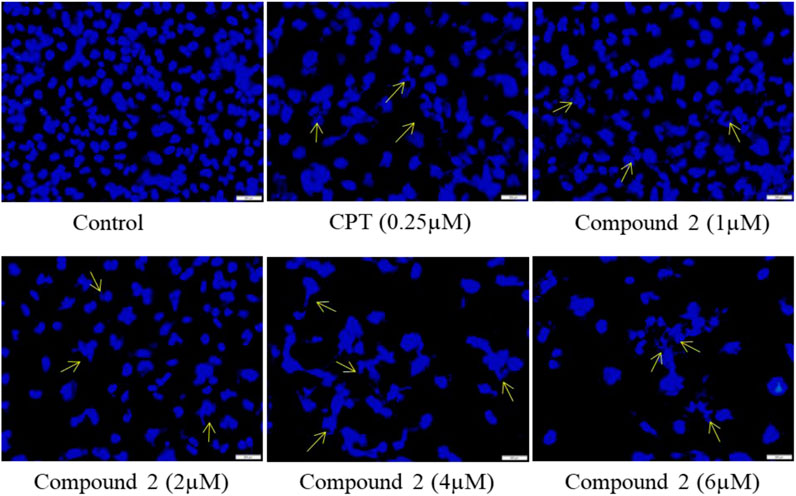
FIGURE 5. Compound 2 mediated apoptosis in A-549 cells. Cells were cultured for 48 h in the presence of 10% FBS. At 24 h, cells were treated with different concentrations (1, 2, 4, and 6 µM) of compound 2. Camptothecin was used as a positive control. At 48 h, cells were stained with DAPI (1 μg/mL) dye and monitored by a fluorescence imaging microscope. The yellow arrows indicate apoptotic body formation, nuclear shrinkage, and chromatin condensation.
3.2.3 Intracellular ROS production induced by compound 2 in A-549 cells
ROS are pivotal in many biological processes. ROS are a hallmark of apoptosis. Increased intracellular ROS levels damage the membrane lipids, intra-cellular proteins, organelles, and nucleic acids, which trigger cell cycle arrest and apoptosis in cancer cells (Perillo et al., 2020). Therefore, to examine the impact of Compound 2 on ROS production, A549 cells were treated with various concentrations of compound 2 (1, 2, 4, and 6 µM), and intracellular ROS levels were analyzed using a fluorescent probe DCFH-DA. The fluorescence intensity is a quantitative estimation of ROS generation in cancer cells. A significant increase in intracellular ROS levels was observed in Compound-treated A-549 cells compared to untreated cells. Higher levels of ROS were observed in the positive control (H2O2-treated cells). This study shows that compound 2 induces ROS generation in A-549 cells in a concentration-dependent manner. Green signal cells were quantified using ImageJ software and presented in the histogram (Figures 6A, B).
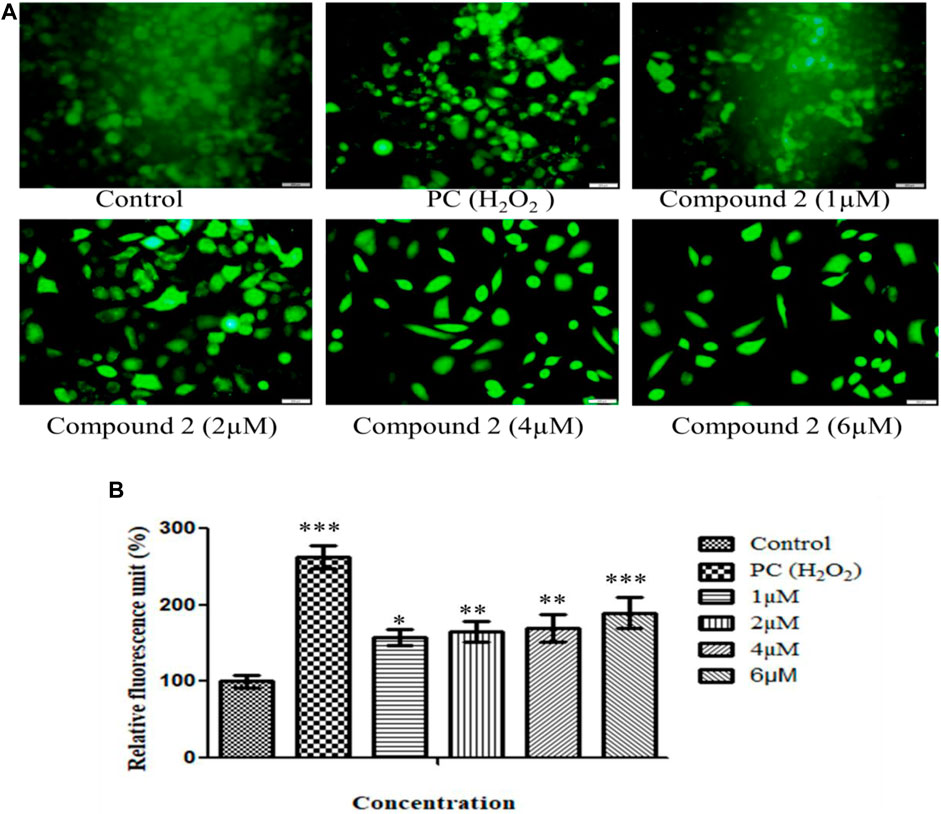
FIGURE 6. (A) Intracellular ROS production induced by compound 2 in A-549 cells: The cells were cultured for 48 h in the presence of 10% FBS. At 24 h, cells were treated with different concentrations (1, 2, 4, and 6 µM) of compound 2. H2O2 was taken as a positive control (0.05%). At 48 h, cells were stained with DCFDA dye, and ROS levels were measured using Olympus IX53. Fluorescence at each time point was normalized to untreated control cells; (B) Representative histograms showing fluorescence changes in A-549 cells after treatment with various concentrations of compound 2 as determined by the Olympus IX53 microscope. Fluorescent data normalized to positive control showing the average of three experiments. Data are expressed as mean ± S.D. The statistical significance of data was determined by one-way analysis of variance (ANOVA) (*p < 0.05, **p < 0.01, and ***p < 0.001).
3.2.4 Compound 2 lowers mitochondrial membrane potential
The loss of mitochondrial membrane permeability and release of cytoplasmic apoptogenic stimuli leads to MMP loss and eventually causes cell death (Gottlieb et al., 2003). A fluorescent dye, rhodamine-123, was used to analyze the change in MMP. An Olympus IX53 imaging microscope monitored the quenching of fluorescence. The loss of mitochondrial membrane integrity is directly related to the fluorescence decay rate. The mitochondrial membrane destabilization causes leakage of rhodamine-123, which in turn lowers the fluorescence intensity (Kumar et al., 2016). After treatment with various concentrations (1, 2, 4, and 6 µM) of compound 2 and camptothecin (0.25 µM), A-549 cells showed a significant reduction in MMP. Camptothecin was used as a positive control. Compound 2 induces the depolarization of mitochondrial membrane potential (low ∆Ψmt) in a concentration-dependent manner. Green signal cells were quantified using ImageJ software and presented in the histogram (Figures 7A, B).
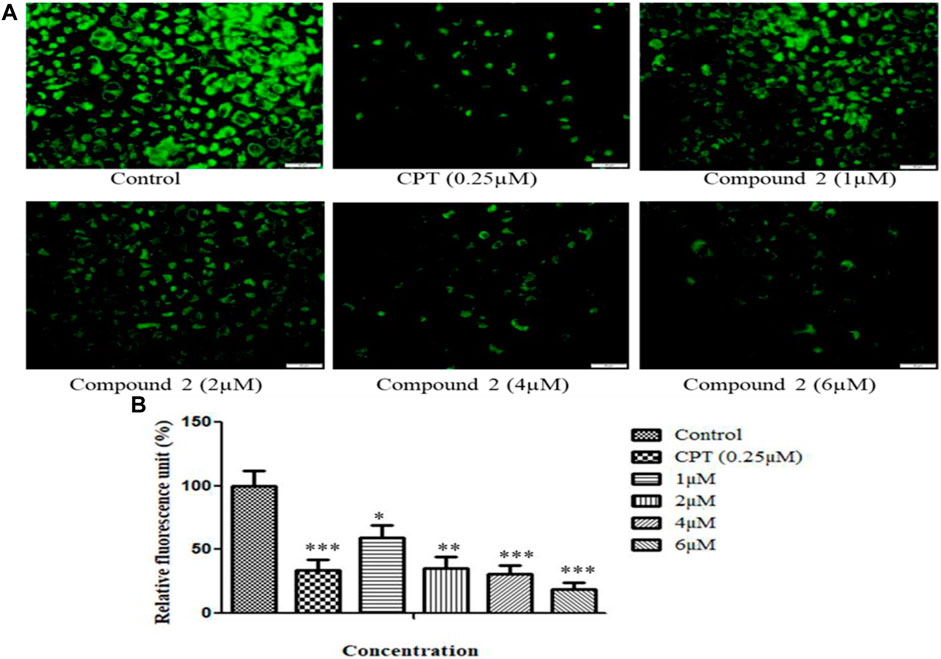
FIGURE 7. (A) Loss of mitochondrial membrane permeability induced by compound 2 in A-549 cells. The cells were cultured for 48 h in the presence of 10% FBS. At 24 h, cells were treated with different concentrations (1, 2, 4, and 6 µM) of compound 2. Camptothecin was used as a positive control. At 48 h, cells were stained with Rhodamine-123, and loss of MMP was quantified using an Olympus IX53 microscope. Fluorescence at each time point was normalized to untreated control cells. (B) Representative histograms showed fluorescence changes in A-549 cells after treatment with various concentrations of compound 2 as determined by the Olympus IX53 microscope. Fluorescent data were normalized to the positive control, showing the average of three experiments. Data are expressed as mean ± S.D. The statistical significance of data was determined by one-way analysis of variance (ANOVA) (*p < 0.05, **p < 0.01, and ***p < 0.001).
3.2.5 Compound 2 inhibited in vitro cell migration during wound healing assay in A-549 cells
In this experiment, A-549 cell monolayers were scratched and treated with different concentrations of Compound 2, i.e., 1, 2, 4, and 6 µM for 48 h. Images were taken at 0 and 48 h to quantitatively assess the percentage reduction in cell migration (Rodriguez et al., 2005). It was observed that inhibition of cell migration took place in a concentration-dependent manner as compared to the control. This indicates the potential of Compound 2 to retard cancer cell growth (Figure 8).
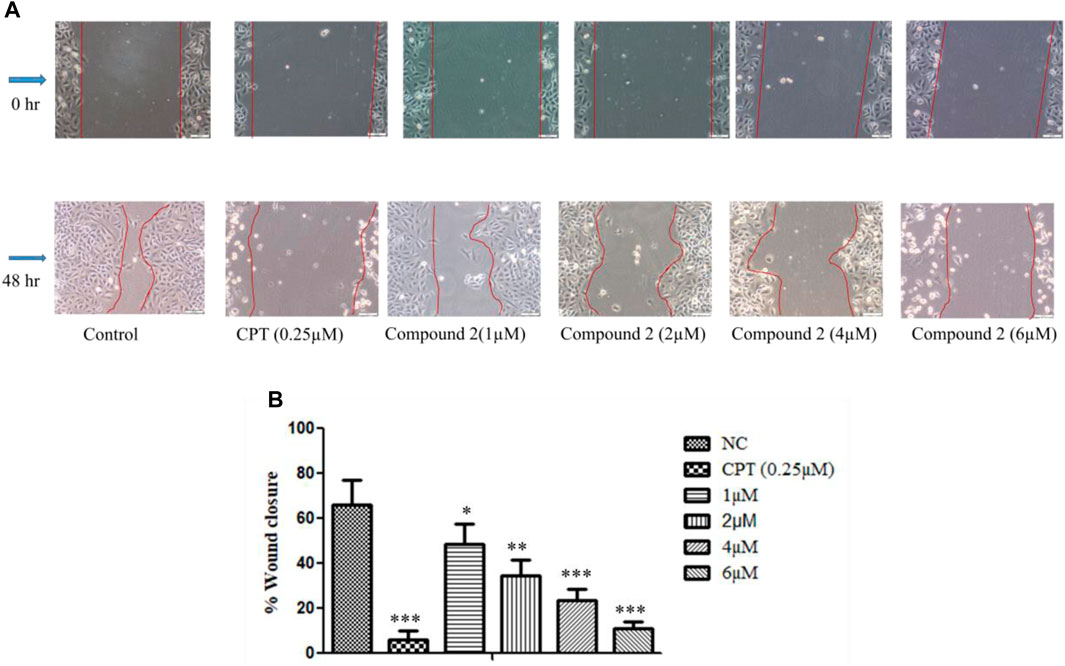
FIGURE 8. In vitro wound healing assay. (A) A-549 cells treated with Compound 2 for 48 h reduced the migration of the cell as the concentration of the compound was increased. (B) Wound closure area with control using ImageJ software. Data are expressed as mean ± S.D. The statistical significance of data was determined by one-way analysis of variance (ANOVA) (*p < 0.05, **p < 0.01, and ***p < 0.001).
3.2.6 Compound 2 inhibited cell proliferation during colony formation assay in lung cancer cells (A-549)
The cells’ proliferation capabilities (the potential of a single cell to grow into a colony) were measured by an in vitro clonogenic assay (Munshi et al., 2005). A-549 cells were seeded in a 6-well flat transparent well plate and treated with 1, 2, 4, and 6 µM concentrations of Compound 2. Compound 2 significantly inhibited colony formation in A-549 cells as the concentration increased along with the inhibition effect (Figure 9).
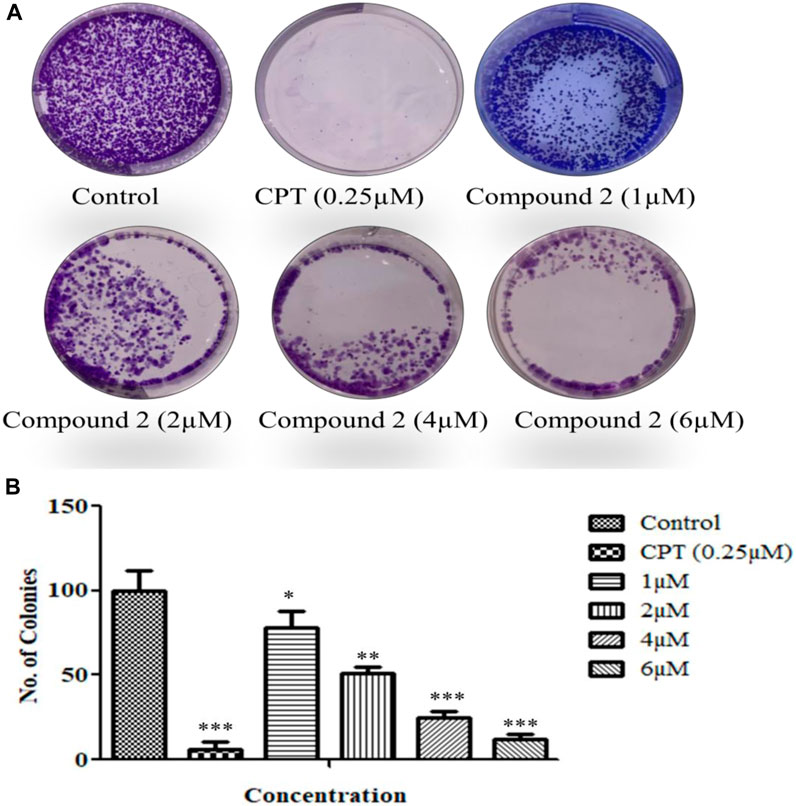
FIGURE 9. (A) A colony formation assay was performed over A-549 cells. (B) The number of colonies was counted and plotted as a bar graph. Camptothecin (0.25 µM) was used as a positive control. Data are expressed as mean ± S.D. The statistical significance of data was determined by one-way analysis of variance (ANOVA) (*p < 0.05, **p < 0.01, and ***p < 0.001).
3.2.7 Western blotting
We observed a dose-dependent reduction in mitochondrial membrane potential after treatment with Compound 2, accompanied by a significant elevation in intracellular ROS levels in A-549 cells compared to untreated cells. Furthermore, we noted higher levels of apoptotic body formation and chromatin condensation in treated A-549 cells in a concentration-dependent manner relative to untreated cells. These morphological alterations signify that the treatment of A-549 cells with Compound 2 induces a substantial increase in apoptotic body formation in a concentration-dependent manner, underscoring its anti-proliferative effect. For the analysis of programmed cell death (apoptosis) induction by Compound 2 in A-549 cells, Western blotting was conducted with BCL-2, BAX, and cleaved caspase-3. BCL-2 serves as an anti-apoptotic marker, while BAX and cleaved caspase-3 are pro-apoptotic. We observed a dose-dependent increase in the expression of BAX and a corresponding decrease in the expression of BCL-2 in response to Compound 2 in the A549 cell line. The typical Western blot images of BAX and BCL-2 are presented in Figure 10.
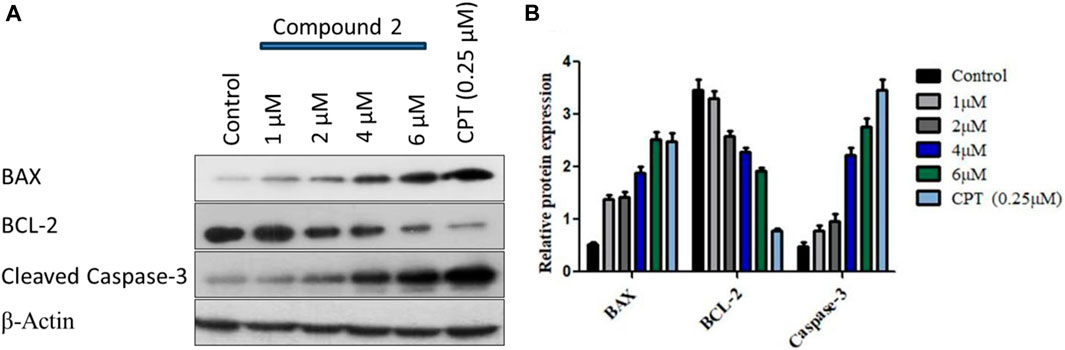
FIGURE 10. (A) Immunoblot depiction of BAX, BCL-2, and cleaved caspase-3 in A-549 cells by Compound 2 for 48 h (B) represents the densitometric Western blot analysis. Data were calculated from 3 independent experiments with p < 0.05.
Subsequently, the activation of caspase-3 was assessed by monitoring procaspase-3 cleavage through Western blotting. The blot, displayed in Figure 10 (3rd panel from the upper side), illustrates a clear augmentation in procaspase-3 cleavage with increasing doses of Compound 2. The expression levels of BCL-2, BAX, and procaspase-3 were quantified for each dose using ImageJ software, and the relative expressions, along with standard deviations, were calculated and plotted in Figure 10B using GraphPad Prism. β-Actin served as the loading control. This data suggests that Compound 2 induces the activation of caspase-3 after the cleavage of pro-caspase-3, establishing a dose-dependent activation of caspase-3 in A-549 cells.
4 Conclusion
Over the past years, T. govanianum has gained the attention of researchers because of very little exploration of its phytochemistry and pharmacological studies, especially in cancer research. In the present study, we isolated and characterized two new steroidal saponins from the rhizomes of T. govanianum. Compounds 1 and 2 exhibited significant cytotoxic activity against human lung and colon cancer cell lines in a considerable micromolar range. Trilliumoside K (1) showed significant cytotoxicity with IC50 values of 1.83 and 1.85 µM on A-549 (Lung) and SW-620 (Colon) cell lines, whereas the IC50 value against the A-549 cell line of trilliumoside L (2) was found to be 1.79 µM. Mechanistic anti-cancer assays were performed on Compound 2, revealing noteworthy changes such as MMP reduction, increase in ROS production, inhibition of anti-apoptotic protein BCL-2, and activation of BAX and caspase-3. Compound 2 showed cellular anti-proliferative activity in A-549 cancer cells. A-549 is identified as a sensitive cell line in in vitro cytotoxicity assays, with a safety ratio of ∼6 (IC50 against fR2 normal cell line versus IC50 in A549 cancer cell line). All these changes were responsible for the induction of apoptosis in the A-549 cancer cell line, laying the foundation of Compound 2 as a lead molecule in anti-cancer drug discovery.
Data availability statement
The datasets presented in this study can be found in online repositories. The names of the repository/repositories and accession number(s) can be found in the article/Supplementary Material.
Ethics statement
Ethical approval was not required for the studies on animals in accordance with the local legislation and institutional requirements because only commercially available established cell lines were used.
Author contributions
BL: Conceptualization, Investigation, Writing–original draft. MT: Investigation, Formal Analysis, Methodology, Writing–review and editing. AB: Writing–review and editing. DR: Writing–review and editing. UD: Visualization, Writing–review and editing. AA: Writing–review and editing. HM: Writing–review and editing. PNG: Formal Analysis, Writing–review and editing. DM: Writing–review and editing. SG: Plant Collection and Authentication of Plant Material. PSG: Conceptualization, Supervision, Writing–original draft.
Funding
The author(s) declare financial support was received for the research, authorship, and/or publication of this article. This work was supported by the Indian Council of Medical Research (ICMR Grant No. 45/23/2022/TRM/BMS), New Delhi, and partial support from SERB, New Delhi (Grant No. EMR/2016/002584) and Researchers supporting project (RSP2023R350), King Saud University, Riyadh, Saudi Arabia.
Acknowledgments
The authors are thankful to the Director CSIR-IIIM for his interest in this research work. BL (ICMR), MT (UGC), AB (CSIR), DR (UGC), UD (CSIR), PSG, DM, and PNG (CSIR) thankfully acknowledge the financial support in the form of research fellowships. The authors would also like to extend their sincere appreciation to the Researchers Supporting Project Number (RSP2023R350), King Saud University, Riyadh, Saudi Arabia.
Conflict of interest
The authors declare that the research was conducted in the absence of any commercial or financial relationships that could be construed as a potential conflict of interest.
Publisher’s note
All claims expressed in this article are solely those of the authors and do not necessarily represent those of their affiliated organizations, or those of the publisher, the editors and the reviewers. Any product that may be evaluated in this article, or claim that may be made by its manufacturer, is not guaranteed or endorsed by the publisher.
Supplementary material
The Supplementary Material for this article can be found online at: https://www.frontiersin.org/articles/10.3389/fchem.2023.1306271/full#supplementary-material
References
Abdel-Sattar, E., Shabana, M. M., and El-Mekkawy, S. (2008). Protodioscin and pseudoprotodioscin from Solanum intrusum. Res. J. Phytochem. 2, 100–105. doi:10.3923/rjphyto.2008.100.105
Beniwal, M., Jain, N., Jain, S., and Aggarwal, N. (2022). Design, synthesis, anti-cancer evaluation and docking studies of novel 2-(1-isonicotinoyl-3-phenyl-1H-pyrazol-4-yl)-3-phenylthiazolidin-4-one derivatives as Aurora-A kinase inhibitors. BMC Chem. 16 (1), 61–17. doi:10.1186/s13065-022-00852-8
Biancardi, A., Biver, T., Secco, F., and Mennucci, B. (2013). An investigation of the photophysical properties of minor groove bound and intercalated DAPI through quantum-mechanical and spectroscopic tools. Phys. Chem. Chem. Phys. 15, 4596–4603. doi:10.1039/C3CP44058C
Braca, A., Prieto, J. M., De Tommasi, N., Tomè, F., and Morelli, I. (2004). Furostanol saponins and quercetin glycosides from the leaves of Helleborus viridis L. Phytochem 65, 2921–2928. doi:10.1016/j.phytochem.2004.07.013
Chai, J., Song, X., Wang, X., Mei, Q., Li, Z., Cui, J., et al. (2014). Two new compounds from the roots and rhizomes of Trillium tschonoskii. Phytochem. Lett. 10, 113–117. doi:10.1016/j.phytol.2014.08.010
Chauhan, H. K., Bisht, A. K., Bhatt, I. D., Bhatt, A., and Gallacher, D. (2019). Trillium-toward sustainable utilization of a biologically distinct genus valued for traditional medicine. Bot. Rev. 85, 252–272. doi:10.1007/s12229-019-09211-0
Desai, A. G., Qazi, G. N., Ganju, R. K., El-Tamer, M., Singh, J., Saxena, A. K., et al. (2008). Medicinal plants and cancer chemoprevention. Curr. Drug Metab. 9, 581–591. doi:10.2174/138920008785821657
Elmore, S. (2007). Apoptosis: a review of programmed cell death. Toxicol. Pathol. 35, 495–516. doi:10.1080/01926230701320337
Eskander, J., Sakka, O. K., Harakat, D., and Lavaud, C. (2013). Steroidal saponins from the leaves of Yucca de-smetiana and their in vitro antitumor activity: structure activity relationships through a molecular modeling approach. Med. Chem. Res. 22, 4877–4885. doi:10.1007/s00044-013-0497-4
Gao, X., Sun, W., Fu, Q., and Niu, X. (2015). Rapid identification of steroidal saponins in Trillium tschonoskii maxim by ultraperformance liquid chromatography coupled to electrospray ionisation quadrupole time-of-flight tandem mass spectrometry. Phytochem. Anal. 26 (4), 269–278. doi:10.1002/pca.2560
Gottlieb, E., Armour, S. M., Harris, M. H., and Thompson, C. B. (2003). Mitochondrial membrane potential regulates matrix configuration and cytochrome c release during apoptosis. Cell Death Differ. 10, 709–717. doi:10.1038/sj.cdd.4401231
Gupta, N., Rath, S. K., Singh, J., Qayum, A., Singh, S., and Sangwan, P. L. (2017a). Synthesis of novel benzylidene analogues of betulinic acid as potent cytotoxic agents. Eur. J. Med. Chem. 135, 517–530. doi:10.1016/j.ejmech.2017.04.062
Gupta, N., Sharma, S., Raina, A., Bhushan, S., Malik, F. A., and Sangwan, P. L. (2017b). Synthesis of novel Mannich derivatives of Bakuchiol as apoptotic inducer through caspase activation and PARP-1 cleavage in A549 cells. ChemistrySelect 2, 5196–5201. doi:10.1002/slct.201700504
Hayes, P. Y., Lehmann, R., Penman, K., Kitching, W., and De.Voss, J. J. (2009). Steroidal saponins from the roots of Trillium erectum (Beth root). Phytochemistry 70 (1), 105–113. doi:10.1016/j.phytochem.2008.10.019
Huang, W., and Zou, K. (2011). Cytotoxicity of a plant steroidal saponin on human lung cancer cells. Asian pac. J. Cancer Prev. 12 (2), 513–517.
Ismail, M., Shah, M. R., Adhikari, A., Anis, I., Ahmad, M. S., Khurram, M., et al. (2015). Govanoside A, a new steroidal saponin from rhizomes of Trillium govanianum. Steroids 104, 270–275. doi:10.1016/j.steroids.2015.10.013
Ju, Y., and Jia, Z. J. (1992). Steroidal saponins from the rhizomes of Smilax menispermoidea. Phytochem 31, 1349–1351. doi:10.1016/0031-9422(92)80288-P
Kumar, A., Singh, B., Sharma, P. R., Bharate, S. B., Saxena, A. K., and Mondhe, D. M. (2016). A novel microtubule depolymerizing colchicine analogue triggers apoptosis and autophagy in HCT-116 colon cancer cells. Cell biochem. Funct. 34, 69–81. doi:10.1002/cbf.3166
Kumar, D., Aggarwal, N., Deep, A., Kumar, H., Chopra, H., Marwaha, R. K., et al. (2023). An understanding of mechanism-based Approaches for 1, 3, 4-oxadiazole Scaffolds as cytotoxic agents and Enzyme inhibitors. Pharmaceuticals 16 (2), 254. doi:10.3390/ph16020254
Li, Y., Fan, L., Sun, Y., Miao, X., Zhang, F., Meng, J., et al. (2014). Paris saponin VII from Trillium tschonoskii reverses multidrug resistance of adriamycin-resistant MCF-7/ADR cells via P-glycoprotein inhibition and apoptosis augmentation. J. Ethnopharmacol. 154 (3), 728–734. doi:10.1016/j.jep.2014.04.049
Love, J., and Simons, C. R. (2020). Acid hydrolysis of saponins extracted in tincture. PloS one 15, e0244654. doi:10.1371/journal.pone.0244654
Majeed, R., Hamid, A., Sangwan, P. L., Chinthakindi, P. K., Koul, S., Rayees, S., et al. (2014). Inhibition of phosphotidylinositol-3 kinase pathway by a novel naphthol derivative of betulinic acid induces cell cycle arrest and apoptosis in cancer cells of different origin. Cell Death Dis. 5, e1459. doi:10.1038/cddis.2014.387
Mimaki, Y., Aoki, T., Jitsuno, M., Kiliç, C. S., and Coşkun, M. (2008). Steroidal glycosides from the rhizomes of Ruscus hypophyllum. Phytochem 69, 729–737. doi:10.1016/j.phytochem.2007.09.022
Mimaki, Y., and Watanabe, K. (2008). Clintoniosides A–C, new polyhydroxylated spirostanol glycosides from the rhizomes of Clintonia udensis. Helv. Chim. Acta. 91, 2097–2106. doi:10.1002/hlca.200890224
Munshi, A., Hobbs, M., and Meyn, R. E. (2005). Clonogenic cell survival assay. Chemosensitivity Methods Mol. Med. 110, 021–028. Humana Press. doi:10.1385/1-59259-869-2:021
Ohara, M., and Kawano, S. (2005). Life-history monographs of Japanese plants. 2: Trillium camschatcense ker-gawl (trilliaceae). Plant Species Biol. 20, 75–82. doi:10.1111/j.1442-1984.2005.00126.x
Ono, M., Hamada, T., and Nohara, T. (1986). An 18-norspirostanol glycoside from Trillium tschonoskii. Phytochemistry 25, 544–545. doi:10.1016/S0031-9422(00)85524-7
Pant, S., and Samant, S. S., 2010. Ethnobotanical observations in the Mornaula reserve forest of Komoun, West Himalaya, India. Ethnobot. Leafl. 8. Available at: https://opensiuc.lib.siu.edu/ebl/vol2010/iss2/8.
Pathania, A. S., Wani, Z. A., Guru, S. K., Kumar, S., Bhushan, S., Korkaya, H., et al. (2015). The anti-angiogenic and cytotoxic effects of the boswellic acid analog BA145 are potentiated by autophagy inhibitors. Mol. Cancer. 14, 6–15. doi:10.1186/1476-4598-14-6
Perillo, B., Di Donato, M., Pezone, A., Di Zazzo, E., Giovannelli, P., Galasso, G., et al. (2020). ROS in cancer therapy: the bright side of the moon. Exp. Mol. Med. 52, 192–203. doi:10.1038/s12276-020-0384-2
Rani, S., Rana, J. C., and Rana, P. K. (2013). Ethnomedicinal plants of Chamba district, Himachal Pradesh, India. J. Med. Plant Res. 7, 3147–3157. doi:10.5897/JMPR2013.5249
Rodriguez, L. G., Wu, X., and Guan, J. L. (2005). Wound-healing assay. Cell Migr. Dev. Methods Protoc. 294, 023–029. Humana Press. doi:10.1385/1-59259-860-9:023
Sharma, O. R., Arya, D., Goel, S., Vyas, K., and Shinde, P. (2018). Trillium govanianum Wall. ex D. Don (Nagchatri): an important ethnomedicinal plant of Himalayan region (Himachal Pradesh). J. Med. Plants Stud. 6, 11–13. ISSN (E): 2320-3862.
Sharma, P., and Samant, S. (2104). Diversity distribution and indigenous uses of medicinal plants in Parbati valley of Kullu district in Himachal Pradesh, North-western Himalaya, Asian. J. Adv. Basic Sci. 2, 77–98. Available at: https://www.jmbm.in/index.php/jmbas/article/view/6.
Singh, P. P., Suresh, P. S., Bora, P. S., Bhatt, V., and Sharma, U. (2021). Govanoside B, a new steroidal saponin from rhizomes of Trillium govanianum. Nat. Prod. Res. 36, 37–45. doi:10.1080/14786419.2020.1761360
Sofi, I. I., Verma, S., Charles, B., Ganie, A. H., Sharma, N., and Shah, M. A. (2022). Predicting distribution and range dynamics of Trillium govanianum under climate change and growing human footprint for targeted conservation. Plant Ecol. 223, 53–69. doi:10.1007/s11258-021-01189-3
Tan, G., Gyllenhaal, C., and Soejarto, D. D. (2006). Biodiversity as a source of anti-cancer drugs. Curr. drug targets 7 (3), 265–277. doi:10.2174/138945006776054942
Ur Rahman, S., Ismail, M., Khurram, M., Ullah, I., Rabbi, F., and Iriti, M. (2017). Bioactive steroids and saponins of the genus Trillium. Molecules 22, 2156. doi:10.3390/molecules22122156
Vichai, V., and Kirtikara, K. (2006). Sulforhodamine B colorimetric assay for cytotoxicity screening. Nat. Protoc. 1, 1112–1116. doi:10.1038/nprot.2006.179
Wang, Y. L., Yang, Y. Y., and Wang, S., 2018. Steroidal saponins from Paris polyphylla var. yunnanensis and their cytotoxic activities. Steroids, 133, 1–7.
Yan, L. L., Zhang, Y. J., Gao, W. Y., Man, S. L., and Wang, Y. (2009). In vitro and in vivo anti-cancer activity of steroid saponins of Paris polyphylla var. yunnanensis. Exp. Oncol. 31, 27–32. Available at: http://dspace.nbuv.gov.ua/handle/123456789/135101.
Yan, T., Wang, A., Hu, G., and Jia, J. (2021). Chemical constituents of Trillium tschonoskii maxim. Nat. Prod. Res. 35, 3351–3359. doi:10.1080/14786419.2019.1700245
Ya-Zheng, Z. H. A. O., Yuan-Yuan Zhang, H. A. N., Han, F. A. N., Rui-Ping, H. U., YangLiang Zhong, K. O. U., Jun-Ping, K. O. U., et al. (2018). Advances in the antitumor activities and mechanisms of action of steroidal saponins. Chin. J. Nat. Med. 16, 732–748. doi:10.1016/S1875-5364(18)30113-4
Yokosuka, A., and Mimaki, Y. (2008a). Steroidal glycosides from the underground parts of Trillium erectum and their cytotoxic activity. Phytochem 69, 2724–2730. doi:10.1016/j.phytochem.2008.08.004
Yokosuka, A., and Mimaki, Y. (2008b). Steroidal glycosides from the underground parts of Trillium erectum and their cytotoxic activity. Phytochemistry 69 (15), 2724–2730. doi:10.1016/j.phytochem.2008.08.004
Keywords: Trillium govanianum, saponins, steroidal glycosides, A-549, BAX, BCL-2, cytotoxicity
Citation: Lone BA, Tabassum M, Bhushan A, Rani D, Dhiman U, Ahmad A, Mir HA, Gupta PN, Mondhe DM, Gairola S and Gupta P (2023) Trilliumosides K and L, two novel steroidal saponins from rhizomes of Trillium govanianum, as potent anti-cancer agents targeting apoptosis in the A-549 cancer cell line. Front. Chem. 11:1306271. doi: 10.3389/fchem.2023.1306271
Received: 03 October 2023; Accepted: 24 November 2023;
Published: 22 December 2023.
Edited by:
Cleydson Breno Rodrigues dos Santos, Universidade Federal do Amapá, BrazilReviewed by:
Essa M. Saied, Humboldt University of Berlin, GermanyNavidha Aggarwal, Maharishi Markandeshwar University, Mullana, India
Copyright © 2023 Lone, Tabassum, Bhushan, Rani, Dhiman, Ahmad, Mir, Gupta, Mondhe, Gairola and Gupta. This is an open-access article distributed under the terms of the Creative Commons Attribution License (CC BY). The use, distribution or reproduction in other forums is permitted, provided the original author(s) and the copyright owner(s) are credited and that the original publication in this journal is cited, in accordance with accepted academic practice. No use, distribution or reproduction is permitted which does not comply with these terms.
*Correspondence: Prasoon Gupta, guptap@iiim.ac.in
†These authors have contributed equally to this work