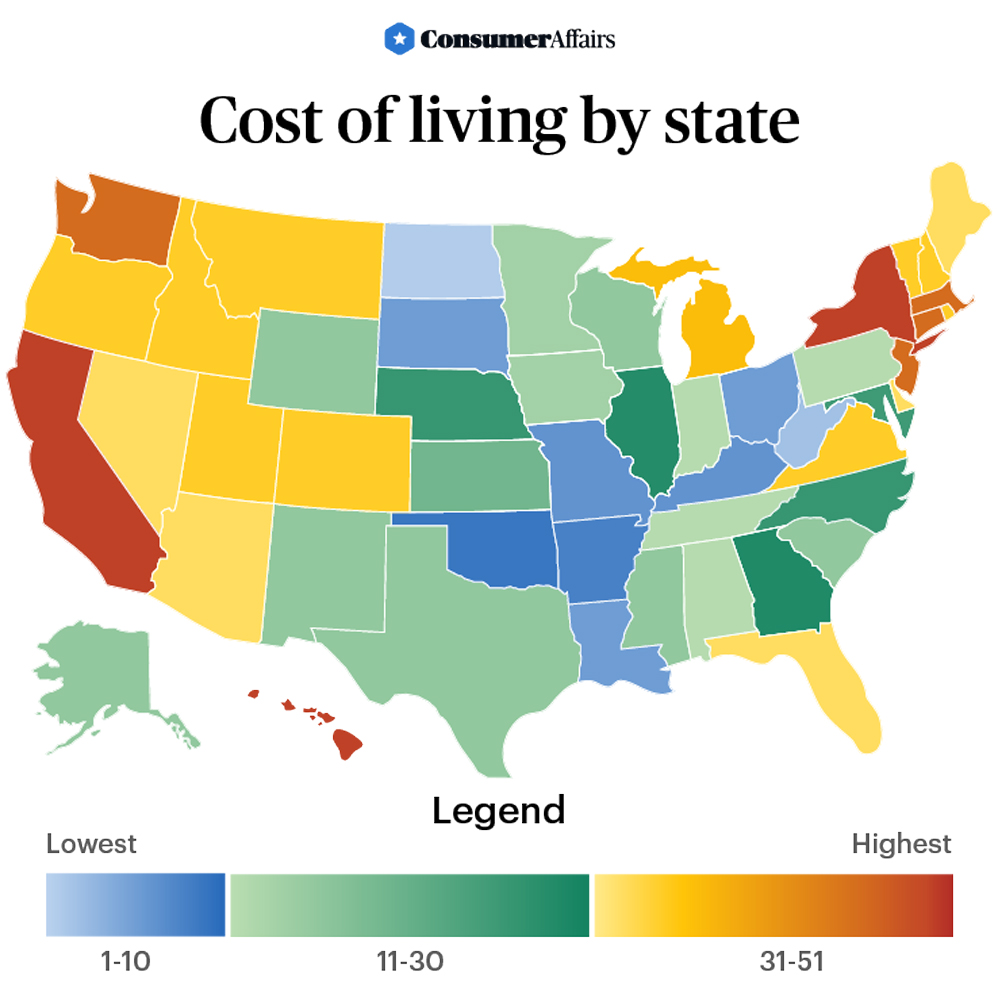
The 10 states with the lowest cost of living
New year, same old money worries — now cranked up a notch, thanks to economists’ widespread expectations of a recession in 2023. Add in high inflation, corporate layoffs and an unforgiving housing market, and it seems likely that money will continue to be tight for most of us, wherever we live.
The good news is that some places truly are much cheaper and less pressure-packed, financially speaking. For those who need the relief, or those who post-pandemic can now work their same job remotely, moving states may be worth it. In fact, in a recent survey of American adults, we found that more than one-third (35%) say that their current cost of living could cause them to move to a different state.
To zero in on the states where people can best get their finances under control, ConsumerAffairs crunched numbers on housing and rental costs; utility, food and gas prices; and tax rates, using data from nine authoritative industry and government sources. (We bypassed The Council for Community and Economic Research’s commonly cited Cost of Living Index because it doesn’t account for the burden of state and local taxes.)
Key insights:
- North Dakota is the most affordable state, followed by West Virginia and Michigan.
- Hawaii is the most expensive state; California and New York are runners-up.
- The 10 most affordable states are clustered in the Midwest, the Appalachian region and the South.
- The states with the best utility prices are all on the Canadian border: Maine, Idaho, Vermont, Montana and North Dakota. Most are mountainous, enabling widespread use of solar, wind, hydro and geothermal energy.
- Michigan employees pay the fewest dollars per year for their job-based health insurance premiums, while North Carolina employees pay the most. Michiganders also pay the smallest share of total premiums (20.2%), while Oklahoma employees pay the highest share (35.9%). The national average is 28.9%.
- Coastal states cost more: Almost all of our priciest places have beaches. New England and states bordering the Pacific Ocean dominate this group.
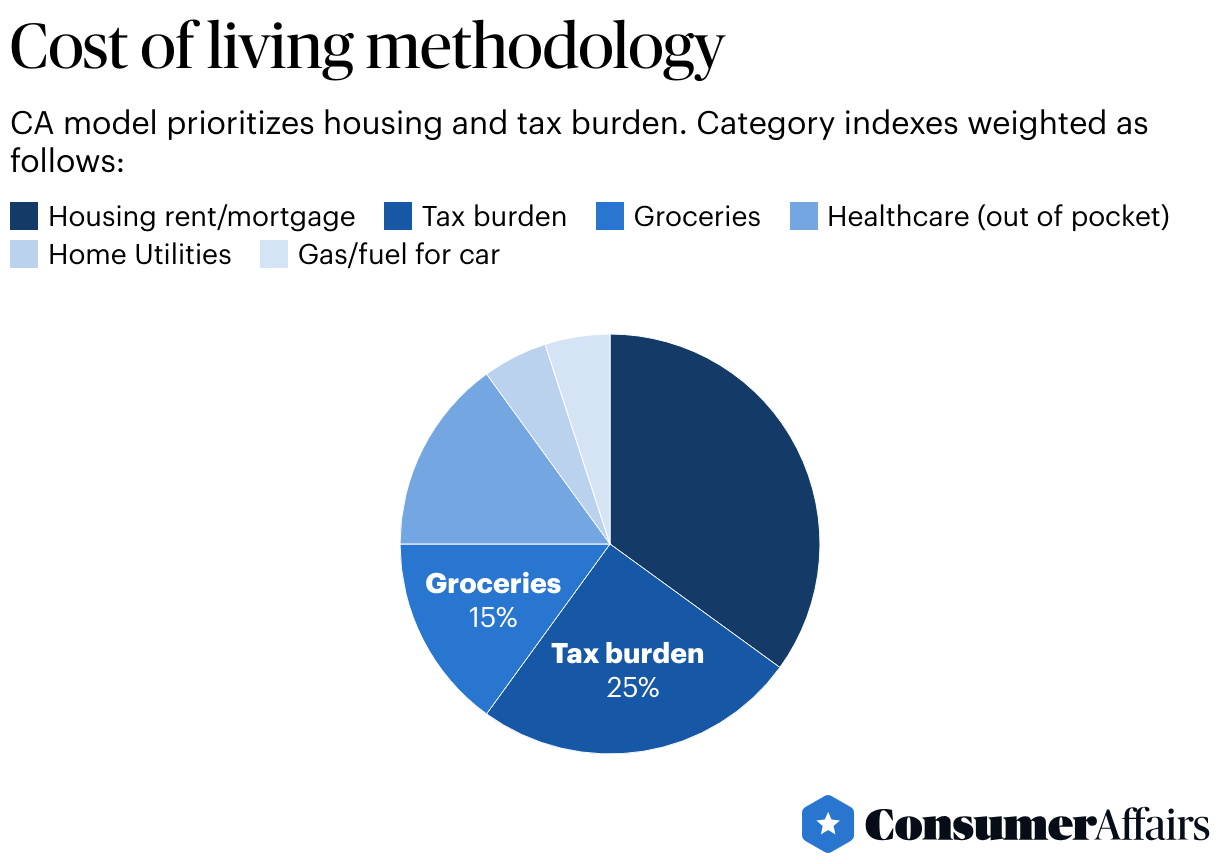
Methodology: To determine which states have the lowest cost of living, the ConsumerAffairs Research Team looked at six main cost factors: housing, taxes, groceries, out-of-pocket health care expenditures, gas and home utilities. Each factor was indexed against the maximum value among all 50 states and assigned a weight. States with the lowest scores have the lowest cost of living.
The 10 states that offer the biggest bang for your buck
The 10 lowest-cost-of-living states are located in three areas of the country: the Midwest, the Appalachian region and the South.
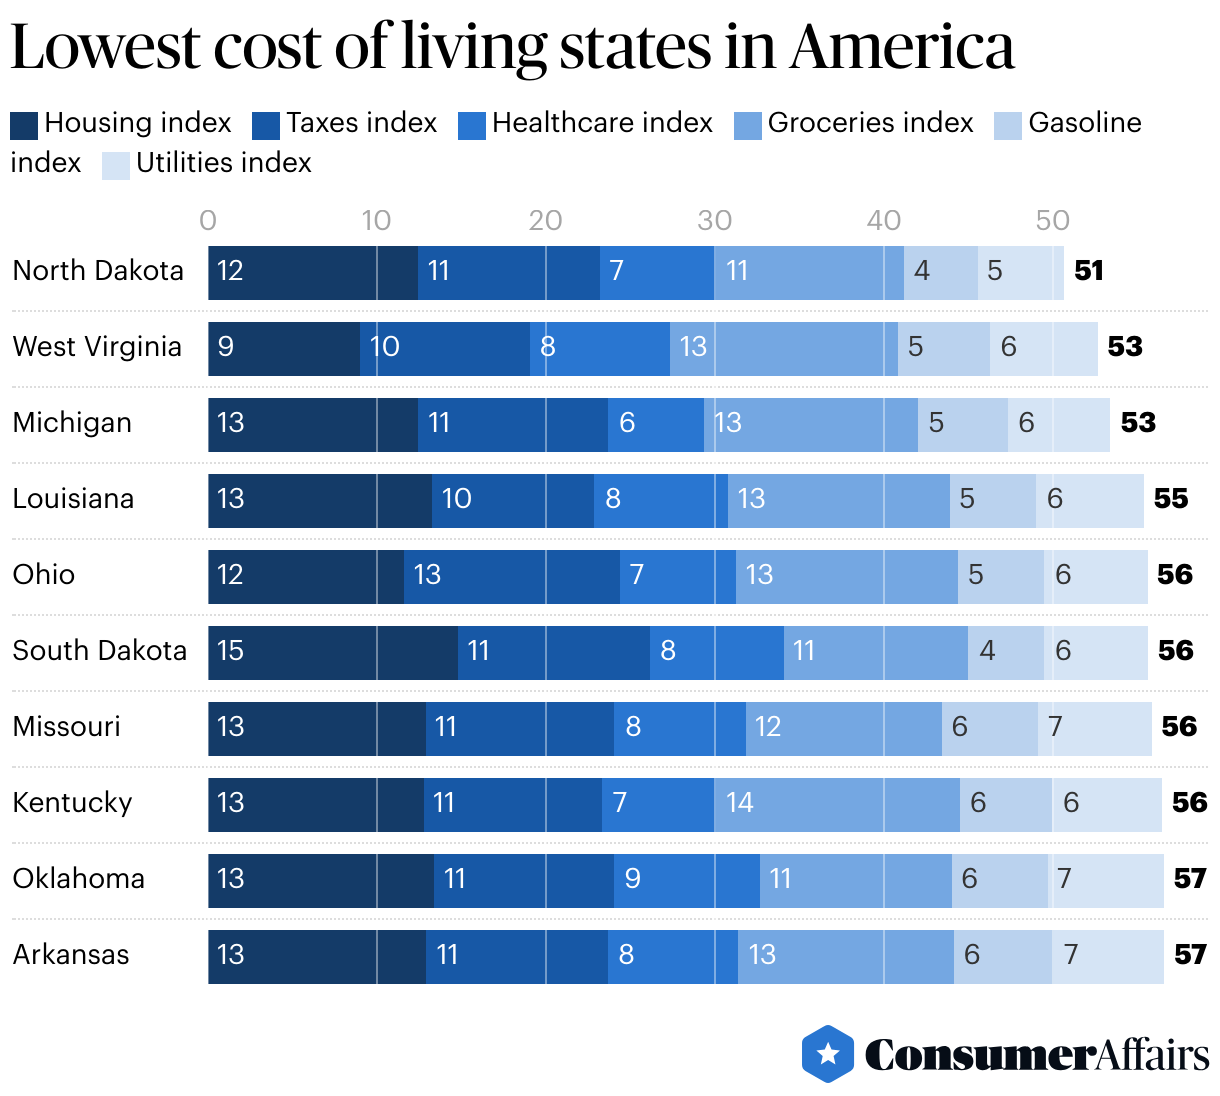
Notes: Each factor has an index number for a state. This is a ratio that compares the state's value in the series to the maximum value in the series. States with the 10 lowest totals are the 10 lowest-cost states. Each ratio was multiplied by 100 for scoring purposes.
North Dakota
Low-cost housing, groceries, gas and utilities powerfully propelled North Dakota into our top spot. Its status as one of the nation’s leading crude oil producers helps keep gasoline and home utility prices low. State and local taxes are also low, ranking ninth-best in the nation. Out-of-pocket health care costs may be a sticking point, however — they make up about 20% of per-capita consumption expenses.
West Virginia
In second place, West Virginia is a housing haven. It has the lowest median prices for both homebuying and renting; both cost roughly one-fourth as much as in Hawaii, our highest-price state. It also ranks in the top five nationally for its low state and local tax burden. All these are undeniable pluses — but bear in mind that West Virginia’s grocery prices are steep and its health care score is second-lowest in the nation, reflecting high premiums for employer insurance.
Michigan
Michigan has the country’s most affordable health care, judging from its low premiums on job-based insurance. General health care-related expenses make up 16.1% of Michiganders’ monthly outlays, slightly less than the national average of 16.25%. Also attractive: Housing costs are low (but so is supply now — the market has become competitive). All that, plus a better-than-average state and local tax burden (8.6% versus a national average of 10.58%), landed the state in our No. 3 spot.
Louisiana
Extremely low property taxes and a median home listing price of roughly $283,500 (11th lowest in the nation) were Louisiana’s ticket to our top 10. Those expecting to need lots of medical care, though, may have second thoughts about the Pelican State, since its health care costs are the eighth-highest in our ranking.
Ohio
Ohio made our top 10 because of its low listing prices for homes and moderate rents. Below-average property taxes are a plus. Given middling costs in other categories, money saved on housing shouldn’t all be gobbled up by health care, groceries, gas and utility expenses.
South Dakota
Like its northern sibling, South Dakota enjoys comparatively cheap groceries and gasoline, but housing is slightly more expensive. Effective state and local tax rates are slightly lower than in North Dakota — two percentage points lower than the average across all states.
Missouri
The Show-Me State is the eighth-best in the nation for housing costs — and the eighth-worst for gas and utility costs. Moderate state and local taxes and reasonable food prices help Missouri residents live affordably.
Kentucky
Ranking sixth for both housing and taxes, Kentucky can be a bargain for big expenses. Its food prices, however, consume 9.1% of monthly expenditures, rendering the state’s grocery bills second-highest in the nation — bad news if you eat like a horse.
Oklahoma
Because it ranks in the top 10 states for both low taxes and affordable groceries, Oklahoma makes our list of the top 10 overall. Its main drawback, by our reckoning, is its budget-busting health care (ranked last in the nation). The Commonwealth Fund estimates that in 2021, 14.4% of adults in the state went without care because of cost — over four percentage points higher than the national average of 10%.
Arkansas
This state’s housing prices and tax rates both rank in the top 10. However, Arkansas’ weak spot is the large monthly budget bite taken by gasoline and other energy costs. According to Bureau of Economic Analysis (BEA) estimates, these costs consume almost 3.8% of a resident’s monthly expenditures, more than one-and-a-half times the national average.
Housing costs
Housing is at the top of our list of affordability factors. It’s the biggest monthly expense for most people. On average, 33.8% of Americans’ spending goes toward housing costs, according to 2021 data from the U.S. Bureau of Labor Statistics Consumer Expenditures Survey.
About 63% of our survey respondents say they currently own a home; roughly 23.7% report they never have. Some fear they’ll never be homeowners.
Rents aren’t always considered when making real estate cost comparisons. That gives a skewed view; according to iPropertyManagement, 41 states have at least 30% of their population living in rentals. We gave each state its due by incorporating the owner/renter split in our calculations.
Our survey also showed that many Americans never expect to own a home. One North Carolina woman explained, “I have lived in large metro areas most of my life, where owning a home is quite expensive.” From a Colorado resident: “[The] cost of living in Colorado is outrageous. Rent is too expensive and so are the homes. Even people in the middle class struggle a lot.”
“I will never afford a house here even with [an] engineering salary,” said a 23-year-old man living in Boston. “[I’m] going to move eventually.”
Buying
Realtor.com data indicate that the lowest median listing price for homes is in West Virginia, where it’s $220,000. That’s roughly one-quarter of the median listing price in Hawaii, the most expensive state for housing. Median home listing prices in Ohio ($225,000) and Michigan (roughly $265,000) are well under one-third of Hawaii’s $850,000 median price.
States with lowest median home prices, October 2022
| State | Median listing price |
|---|---|
| West Virginia | $220,000 |
| Ohio | $225,000 |
| Michigan | $264,900 |
Perhaps that’s why West Virginia, our most affordable state overall, is also the state with the highest share of homeowners. They outnumber tenants by almost 3 to 1. Michigan has the second-highest share of homeowners (72%).
As for price per square foot, West Virginia’s median price is the nation’s lowest, at $120, followed by Ohio and Mississippi (both $131).
Renting
Newcomers to a state often decide to rent a place while they get to know the area. Others rent because the housing market is too sparse or too pricey, or simply because they’re not financially ready to buy.
Tenants pay the lowest rents in West Virginia ($595), North Dakota ($855) and Iowa ($935), according to data from Apartment List and the U.S. Census. As with home sales, Hawaii’s median rent ($2,295) is almost four times as high as West Virginia’s.
States with the lowest monthly rent costs, October 2022
| State | Median rent in October 2022 |
|---|---|
| West Virginia | $595 |
| North Dakota | $855 |
| Iowa | $935 |
Places with the highest proportion of renters are New York (47%), California (45%), Nevada (43%) and Hawaii (40%). Almost all of these have median home listing prices that are among the highest in the nation.
Check out our best states for renters analysis for more detailed discussion of relevant facts.
Taxes
Since tax dollars often come out of a paycheck before it’s issued, it’s easy to overlook taxes as a budget item. But knowing how much is coming out of your check or being collected by state and local tax authorities can be crucial for financial planning.
To determine our low-tax honorees, we looked at state and local tax rates, the per-capita tax burden and state property tax as a share of family income (analogous to a tax rate).
Alaska, Tennessee and Wyoming levy no state or local income taxes. Property taxes in those states are below the U.S. average. As of 2018, on average, the middle 20% of U.S. taxpayers pay property tax equal to 3% of their annual family income.
All five of our tax-friendliest states pay a lower percentage than that. Residents of Louisiana, Alabama and West Virginia pay the lowest property tax rates in the nation: 1.2%, 1.3% and 1.4%, respectively.
States with lowest effective state-local tax rates, 2022
| State | Effective rate |
|---|---|
| Alaska | 4.60% |
| Wyoming | 7.50% |
| Tennessee | 7.60% |
Groceries
Food costs rose 13.5% nationwide from 2021 to 2022, the biggest jump in 43 years, according to PBS. “Groceries are at an all-time high and wages are not keeping up,” reported one surveyee from Georgia. “Prices on everything have gone up and you have to pick and choose what to buy and what to cut from your spending habits,” said a North Carolina woman.
More than 80% of surveyees cite food costs as a big budget hit, 58% cite gas prices, and more than 50% blame utility rates. About 35% say their cost of living exceeds their monthly income by more than 10%.
Much of the increase stems from global factors, such as climate change, avian flu outbreaks and grain shortages caused by the Russia-Ukraine war.
Grocery prices also rise as energy prices do, because most products are transported by truck or train.
But there's little evidence that statewide costs are lower in California, Iowa, Nebraska and Texas, where much of the nation’s food is grown and shorter transportation routes would be expected.
More influential is the urban/rural divide. Rural areas may be remote or inaccessible, so suppliers may charge a premium. Rural residents typically travel longer distances to shop. The added cost of the gas is one way they end up paying more for food — and noticing price inflation more — than urban residents do.
To normalize intrastate price gaps, we opted to look at grocery expenses as a percentage of consumers’ monthly budget rather than a dollar amount. These percentages reflect per-capita personal consumption expenditures as calculated by the BEA.
States with lowest percentage of household budget for groceries, 2021
| State | % of monthly budget used to buy groceries |
|---|---|
| Minnesota | 6.61% |
| Maryland | 6.71% |
| New York | 6.75% |
| South Dakota | 6.91% |
| North Dakota | 6.97% |
Health care
Health care and health insurance continue to be pricey everywhere. Procedure costs may differ significantly from state to state. For example, an in-network colonoscopy that costs $543 in Reno will set you back $730 in Brooklyn, according to price aggregator Fair Health Consumer. That’s why health care costs are worth considering when you’re picking an affordable state to live in.
For our state-by-state comparisons, we looked at medical costs through three lenses:
- Even people with health insurance don’t always find their coverage sufficient for their needs. We examined the Commonwealth Fund’s 2021 survey data on how likely state residents would be to skip getting care because of cost.
- Because 57% of people in the U.S. get health insurance through their employers, we looked at data from the Kaiser Family Foundation to find the average monthly premium paid by an employee for family coverage.
- We wanted to layer in data on health care spending in the context of a family budget. To do that, we used BEA data on personal consumption expenditures to see what share of per-capita spending goes to health care in each state.
In Michigan, family premiums for employer-sponsored insurance are lowest, averaging just over $4,000 per year. They’re almost twice as high (just over $7,600 per year) in North Carolina, the country’s costliest state.
It’s worth noting that two states where health care consumes a smaller share of family spending — Colorado and Nevada — have started or plan to offer public-option health insurance plans. These plans have the potential to further reduce residents’ health care expenses.
States with lowest percentage of household budget spent on health care, 2021
| State | % spent on health care |
|---|---|
| Nevada | 13.33% |
| Utah | 13.45% |
| Colorado | 13.80% |
Gas and utilities
Prices of electric power, home heating fuel and gasoline tend to rise and fall in tandem with the energy sector. Electricity prices were projected to rise 8% in 2022, when higher natural gas prices impacted power generation, according to the Energy Information Administration.
The states with the lowest utility costs are all on the Canadian border: Maine, Idaho, Vermont, Montana and North Dakota. Conversely, the highest utility costs are found in Alabama, on the Gulf Coast.
As for gasoline, prices are lowest in oil-producing Texas, neighboring Arkansas and nearby Missouri. The states where people spend the smallest share of their monthly outlay on gas are Hawaii (where gas prices are highest), New York and Massachusetts. Low expenditures in Northeastern states could reflect a combination of high wages and extensive use of public transportation there. Iowans, by contrast, spend almost 4% of their income on auto fuel, possibly owing to the use of farm equipment.
States with lowest utility costs relative to purchasing power, 2020
| State | Regional price parity |
|---|---|
| Maine | 69.8 |
| Idaho | 77.1 |
| Vermont | 80.4 |
| Montana | 80.8 |
| North Dakota | 81.5 |
Bottom line
Where people choose to live depends on their priorities. For some, it’s important to be near family or settle into a planned retirement somewhere. But if you’re focused on weathering a recession, your state’s affordability may matter most to you. “I'd move somewhere with lower state and lower real estate taxes,” said one man from Ohio.
Our study shows that low-cost living is easiest to achieve in these states:
- North Dakota
- West Virginia
- Michigan
- Louisiana
- Ohio
- South Dakota
- Missouri
- Kentucky
- Oklahoma
- Arkansas
These states are the most expensive places to live:
- Hawaii
- California
- New York
- Connecticut
- Massachusetts
- New Jersey
- Washington
- New Hampshire
- Oregon
- Vermont
Preparing for a recession is never easy, especially given the uncertainty about how long a downturn might last and how high interest rates might go. But moving somewhere affordable is one way to lower expenses, freeing up funds so you can pay down existing debt and build up emergency savings.
Methodology
In our calculation to determine which states are most affordable, we focused on six main cost factors. For each factor (data series), each state’s data value is indexed against the maximum value in the series.
- Housing rent/mortgage (35%): Each state’s score came from a combination of the state’s median listing price for home sales and its median overall apartment rent. The sources for these prices were Realtor.com and Apartment List, respectively. These elements were averaged, with weighting that reflects a state’s ratio of homeowners to renters (from iPropertyManagement.com).
- Tax burden (25%): State and local tax scores are based on 2022 figures for effective tax rates and per-capita averages (in dollars). This information came from the Tax Foundation. For each state we also incorporated the property tax rates paid by the middle 20% of its taxpayers. This data came from the Institute on Taxation and Economic Policy’s most recent distributional analysis of state tax systems (2018).
- Groceries (15%): This information reflects grocery spending as a share of per-capita spending by state residents. Data comes from the BEA and indicates the percentage of personal consumption expenditures (PCE) devoted to “food and beverages purchased for off-premises consumption” in 2021.
- Out-of-pocket health care costs (15%): Three elements combine equally for this score.
- The first is health care spending as a share of per-capita spending by state residents. Data comes from the BEA and refers to the 2021 PCE figures (aka “consumer spending”).
- The second is the state’s 2021 average annual family premium per enrolled employee for employer-based health insurance. This data comes from the Kaiser Family Foundation.
- The third is the percentage of adults in the state who went without medical care in 2021 due to cost. This data comes from The Commonwealth Fund.
- Gas/fuel for car (5%): This score represents the combination of two elements. The first is the state’s per-gallon cost of midgrade gasoline, as provided by AAA on Nov. 9, 2022. The second is the BEA’s “gasoline and other energy goods” percentage of 2021 PCE for that state.
- Home utilities (5%): This score directly reflects each state’s 2020 regional price index for utilities, as calculated by the BEA.
For each state, each of these six indexes is multiplied by its weighting percentage (shown in parentheses) to generate an index score for that factor. The total of a state’s six index scores is the state’s final score. States with the 10 lowest final scores are ranked as our top 10.
Article sources
- AAA, “ AAA Gas Prices .” Accessed Nov. 26, 2022.
- Apartment List, “ Data & Rent Estimates .” Accessed Nov. 9, 2022.
- The Commonwealth Fund, “ Adults who went without care because of cost .” Accessed Nov. 9, 2022.
- Institute on Taxation and Economic Policy, “ Who Pays? A Distributional Analysis of the Tax Systems in All 50 States .” Accessed Nov. 8, 2022.
- iPropertyManagement.com, “ Homeowners vs Renters Statistics .” Accessed Nov. 8, 2022.
- Kaiser Family Foundation, “ Average Annual Family Premium per Enrolled Employee For Employer-Based Health Insurance .” Accessed Nov. 9, 2022.
- Realtor.com, “ Real Estate Data .” Accessed Nov. 8, 2022.
- Tax Foundation, “ State-and-Local-Tax-Burdens-2022 .” Accessed Nov. 8, 2022.
- U.S. Bureau of Economic Analysis, " Regional Data: GDP and Personal Income ." Accessed Nov. 8, 2022.
- U.S. Bureau of Economic Analysis, “ Personal Consumption Expenditures by State, 2021 .” Accessed Nov. 8, 2022.