


The BMI was first developed in the mid-19th century as an indicator of how heavy a person is in relation to their height [weight(kg)/height(m)2](Reference Eknoyan1) and has since become the most employed marker of obesity today. Extensive research has been and continues to be done using BMI to assess physical status, risk of various diseases and health conditions and mortality in research and clinical settings(Reference Bhaskaran, Douglas and Forbes2–Reference Flegal, Kit and Orpana4). Other anthropometric indices of obesity that are commonly employed include waist circumference, waist-to-hip ratio and waist-to-height ratio(Reference Ashwell, Gunn and Gibson5,Reference De Koning, Merchant and Pogue6) . Waist circumference is a prominent indicator among these traditional anthropometric indices and an important measure of abdominal obesity that predicts obesity-related health risks and cardiovascular risk in adults as well as in children(Reference Pouliot, Despres and Lemieux7–Reference Lee, Huxley and Wildman9). However, despite the large body of relevant literature showing validity and practicality, traditional anthropometric indices of obesity continue to receive criticism for their inability to distinguish between different types of body composition(Reference Burkhauser and Cawley10,Reference Prentice and Jebb11) .
By definition, obesity is ‘abnormal or excessive fat accumulation that may impair health’,(12) but traditional anthropometric indices do not quantify fat and cannot differentiate between components of weight, or account for the covariates of fat(Reference Burkhauser and Cawley10). This problem needs to be addressed to promote the quality of assessment and develop more effective surveillance, prevention and treatment strategies. One meta-analysis reported that when compared with measured percent body fat (PBF), the BMI misclassified more than 50 % of obese participants as non-obese(Reference Okorodudu, Jumean and Montori13). Furthermore, a large study from the National Health and Nutrition Examination Survey estimated that over 74 million of US individuals are misclassified as either cardiometabolically unhealthy or cardiometabolically healthy(Reference Tomiyama, Hunger and Nguyen-Cuu14). Misclassifying such a large proportion of obese individuals as healthy and vice versa may lead to mismanagement of obesity-related risk and mental health issues on an individual level and inadequate resource provision and subsequent healthcare burden on a national and global level(Reference Tomiyama, Hunger and Nguyen-Cuu14–Reference Phelan, Burgess and Yeazel19).
New alternate anthropometric indices are continuously being developed to overcome the limitations of BMI, the most notable of which are the a body shape index (ABSI), the body roundness index (BRI) and the body adiposity index (BAI)(Reference Krakauer and Krakauer20–Reference Bergman, Stefanovski and Buchanan22). However, studies investigating these indices are limited in quantity, the findings are inconclusive or contradictory, and present limitations that can be improved on(Reference Freedman, Thornton and Pi‐Sunyer23–Reference Maessen, Eijsvogels and Verheggen25). For example, indices do not take into account important aspects of obesity such as age, sex and race or require the measurement of additional variables on top of the regular battery of tests. Therefore, the purpose of the current study was to propose a new anthropometric index, the ‘body fat index (BFI)’, to estimate dual-energy x-ray absorptiometry (DXA) measured PBF (DXA_PBF) using simple demographic and anthropometric variables that are commonly used in research and practice. Furthermore, the current study compares the correlations of BFI and previously developed anthropometric indices with DXA_PBF to determine their ability to accurately identify obese individuals.
Materials and methods
Study participants and protocol
Participants between the ages of 18 and 35 years were recruited through convenience sampling at Yonsei University, Seoul, South Korea, between 1 December 2015 and 30 June 2016. The study was advertised through posters and brochure distribution on campus with contact details of the research coordinator included. Potential participants contacted the research coordinator via email or phone, and the research purpose, protocol, risks and benefits were explained to the participants. Those who met the inclusion criteria of being between 18 and 35 years old, below 195 cm of height, and below 150 kg of weight (limits to the height and weight of participants were set due to the physical restraints of the DXA machinery) were scheduled for testing. Their contact details were recorded so that a reminder text message could be sent out 24 h prior to testing, with directions to the testing laboratory and instructions to refrain from engaging in high-intensity exercise 24 h prior to testing, consuming alcohol 24 h prior to testing, and having heavy meals within 3 h of testing.
Sample size calculations (power = 95 %, alpha = 5 %), performed with an effect size set at 0·17, five independent variables to analyse linear regression for DXA_PBF, and a dropout rate of 10 %, estimated eighty-eight participants. A total of eighty-seven young adults were recruited and participated in the study. On the day of testing, participants were provided a detailed description of the research purpose, protocol, risk and benefits. They were also notified that they could ask questions about the study at any time. The participants then signed informed consent forms that were approved by the Institutional Review Board of Yonsei University and were in accordance with the Declaration of Helsinki. Participants then provided basic demographic information (i.e. age, sex, race), before changing into light clothing provided by research staff. All personal belongings were removed for anthropometric measurements and DXA measurements.
Demographic information
Age, sex and race were self-reported by each participant in a short questionnaire. Age was recorded in years. Sex included male or female. Race was grouped into Asian and non-Asian, due to the fact that the Asian population have different criteria for many of the anthropometric indices, and because the non-Asian population were all from the USA.
Measurements
Height and weight were measured using a stadiometer and Inbody 720 (Biospace). All waist, hip and thigh circumferences were measured and recorded to the nearest 0·1 cm using a standard tape measure. All measurements were conducted twice, with a third measurement if the difference between the first two measurements was greater than 0·5 cm. All circumferences were measured with even distribution of weight, with feet placed 10 cm apart. Waist circumference was measured after exhalation at three locations: the narrowest circumference [WC1], midway between the lowest rib and the iliac crest [WC2] and at the superior border of the iliac crest [WC3](Reference Klein, Allison and Heymsfield26). Hip circumference was measured at the largest circumference. For the thigh circumference, the mid-thigh site was first marked midway between the inguinal crease and proximal border of the patella with a bent knee. Thigh circumference was then measured at the mid-thigh mark with the participants standing with feet 10 cm apart. For the DXA scan, participants were required to change into a hospital gown and lie in a supine position, and an experienced certified medical X-ray technologist conducted a whole-body DXA scan using the Prodigy Advance (GE Healthcare).
In addition to direct anthropometric measurements, the anthropometric indices (and their equations) that were used in the current study are as follows:
BMI: Weight (kg)/Height (m)2,
Waist to Hip Ratio [WHpR]: Waist Circumference (cm)/Hip Circumference (cm),
Waist to Height Ratio [WHtR]: Waist Circumference (cm)/Height (cm),
Thigh to Hip Ratio [THpR]: Thigh Circumference (cm)/Hip Circumference (cm),
Thigh to Height Ratio [THtR]: Thigh Circumference (cm)/Height (cm),
A Body Shape Index [ABSI]:(Reference Krakauer and Krakauer20) Waist Circumference (m)/(BMI2/3 * Height [m]1/2),
Body Roundness Index:(Reference Thomas, Bredlau and Bosy-Westphal21) 364·2–365·5 * (√(1 – ((Waist Circumference [m]/(2π))2/(Height [m]/2)2))),
Body Adiposity Index [BAI]:(Reference Bergman, Stefanovski and Buchanan22) Hip Circumference (cm)/(Height [m]1·5 − 18).
Statistical analysis
Descriptive statistics were conducted for all variables. All variables were checked for skewness, kurtosis and outliers. Obesity was defined according to DXA_PBF values and set as DXA_PBF > 25 % for males and DXA_PBF > 30 % for females(Reference Okorodudu, Jumean and Montori13). Multiple regression analyses were conducted to develop the BFI using forward selection to identify variables of interest. The same process was repeated after delimiting the variables in the BFI to measurements that are commonly collected in healthcare and research (i.e. age, sex, race, weight, height and waist circumference) to optimise practicality and maximise adoption. No significant advantages were found between the regression analysis that included all measured variables and the analysis that delimited variables (data not shown).
Pearson correlations between traditional, alternate and the proposed (BFI) anthropometric indices with DXA_PBF were calculated. Receiver operating characteristic (ROC) curve analysis was conducted to calculate area under the curve (AUC) and compare the ability to identify obese individuals across different anthropometric indices. All analyses were performed using the statistical software package IBM SPSS statistics 22 (IBM Corp.), and a P value of <0·05 was considered significant.
Results
Participant characteristics
A total of eighty-seven young adults (forty males and forty-seven females) were recruited and included in the analysis. The majority of whom were Caucasians (70·1 %), with Asians and African-Americans accounting for 23 % and 5·7 %, respectively. The mean age was 23·65 ± 4·13 years for males and 23·34 ± 3·84 years for females. Participant characteristics are shown in Table 1. The mean DXA_PBF and BMI were 20·53 ± 7·41 % and 24·28 ± 2·66 kg/m2 for males and 31·50 ± 8·06 % and 23·31 ± 2·74 kg/m2 for females, respectively. Significant differences existed in waist circumferences measured at the narrowest width [WC1], midway between the lowest rib and the iliac crest [WC2] and at the superior border of the iliac crest [WC3]. Significant differences were also observed between males and females for the majority of anthropometric measurements and indices. The mean DXA_PBF for the male sample was within the healthy range (20·53 ± 7·41 %), whereas the mean DXA_PBF for the female sample was in the obese range (31·50 ± 8·06 %).
Table 1 Participant’s physical characteristics

WC1, waist circumference measured at the narrowest width; WC2, waist circumference measured at the naval; WC3, waist circumference measured at the superior border of the iliac crest; DXA_PBF, percent body fat measured with a dual-energy x-ray absorptiometry.
* Significant difference of P < 0·05 with males.
** Significant difference of P < 0·001 with males.
a Significant difference of P < 0·001 with WC1.
b Significant difference of P < 0·001 with WC2.
Body fat index
Potential equations that predict DXA_PBF using demographic and anthropometric measurements are shown in Table 2. Correlation (r) and goodness of fit (r 2) values increased as more anthropometric measurements were included in the equation. All models showed significant positive correlations with DXA_PBF, with model 3 showing the highest correlation (r = 0·84), greatest fit (r 2 = 0·71) and smallest error (se of estimate (SEE) = 5·34 %) compared with other models. Model 3 is comprised of basic demographic characteristics (i.e. age, sex and race) and simple anthropometric measures (i.e. height, weight and waist circumference) of an individual.
Table 2 Percent body fat prediction equations using anthropometric measurements

Model 1: Race, sex, age.
Model 2: Race, sex, age, height, weight.
Model 3: Race, sex, age, height, weight, waist circumference.
SEE, standard error of estimate; x1, race (1 = Asian, 2 = non-Asian); x2, age (years); x3, sex (male = 1, 2 = female); x4, height (cm); x5, weight (kg); x6, waist circumference measured at the superior border of the iliac crest (cm).
** Significance of P < 0·001.
† Presented as percent body fat.
Correlation analysis
Correlations of anthropometric measurements and indices with DXA_PBF are shown in Table 3. Waist circumference measured at WC3 had a strong correlation with DXA_PBF (r = 0·49) and was higher than the correlations of DXA_PBF with WC1 (r = 0·06) and WC2 (r = 0·24). Hip circumference (r = 0·53), waist to height ratio (r = 0·68), BRI (r = 0·68) and BAI (r = 0·70) showed positive moderate-to-strong correlations with DXA_PBF. The proposed BFI models showed the highest positive correlations with DXA_PBF (r = 0·84).
Table 3 Correlation of anthropometric measurements and anthropometric indices with percent body fat measured with DXA

WC1, waist circumference measured at the narrowest width; WC2, waist circumference measured at the naval; WC3, waist circumference measured at the superior border of the iliac crest; DXA_PBF, percent body fat measured with a dual-energy x-ray absorptiometry.
* Significant correlation of P < 0·05 (2-tailed).
** Significant correlation of P < 0·001(2-tailed).
Identifying obese individuals
Anthropometric indices that showed moderate-to-strong ability to identify obese individuals, using ROC AUC analysis, are shown in Table 4. For traditional anthropometric indices, waist-to-height ratio (AUC = 0·86, 95 % CI = 0·77, 0·95) showed the largest AUC value followed by WC3 (AUC = 0·79, 95 % CI = 0·68, 0·89) and BMI (AUC = 0·71, 95 % CI = 0·60, 0·83). BRI (AUC = 0·86, 95 % CI = 0·77, 0·95) showed the largest AUC value for alternate anthropometric indices, followed by BAI (AUC = 0·83, 95 % CI = 0·74, 0·92) and ABSI (AUC = 0·73, 95 % CI = 0·62, 0·84). The proposed BFI (AUC = 0·91, 95 % CI = 0·85, 0·98) showed larger AUC values than both the traditional and alternate anthropometric indices.
Table 4 Identifying obese individuals using anthropometric indices
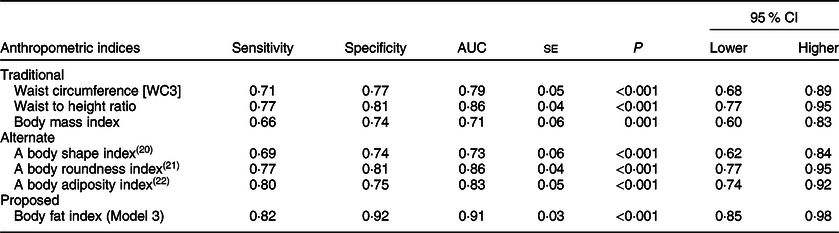
Obesity was defined as percent body fat >25 % for males and >30 % for females.
(Model 3) Model includes race, sex, age, height, weight, waist circumference.
AUC, area under the curve; WC3, waist circumference measured at the superior border of the iliac crest (WC3 was used to calculated waist to height ratio, a body shape index, body roundness index, and body fat index).
Discussion
The current study developed the BFI, an equation that can predict DXA_PBF using basic demographic information and simple anthropometric measurements of young adults. The BFI was then compared with traditional and alternate anthropometric indices that are currently being employed. The BFI showed a strong correlation (r = 0·84) with DXA_PBF. This correlation was higher than the correlations of DXA_PBF with traditional and alternate anthropometric indices, and the BFI was also the most accurate at identifying obese participants.
In the 21st century, alternate indices have been developed to overcome the limitations of the traditional anthropometric indices. The ABSI, BRI and BAI are the most notable examples of the alternate anthropometric indices, each has their advantages and disadvantages. Specifically, the ABSI combines waist circumference to the variables of BMI, weight and height, to calculate a ratio that reflects the body shape of individuals, which was found to predict mortality hazard independently of BMI(Reference Krakauer and Krakauer20). However, the majority of studies that used the ABSI found weaker associations with various cardiovascular conditions than BMI, and studies that investigated its association with PBF are limited(Reference Dhana, Kavousi and Ikram27–Reference Duncan, Mota and Vale30). The BRI uses waist circumference and height to score the roundness of an individual using a scale that ranges between 1 and 20, with 1 being narrowly shaped lean and 20 being round(Reference Thomas, Bredlau and Bosy-Westphal21). Though the BRI was initially developed to calculate the roundness of an individual as well as estimate PBF and percent visceral adipose tissue (%VAT), the equations to calculate the PBF and %VAT were not presented in the paper and only made available in the form of an automated online calculator, which makes it difficult to use in large-scale studies and difficult to validate. The majority of studies that investigated the BRI only focused on the roundness score, and mostly found the BRI to be superior to traditional anthropometric indices such as BMI and WC, at predicting various cardiovascular conditions(Reference Chang, Guo and Chen31–Reference Motamed, Rabiee and Hemasi34). Last, the BAI uses height and hip circumference to estimate PBF directly(Reference Bergman, Stefanovski and Buchanan22). BAI presents a clear advantage to traditional anthropometric indices, as one of the main limitations of traditional anthropometric indices was that they could not quantify fat. In fact, studies have consistently found BMI to misclassify the weight status of individuals, with some studies showing up to 50 % of obese individuals being misclassified as non-obese(Reference Gómez-Ambrosi, Silva and Galofré35–Reference Kennedy, Shea and Sun38). Furthermore, fat, or adipose tissue, is now acknowledged as an important endocrine organ(Reference Kershaw and Flier39,Reference Mohamed-Ali, Pinkney and Coppack40) , responsible for releasing adipocytokines and augmenting systemic inflammation, and increasing the risk of obesity-related disorders such as metabolic disorders, CVD and certain cancers(Reference Berg and Scherer41–Reference Hotamisligil45). However, though the BAI predicts PBF, studies have found that the BAI did not show clear advantages to BMI and other anthropometric indices at predicting PBF(Reference López, Cespedes and Vicente46–Reference Lam, Koh and Chen50), possibly because it does not take into account the influence of age, sex and race on fat(Reference Freedman, Thornton and Pi‐Sunyer23,Reference Johnson, Chumlea and Czerwinski24,Reference Barreira, Harrington and Staiano51,Reference Romero-Corral, Somers and Sierra-Johnson52) .
The BFI developed in the current study has some advantages over both the traditional and alternate anthropometric indices. First, the BFI is better able to monitor obesity as it estimates PBF, while previous anthropometric indices, with the exception of BAI, have used measurements or ratios that do not quantify fat directly. This is also advantageous because the use of arbitrary ratios requires further investigations to establish cut-off values and to understand their relationship with covariates, while PBF already has established cut-offs and substantial amounts of literature(Reference Okorodudu, Jumean and Montori13). Furthermore, in contrast to the arbitrary ratios and cut-off values of other anthropometric indices, the PBF is an easy concept to understand and explain, and may therefore aid in the adoption of the BFI. Second, the variables that comprise the BFI are basic demographic information and anthropometric measurements that are commonly collected in research and healthcare settings. In other words, BFI can immediately be validated from existing DXA databases of different populations and used to estimate PBF in national surveys or cohort studies. Next, previous anthropometric indices have not been able to account for the influence of the covariates of PBF such as age, sex and race. By including these variables into the equation, the BFI will be able to predict PBF more accurately in different population groups. An additional analysis (Supplementary Table 1) found the BFI to have positive predictive values (PPV) and negative predictive value (NPV) of 87·5 % and 87·1 %, respectively, compared with the 62·5 % and 57·1 % of traditional BMI values. Minimising the cases of false-negative and false-positive classifications of obesity will also allow for more appropriate prevention and management of health risks on an individual and national level. From a public health perspective, the BFI may prove to be a valuable tool to monitor the global obesity epidemic.
The current study had a relatively small sample size which may limit the generalisability of our findings. However, in additional analyses using randomly split datasets (2:1 ratio), we consistently found strong significant correlations between DXA_PBF and BFI, and the differences between the two were small and non-significant in both random samples (Supplementary Tables 2 and 3). A larger sample of a more diverse age group is needed to optimise the equations to the target population and to validate the performance of the equations. Such a sample will also allow for subgroup analysis of age, sex and race, offering additional insight into the differences that may exist between them and the current understanding of fat. A great strength of the BFI is that it can estimate fat without the need of specialised equipment or trained personnel, with basic demographic information and simple anthropometric measurements. The strengths of the current study are the measurement of PBF with DXA, which is considered the gold standard measurement, and the fact that all measurements were taken by trained specialists according to globally recognised protocol, reducing measurement error and increasing reproducibility.
In summary, the current study developed the BFI, which provides a way to directly estimate DXA_PBF using basic demographic information and simple anthropometric measurements that are routinely measured in research and practice. The findings demonstrate that, in addition to having higher correlations with DXA_PBF than traditional and alternate anthropometric indices, the BFI may be more accurate at identifying individuals with obesity. Further research is needed to validate the utility of BFI as a measure of obesity in different population and healthcare practice.
Acknowledgements
Financial support: This work was supported by the Samsung Electronics through Yonsei University (project number 2015–110–1098). Conflict of interest: All authors have declared no conflicts of interest. Authorship: H.I.Y., J.C.S. and J.Y.J. conceived and designed the study. All authors acquired data and interpreted the results. H.I.Y. and J.Y.J. drafted the manuscript. All authors revised the manuscript and approved the final version. Ethics of human subject participation: The current study was conducted according to the guidelines laid down in the Declaration of Helsinki, and all procedures involving research study participants were approved by the Institutional Review Board of Yonsei. Written informed consent was obtained from all subjects.
Supplementary material
For supplementary material accompanying this paper visit https://doi.org/10.1017/S1368980019004191.


